Prioritize...
At the end of this section, you should be able to
- Define "fingerprints" as used by scientists to identify the causes of observed climate changes.
- Explain why a warming trend near Earth’s surface alongside a cooling trend way up in the stratosphere supports human-driven climate change rather than natural warming.
Read...
Now, even though we are starting to build a compelling narrative, we cannot deduce the cause of the observed warming solely from the fact that the globe is warming. Perhaps the sun is getting brighter. Maybe an army of underground gnomes have discovered space heaters! In our quest to understand why the warming is occurring, we can look for possible clues. Just like a detective, climate scientists refer to these clues as 'fingerprints.' In climate science, ‘fingerprints’ are distinct patterns or markers that reveal the causes of observed changes. These patterns help us differentiate between natural climate influences (like volcanic eruptions) and human activities (such as greenhouse gas emissions). It turns out that natural sources of warming give rise to different patterns of temperature change than human sources, such as increasing greenhouse gases. This is particularly true when we look at the vertical pattern of warming in the atmosphere.
Key Definition:
A fingerprint is a distinct pattern or marker that helps identify the causes of observed climate changes and helps scientists partition changes between natural influences (like sunspots) and human activities (like greenhouse gas emissions).
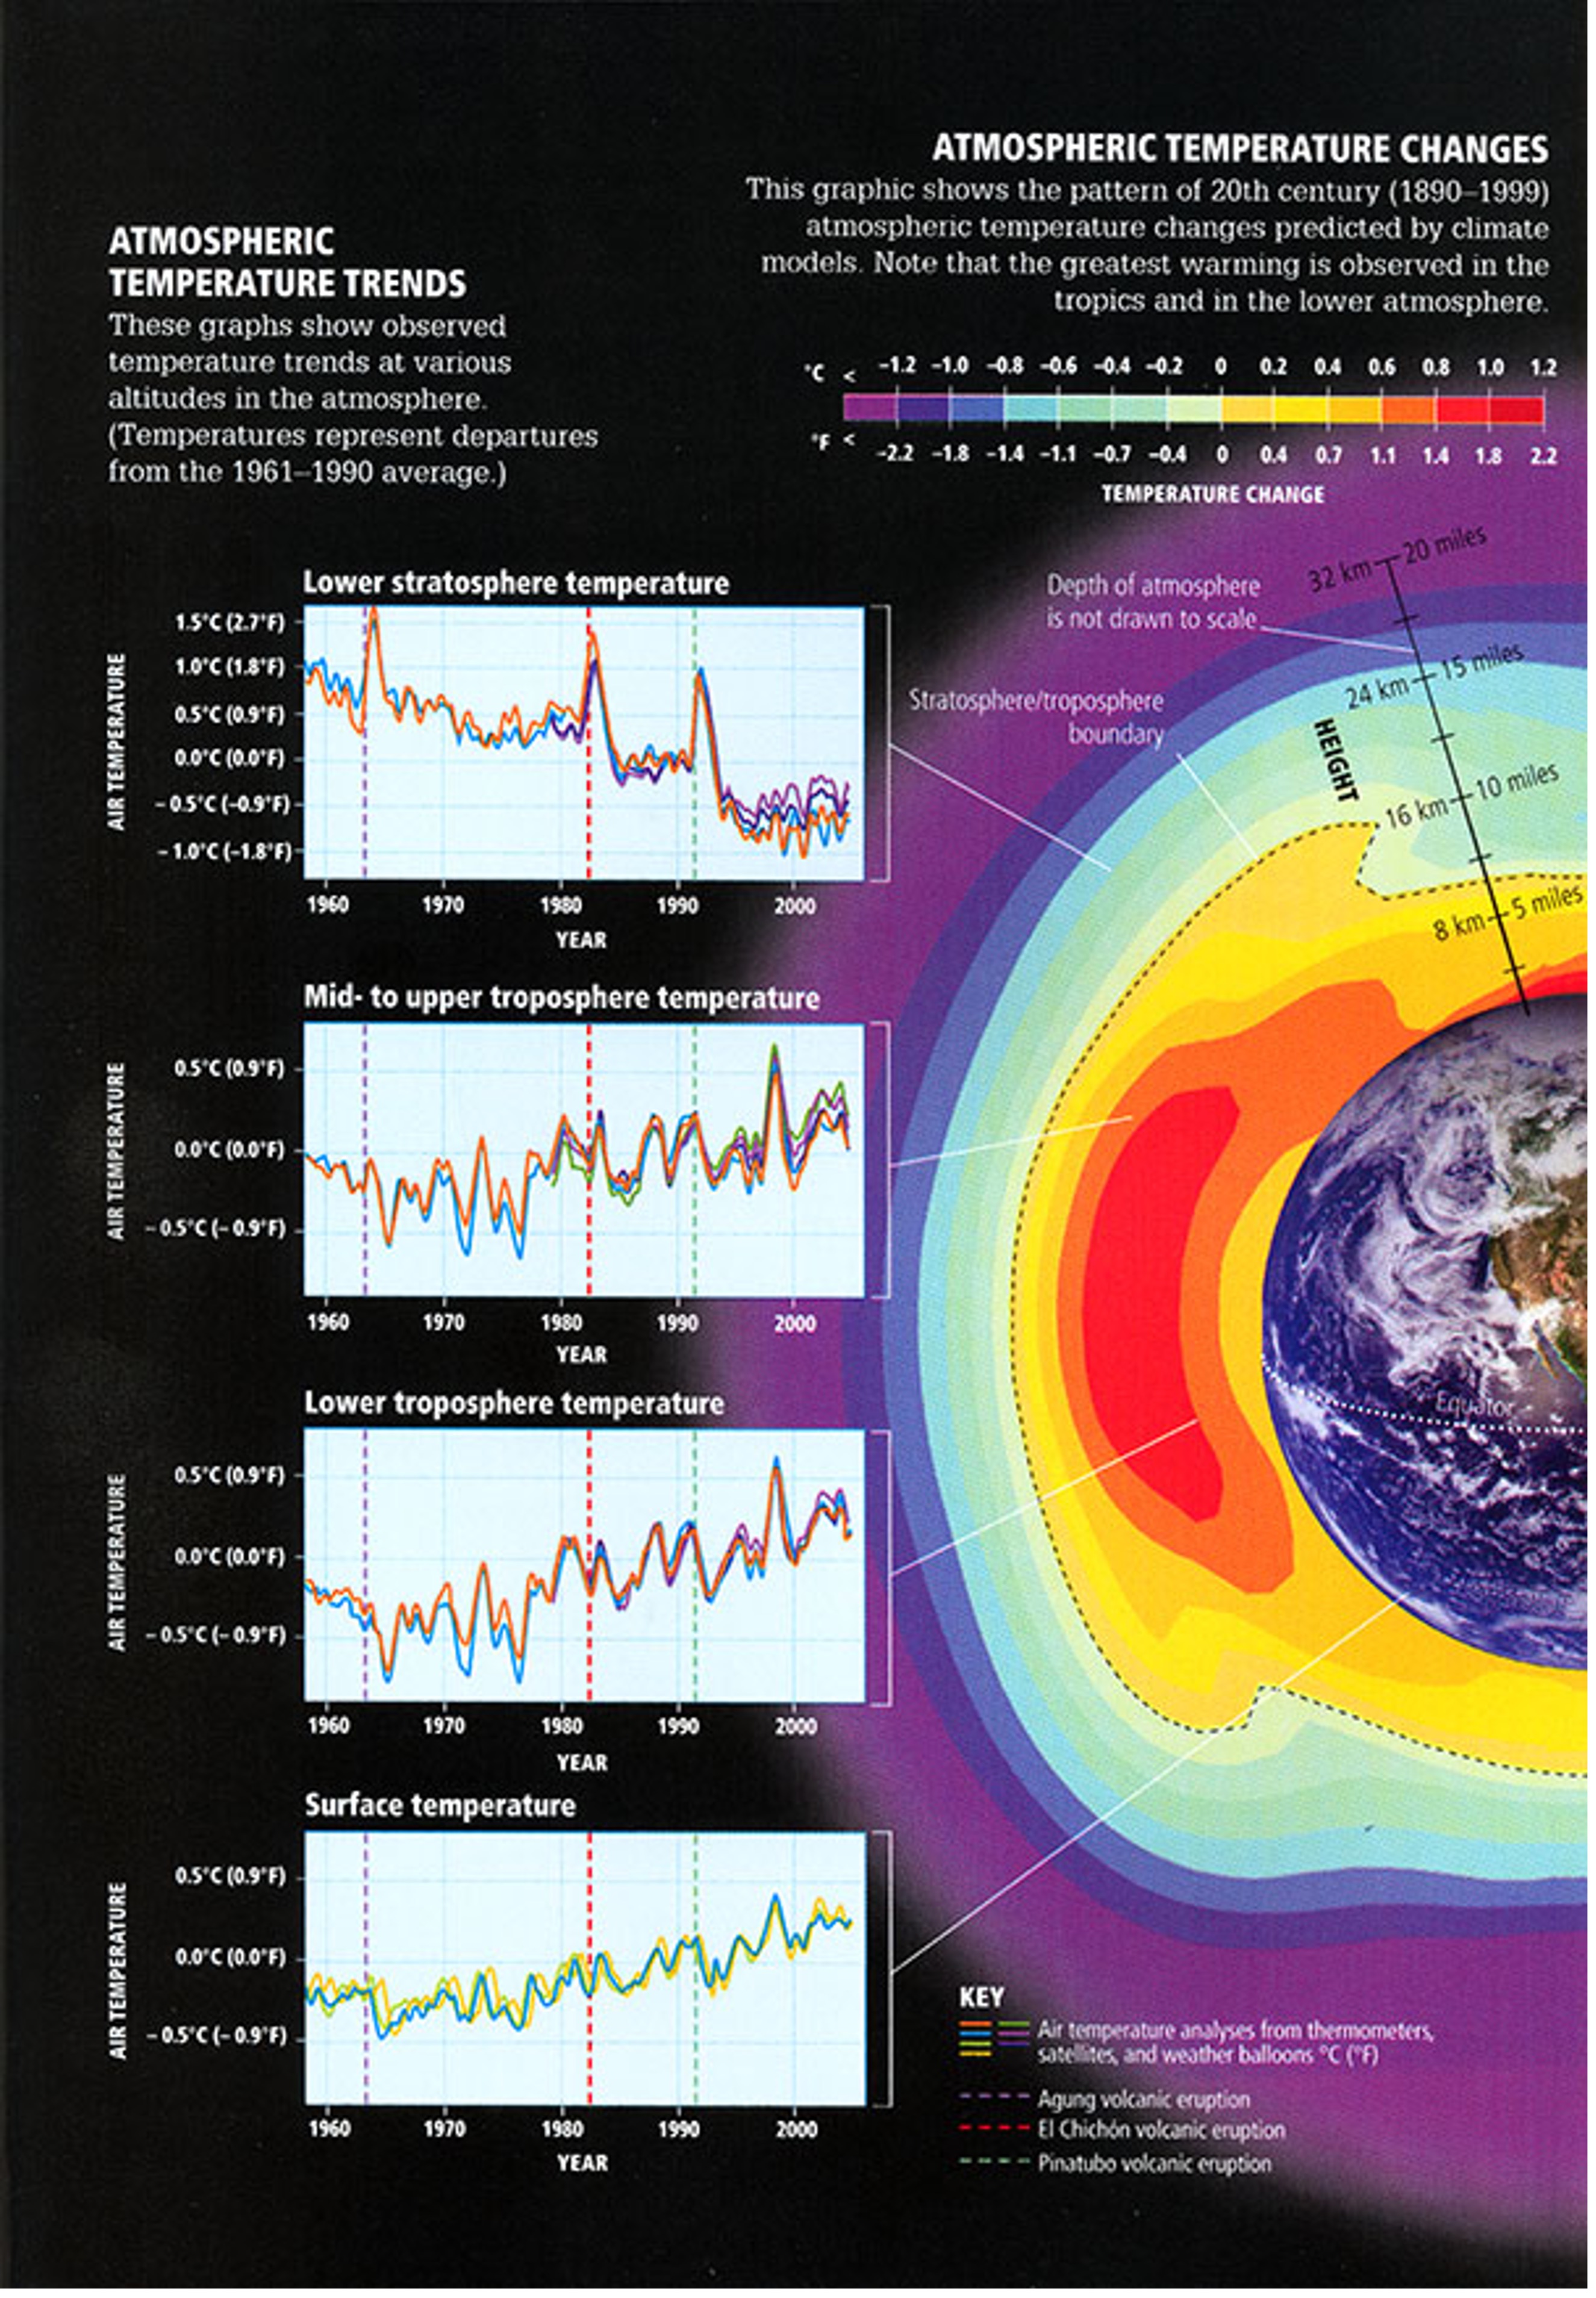
Unlike surface air temperatures, estimates of upper air temperatures (from weather balloons and satellites) have only been available for the latter part of the past century. Still, they reveal something remarkable! The lower part of the atmosphere—known as the troposphere, where we live—has been warming along with the surface. But when we look higher up in the atmosphere, particularly in the stratosphere, air temperatures have been dropping! Take a look at the figure below. The four timeseries on the left show global temperature changes from the stratosphere (top panel) down to the troposphere (middle two panels), and finally to the surface (bottom panel). The bottom three panels show consistent warming, but in the upper stratosphere, we see a clear cooling trend. In the "Lower Stratosphere Temperature" panel, you’ll notice the temperature drops from left to right, meaning it’s been getting cooler over time. So, what's going on?
Tropospheric Warming
Let’s focus on the warming trend in the lower atmosphere, known as the troposphere, which provides "part one" of our evidence for human-driven climate change. Greenhouse gases like CO₂ act like an insulating blanket around Earth, trapping warmth in the lower atmosphere, or troposphere. Here’s how: as the sun heats Earth, the surface emits some of that energy as infrared radiation. Greenhouse gases absorb this infrared energy and re-radiate it in all directions—including back toward the surface—creating a cycle of heat retention. With rising greenhouse gas levels, this trapping effect intensifies, warming the troposphere more and more. Because these gases have their highest concentrations within the lower atmosphere, the warming signal from additional greenhouse gases is expected to be concentrated near the surface, where the heat is initially captured and held.
Stratospheric Cooling
Now, for "part two," let’s take a look higher up—above where planes cruise—to the stratosphere. Unlike the warming we see in the troposphere, the stratosphere is actually cooling, and there are a couple of key reasons for this. First, because greenhouse gases trap heat in the troposphere, less heat makes it up to the stratosphere. Remember, these gases don’t create heat; they simply hold onto and re-radiate it... so the upper layers receive less energy. Second, remember when we discussed "other GHGs" and said that gases like halogenated and fluorinated compounds can break down ozone in the stratosphere? Ozone is crucial here because it A) absorbs solar radiation and B) likes to naturally hang out in the stratosphere for the most part (ozone does occur near the surface, but it's almost all due to pollution). With less ozone available, less sunlight gets absorbed in those layers, and less heat is generated in the stratosphere. Without this protective ozone layer to trap energy, more radiation simply passes through, continuing toward the surface instead of warming the upper atmosphere.
The simultaneous warming of the troposphere and cooling of the stratosphere is like a clear "tell" in climate’s version of poker—a move that unmistakably points to human-driven climate change. Natural factors, like an increase in solar energy, would either warm or cool all layers of the atmosphere at once. But when we examine temperature trends over the past 75 years or so in reanalysis data (our best historical reconstruction of the atmosphere), a distinct pattern emerges (see figure below): red, or warming, near the ground (below the dashed line marking the troposphere) and blue, or cooling, higher up in the stratosphere. Now, this isn’t a flawless fingerprint—there are still some warm areas higher up, mostly due to ozone changes in the Southern Hemisphere’s stratosphere. However, this overall pattern—warming below and cooling above—looks exactly like what we’d expect if greenhouse gases were the primary influence. This unique distribution aligns perfectly with our understanding of how greenhouse gases shift Earth’s energy balance, reinforcing the link between human activity and observed atmospheric changes.
