Prioritize...
When you finish this section, you should be able to:
- Define urban heat island and how it impacts local climate
- Define deforestation and describe how it may impact regional climate
Read...
While we often focus on emissions when talking about climate change, they’re not the only way humans influence the climate. Our impact can be felt on a much smaller scale, too. I want to share a couple with you...
Urban Heat Island
Take a look at the satellite image above from the afternoon of March 27, 2001. This is a typical infrared image, which can be used to infer temperature based on emitted infrared radiation. We know that clouds emit radiation, but it was clear over Minnesota at this time. So, what you’re seeing is a measure of the actual temperature of the Earth’s surface (with darker areas being warmer). Remember that the amount of radiation emitted is directly tied to temperature—the hotter something is, the more radiation it gives off.
Now, check out that large dark patch in eastern Minnesota, along with those smaller dark spots scattered around. Have any guesses as to what they are?
These local warm areas aren't some random shapes—those are cities! The biggest is the Minneapolis/St. Paul metro area, but you can also spot smaller cities like St. Cloud, Rochester, and Mankato. What you’re seeing here is the urban heat island effect, which refers to how cities tend to be significantly warmer than their rural surroundings. On a sunny day with light winds, cities tend to be several degrees warmer than their rural surroundings because pavement, buildings, and other urban materials absorb more solar radiation than their surroundings due to their lower albedo (reflectivity). On top of that, heat from cars, industry, and general human activity adds to the warmth. Meanwhile, the surrounding countryside, covered in vegetation with a higher albedo, stays cooler. Plants also release moisture through transpiration (we talked about this in the water lesson – transpiration is basically plant sweat), which further cools the area.
The difference in temperatures between urban and rural areas is most noticeable at night, especially on clear, calm winter nights following sunny days. As the city heats up more during the day, it stays warmer at night because concrete, asphalt, and buildings slowly release the heat they’ve absorbed. In contrast, rural areas cool down faster since they didn’t heat up as much during the day. So, urban areas tend to be warmer than surrounding rural ones, both during the day and at night.
In the infrared satellite image above, the urban heat islands are particularly striking because the surrounding countryside was snow-covered. If you look below at a visible satellite image of this region, the rural areas appear white due to the high albedo of snow, while the cities, where much of the snow had melted, appear darker because of their lower albedo.
The takeaway here is that these satellite images look the way they do because humans have significantly altered the local environment. They’re a clear illustration of how human activity impacts weather and climate on a local scale. But the urban heat island effect—localized warmth and lower albedo—isn’t the only change happening in the concrete jungles of our cities. Numerous studies suggest that rainfall tends to increase downwind of large metropolitan areas, especially in the summer when winds are typically weaker. This setup allows urban heat islands to act as local "hot spots," promoting instability and encouraging rising air currents. Essentially, the warmer, buoyant air over cities rises, forming tall cumulus clouds, which can grow into showers and thunderstorms as they drift downwind.
One of the first and most comprehensive studies to measure the effect of urban areas on precipitation was METROMEX (METROpolitan Meteorological EXperiment). This multi-year research project, which started in 1971 in St. Louis, Missouri, found that average summertime rainfall, as well as the frequency of thunderstorms and hail, increased by up to 25% in a broad area around the city, extending 40 miles eastward. Similar studies in other cities like Chicago and Washington, D.C., have shown comparable results.
To visualize the urban impact on convection, take a look at the lightning flash density around Houston, Texas, from 1989 to 2001. The image below shows the number of lightning strikes per square kilometer per year. As you can see, the highest flash density is downwind (east) of the city, illustrating how the urban environment can influence storm development and increase lightning activity.
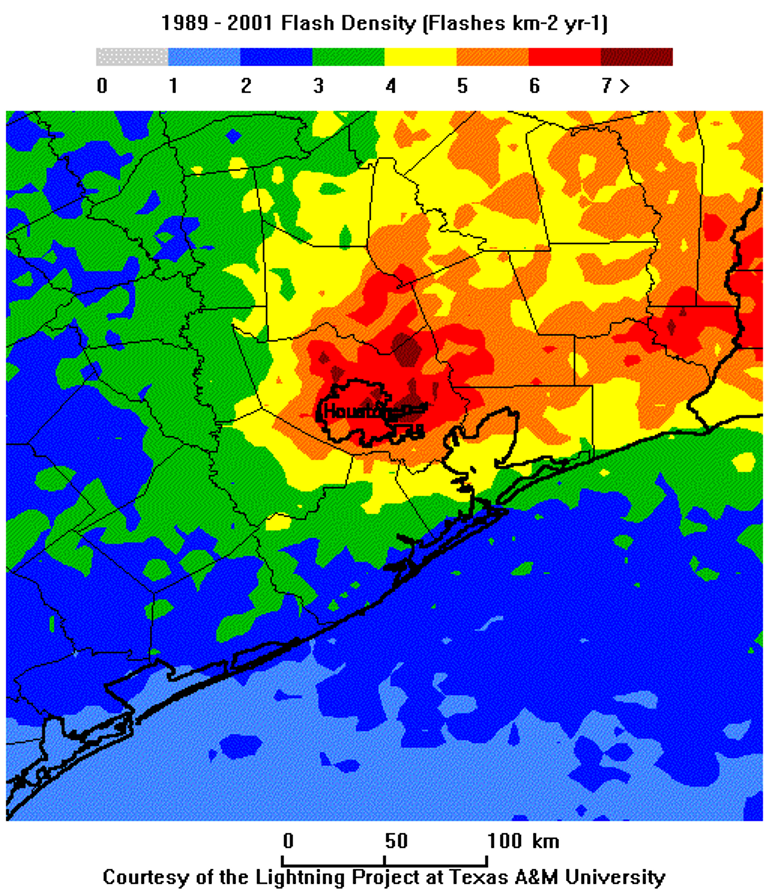
Lightning Flash Density in the Houston area from 1989 – 2001.
Notice that the highest concentration of lightning strikes occurred just downwind (east) of Houston. This study found a 45% increase in flash density downwind of the city compared to the upwind suburbs (mainly west of the city). These results align with findings from a broader study of 16 Midwestern cities which showed that lightning strike frequency downwind of cities was, on average, 40% higher than in rural areas upwind. This increased lightning activity corresponds with higher rainfall rates downwind of cities compared to rural, upwind areas.
But the effects of urbanization aren't just limited to temperature and precipitation. The changes in the landscape—removing vegetation and soil, and replacing them with impervious paved surfaces and drainage systems—alter what happens to precipitation after it falls. More water runs directly into rivers and streams, rather than being absorbed by the ground and plants. This increased runoff means that urban streams rise faster and are more prone to flooding during heavy rain compared to rural streams.
So, land use and urban development play a key role in shaping local weather and climate. And even if land isn’t urbanized, changes in land use can still have major impacts. That brings us to...
Deforestation
Deforestation is the clearing of forests to make way for agriculture, pastures, or urban development, and it has a wide range of both global and local impacts. Here, we'll focus on its effects on temperature and the hydrologic cycle. Trees and plants in forests act as water reservoirs and help keep local temperatures in check because a portion of the sun’s energy is used to evaporate water from the forested environment. In deforested areas, however, more water runs off directly into streams and rivers, leaving less moisture to evaporate. With less water available for evaporation, more of the sun’s energy goes toward warming the surface, which heats the air above.
This effect is particularly striking in tropical rainforests. NASA estimates that clearing rainforests down to bare ground can raise local temperatures by as much as 3°F, which significantly impacts the local climate. Tropical rainforests are not only humid and rainy, but they also recycle a lot of water back into the atmosphere through evaporation and transpiration. This creates a cycle where the water vapor encourages more cloud formation and rainfall. In extreme cases, like in the Amazon Basin, trees are estimated to help generate about half of the region’s rainfall! So, when rainforests are destroyed, the local rainfall significantly decreases.
Besides the moisture impacts, deforestation also increases the surface's albedo, meaning more sunlight is reflected back into space instead of being absorbed by the ground. This limits the amount of energy transferred into the lower atmosphere. You can clearly see the difference in albedo between forested and non-forested areas in satellite images taken on a clear day—forests appear darker compared to agricultural lands. The contrast is even more dramatic during the winter when snow covers the ground, as shown below in this visible satellite image from January 18, 2018. The image shows the contrast between the low albedo of forested regions compared to snow-covered, agricultural valley regions. For a closer look, here's the full-sized image.

In many regions, deforestation is thought to cause a slight cooling effect. This happens because the increased albedo (more sunlight being reflected) outweighs the drying effects—where more of the sun’s energy is directed toward warming the surface rather than evaporating water from it. Essentially, with fewer trees to absorb sunlight and less water to evaporate, more solar radiation is reflected back into space, leading to a net cooling. However, tropical rainforests are a major exception. In these regions, the massive disruption to the hydrologic cycle—primarily the sharp drop in evaporation—tips the scales toward warming, making local temperatures rise instead of cool.