The King of All Greenhouse Gases: Carbon Dioxide
Prioritize...
After reading this section, you should be able to:
- Identify the century when carbon dioxide emissions from human activities started increasing and why.
- Describe the relative contribution of different fossil fuel sources to the world’s total carbon dioxide emissions.
Read...
Remember earlier in the class when we talked about “greenhouse gases” and how they absorb and emit infrared radiation? The contributions of greenhouse gases to downwelling infrared radiation from the atmosphere to surface are what create the greenhouse effect, which plays a crucial role in warming our planet.
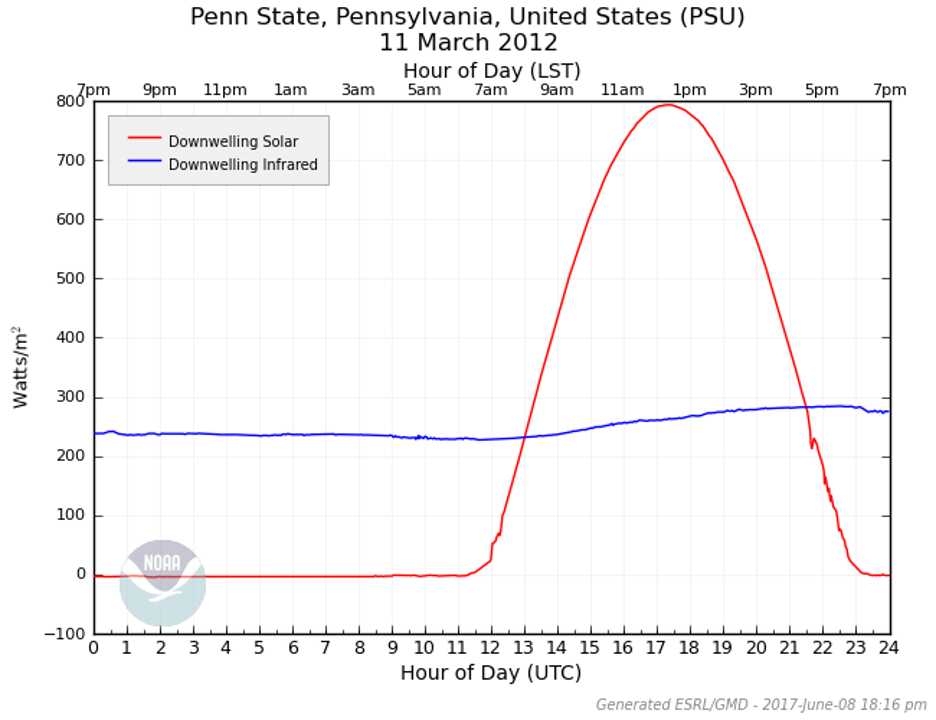
Take a look at the graph below. It shows measurements of downward shortwave and longwave radiation in State College, PA, taken on March 11, 2012. The red curve represents the diurnal cycle of sunlight. It's what we expect: hitting “0” at night (it's dark!) and reaching its peak around local noon. That makes sense, right? Sunlight drives the shortwave radiation, so the cycle follows the sun’s rise and set.
But now look at the blue line. This represents downwelling longwave radiation. Unlike the red curve, it’s nearly constant throughout the day, with a slight peak during the hottest part of the afternoon. Here’s the interesting part: this was a perfectly sunny day—no clouds, no rain—so this blue line isn’t doing anything sneaky. Rather, it shows the constant emission of infrared energy from greenhouse gases in the atmosphere, warming the surface below. Whether day or night, greenhouse gases are always radiating energy down to the surface, which is why this line stays steady. We've used the 24/7 analogy in this class before -- greenhouse gases are no different... always there, always on.
Now I want you to remember that without the greenhouse gases in our atmosphere the Earth system would be much (MUCH!) colder than it is today. The greenhouse effect is a completely natural process, and the warmth it generates is essential for life on our planet. In fact, the greenhouse effect is not just normal—it’s something we absolutely depend on!
So, if the greenhouse effect is both natural and essential, why are we so concerned about human-driven climate change? Great question. It all comes down to balance. As we’ve talked about, burning fossil fuels takes carbon that’s been stored deep within the Earth and releases it by combining it with oxygen in the air, creating extra carbon dioxide (CO₂) beyond the natural levels the atmosphere normally handles.
Think of it this way: imagine the atmosphere as a bathtub already filled to a certain level. Adding CO₂ from burning fossil fuels is like pouring extra water into that tub. Sure, it can handle a little more water, but if you keep pouring too fast and too much, it’s bound to overflow. Similarly, excessive CO₂ emissions from human activities are disrupting the Earth’s finely tuned climate balance, tipping the scales toward global warming.
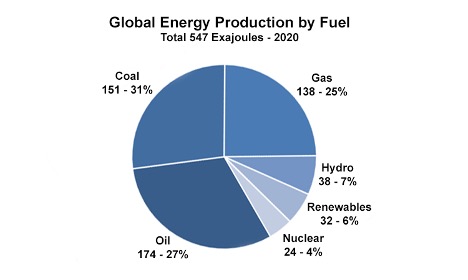
CO₂ emissions grew slowly in the 1800s, but emissions skyrocketed as the population expanded and fossil fuels became the backbone of industrialization. In fact, carbon dioxide emissions have increased more than tenfold since 1900 (Credit: U.S. Department of Energy). While renewables like wind, solar, and nuclear power have chipped away at the dominance of fossil fuels over the past few decades, around 80 percent of the world’s energy still comes from "the big three" of coal, natural gas, and oil. The figure below for 2020 shows this split, with coal, oil, and gas each contributing a sizable portion to global energy production.