Prioritize...
When you're finished with this page, you should be able to:
- Define the Pacific Decadal Oscillation (PDO) and describe its basic properties and characteristics
- Give at least two examples of how the Pacific Decadal Oscillation (PDO) influences weather patterns and marine ecosystems, particularly along the U.S. West Coast and in the North Pacific.
Read...
While ENSO tends to get most of the attention when it comes to ocean-atmosphere interactions, there's another important player in the Pacific Ocean: the Pacific Decadal Oscillation (PDO). Unlike ENSO, which operates on shorter timescales of 2 to 7 years, the PDO unfolds over much longer periods -- with cycles lasting 20 to 30 years. That means that in a standard lifespan, a human may only observe 2-4 phases of the PDO! What makes the PDO particularly interesting is that it’s relatively new to the world of climate science. It wasn’t officially named until 1996 when fisheries scientist Steven Hare made an intriguing observation. While studying salmon populations in the North Pacific, Dr. Hare noticed something unusual: dramatic shifts in salmon production seemed to line up with changes in sea surface temperatures, particularly during major reversals in 1947 and 1977. These shifts, which corresponded to reversals in the polarity of the Pacific Decadal Oscillation, indicated a larger climate pattern at play. As cool waters gave way to warmer ones—or vice versa—the effects rippled through the ocean ecosystem, especially along the coasts from Alaska to California. Hare's work connected these changes to a long-term, recurring oscillation in sea surface temperatures, which not only influenced marine life but also impacted coastal air temperatures across the region. This discovery of the PDO shed new light on how decadal-scale climate variability could affect everything from fisheries to weather patterns along the Pacific coast.

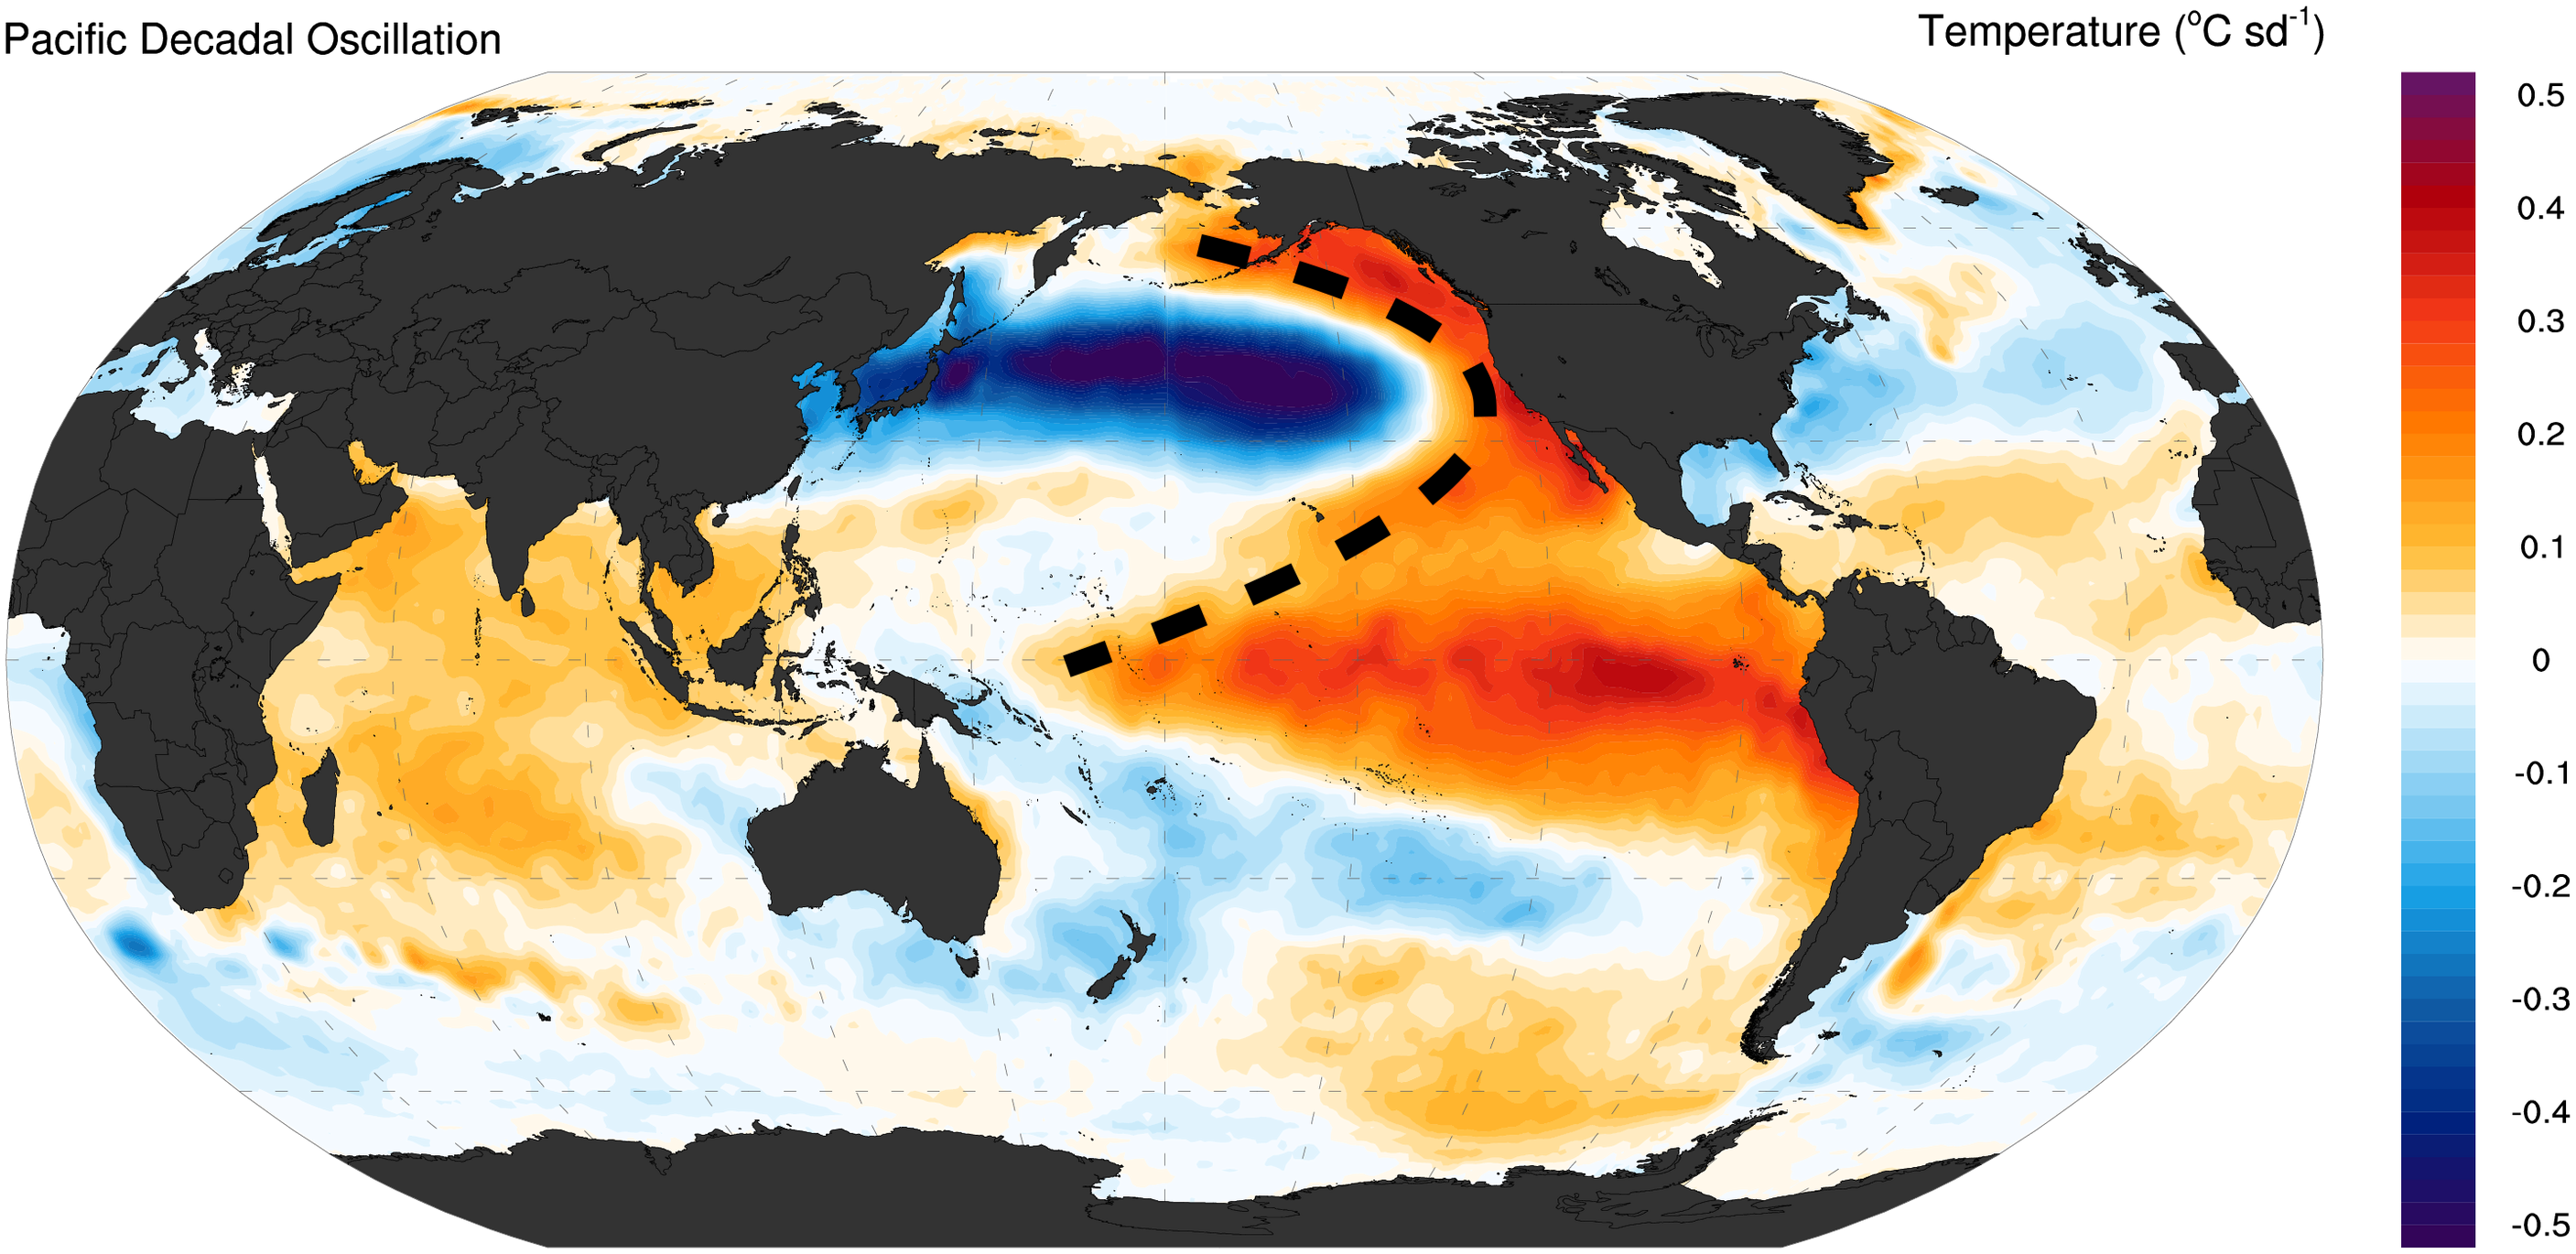
The PDO shares some similarities with ENSO, particularly in how sea surface temperatures shift, but it operates on a much longer timescale and impacts a different region. During its positive (or warm) phase, sea surface temperatures (SSTs) in the eastern North Pacific (north of 20°N) rise, while cooler-than-average waters form in the central and western North Pacific. Check out the below figure, which is an anomaly map (our old friend!) of global sea surface temperatures. Note the curved "horseshoe" of warmer temperatures wrapping around the cooler ones that I've annotated with a black dashed line -- in climate circles the PDO is commonly described using this horseshoe shape!
In the negative (or cold) phase, the pattern flips. Take the above figure and just mentally swap all the reds with blues and the blues with reds! Below is another graphic that shows both phases, although note the differences in the colorbar from the example above! Warm waters dominate the western Pacific, while the east (the horseshoe part) cools down. Unlike ENSO, which has its strongest influence in the tropics, the PDO mainly affects the higher latitudes in the Pacific, particularly areas north of 20°N or so. The shifts between its warm and cold phases aren’t as quick as ENSO’s, either—scientists believe that these transitions are driven by oceanic waves that take their time, roughly a decade, to propagate across the vast expanse of the North Pacific. This slower, longer-term nature of the PDO means its impacts are more drawn out, but still significant, especially for regions that rely on stable climate patterns, like the coastal ecosystems and fisheries of the Pacific Northwest.

Throughout the last century, we've seen several major PDO phase shifts. Look at the PDO time series below. For example, it moved from cold to warm around the 1920s and flipped back to cold right around the time World War II was wrapping up (mid-1940s). More recently, there was a significant shift from a cold to warm phase in 1976-77, which coincided with reductions in human-emitted pollution following the implementation of the Clean Air Act (we'll talk more about this when we talk about aerosols in a little while). Why is this noteworthy? Both the PDO phase shift and reduced aerosols contributed to warmer sea surface temperatures in the North Pacific, making it harder for scientists to separate the natural variability (what we are talking about in this lesson) of the PDO from human-induced climate changes (what we still need to discuss!) during that time.

Let's wrap up the discussion on the PDO with an important point: Can the state of the PDO actually predict anything about the atmosphere? The short answer is—it’s complicated. The PDO primarily represents an oceanic response to atmospheric changes, so we have to be cautious when attributing major shifts in atmospheric circulation directly to the PDO. That said, it can still have important local influences. Along the West Coast of the United States, for instance, a positive PDO phase, with its warmer-than-average ocean waters, often brings warmer winters and increased rainfall. On the flip side, regions like Asia and Australia might face drought conditions during these phases.
In addition to influencing weather, the PDO has notable impacts on marine ecosystems, especially fisheries. In Alaska, for example, salmon production tends to be higher during the positive (warm) phase of the PDO, which makes understanding this oscillation crucial for fishery managers and scientists alike. So, while the PDO’s direct role in atmospheric changes is limited, it plays a significant part in shaping regional climate patterns and marine life.
However, when it comes to explaining broader precipitation patterns, especially across western North America, the PDO takes a backseat to ENSO. See the maps below. They show how linked both PDO and ENSO are with precipitation anomalies in the United States. Note how the colors are "darker" for the ENSO, which shows that ENSO has a much more direct physical connection to rainfall variability. In fact, part of the reason PDO impacts can look similar to those of ENSO is because ENSO itself is a key part of the broader PDO pattern.

So, while the PDO index gives us a good sense of how various ocean and atmospheric processes are playing out in the North Pacific, it’s not necessarily the PDO itself driving weather changes. Instead, it’s the mixture of these processes that can affect weather and climate across places like the United States, with the PDO acting more as an indicator of these dynamics rather than the direct driver.