Prioritize...
On this page, you will learn:
- Define sunspots and faculae, and explain how sunspots can change how much energy the sun emits in the short-term
- Explain how sunspots relate to solar radiation and their relative importance in forcing the Earth’s climate.
Read...
As we've learned, the sun is our primary source of energy. While it's incredibly consistent to the point where we actually define the amount of energy coming into the climate system as the solar constant there are tiny fluctuations in the amount of energy it releases. One of the most intriguing features related to these variations is sunspots—dark blotches or patches on the Sun’s surface that have been observed by humans for centuries. In fact, sunspots were regularly reported in Chinese literature as far back as the 4th century. In 1609, Galileo, with his newly invented telescope, was able to observe them in greater detail, documenting their presence by counting the number of visible spots. Now I should note that you should never (ever!) stare directly into the sun! However, before we talk about the science behind sunspots and their impact on the climate, here's a way you can observe the sun if you want to go sunspot hunting right now or maybe after you finish this lesson!
Explore Further...
You can easily observe the sun safely by using a simple and inexpensive device called a "pinhole camera." All you need are a few basic materials and some sunshine. Here’s what you’ll need:
- 2 sheets of stiff white paper
- (Optional) a sheet of aluminum foil
- A pin
- A sunny day
First, take one of the sheets of paper and carefully punch a small hole in the center using the pin. The example below makes this a bit easier by cutting a square out of your paper, taping some aluminum foil over that square, then pricking a hole in the foil. In both cases, this is going to be your lens. Head outside and hold the paper up, aiming the hole at the Sun—just be sure not to look directly at the Sun through the hole (or in any other way!). Next, use the second sheet of paper to act as a screen. Move it back and forth until the image of the Sun coming through the hole looks clear. What you’re seeing isn’t just a dot of light—it’s actually a tiny image of the Sun projected through that pinhole!

Now for some fun experiments: try making the hole larger or smaller and see how that changes the image. Or imagine this what if you punched a thousand tiny holes in the paper and placed little lenses in front of each one? You’d get a super-bright, sharp image as all the individual solar images would converge. In fact, optical telescopes work on a similar principle, combining light from countless tiny points into a single focused image.
If you’re feeling creative, you can even upgrade your pinhole camera. Add a stand to hold the paper, use a screen for better projection, or go all out and turn it into an actual camera by adding film. There’s plenty of inspiration out there — perform an internet search for "pinhole camera" for ideas to take it to the next level!
If you are persistent, you'll be able to see sunspots (at least large ones) with the above method! So, what exactly are sunspots?
Sunspots
Sunspots are dark patches on the Sun’s surface that appear cooler and emit less solar radiation than the surrounding areas. Though they may last anywhere from a day to several months, they are constantly changing and shifting. Their size can vary dramatically, ranging from about 100 kilometers to a staggering 10,000 kilometers—larger than the Earth! At any given moment, only about 0.0 to 0.1% of the Sun's visible surface from Earth is covered by sunspots. These spots form due to disturbances in the Sun’s magnetic field, disrupting the normal flow of energy.
In the figure below, we have images of the Sun’s surface taken on two different days—April 29, 2002, and April 29, 2009. The visible light images (which represent what we’d see with our own eyes) show a stark difference in the number of sunspots for the two days. On April 29, 2002, you can spot a large number of sunspots as dark spots scattered across the Sun, while on April 29, 2009, no fewer sunspots are apparent. If you look at the ultraviolet images, you’ll also notice something else—bright regions surrounding the sunspots. These are called faculae. The word "faculae" is borrowed from the Latin for "little torch." While sunspots emit about 15% less solar radiation, the faculae around them are actually more intense, releasing 25% more solar radiation. So, even though sunspots themselves are darker and cooler, the existence of these faculae can actually lead to an overall increase in the amount of solar energy reaching Earth when more sunspots are present!

Total Solar Irradiance (TSI)
The existence of sunspots tweak the amount of energy the Earth recieves from the sun -- what does that mean for us? Thanks to the advent of satellite measurements, we can now directly measure the Sun’s energy output—this is known as the total solar irradiance, or TSI for short. Earth-orbiting satellites are equipped with extremely precise instruments capable of detecting even small changes in TSI. However, these measurements aren’t always perfectly accurate, and the average values of TSI can vary between satellites. To address this, scientists adjust the data, stitching together measurements from multiple satellites to create a continuous and reliable record.
In the figure below, you’ll find TSI measurements from various satellites over the past few decades, alongside the number of sunspots. The two data sets correspond remarkably well—when we see an increase in sunspots, there’s a corresponding rise in solar radiation, and when sunspots are few, the TSI dips. By leveraging this relationship between sunspot numbers and TSI, scientists can actually reconstruct fluctuations in solar radiation going all the way back to the 1600s. This long-term reconstruction works similarly to how scientists reconstruct Earth’s temperature record, as we discussed earlier in this section, giving us deeper insights into how the Sun’s variability affects our climate over centuries.
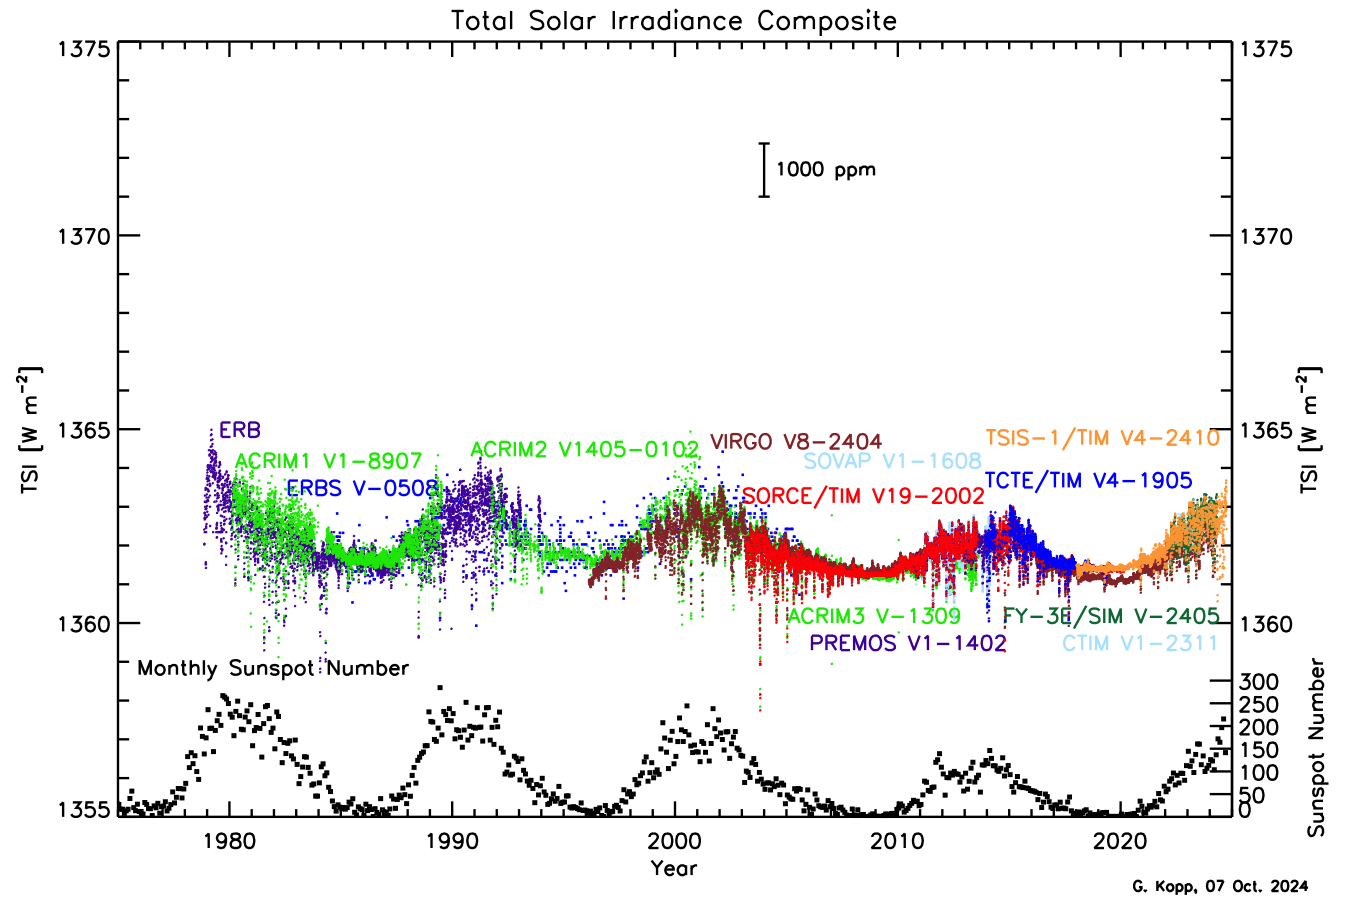
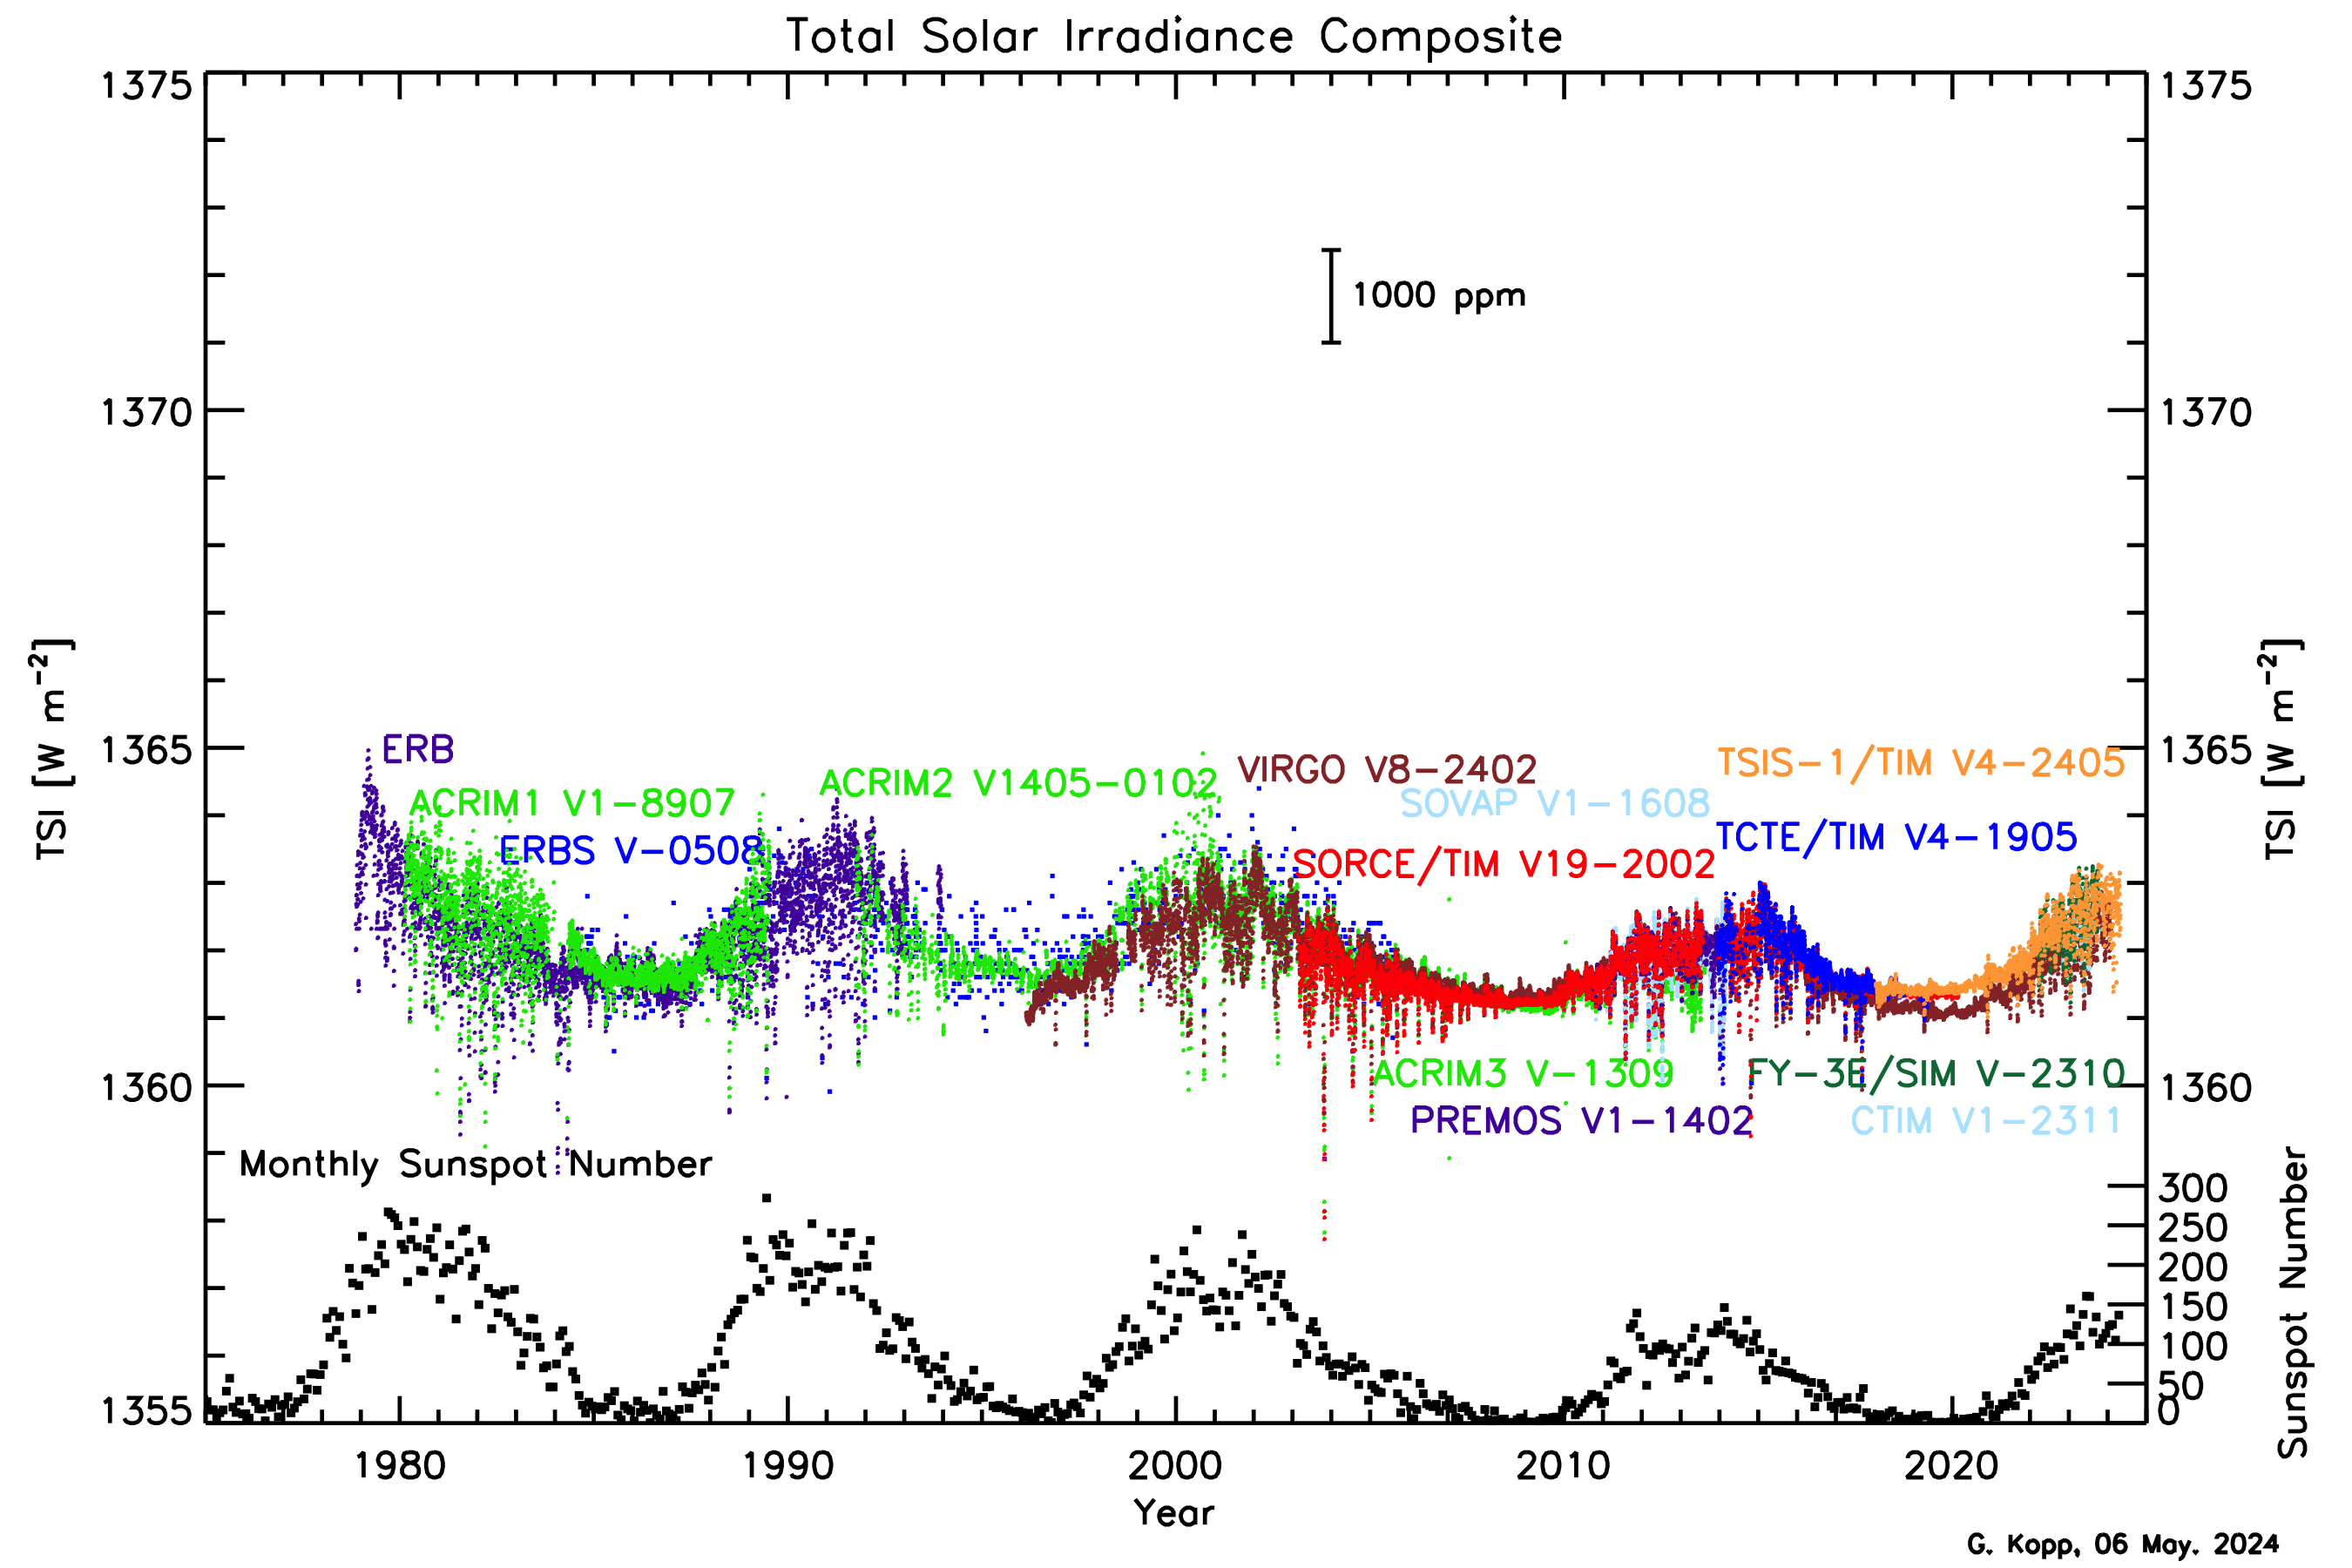
In the figure above, you’ll notice a regular cycle in both TSI and sunspots, which occurs roughly every 11 years. The total amount of radiation the Earth receives from the Sun varies by about 0.1% between the high and low points of these cycles. If we take a longer view looking at sunspot numbers as far back as the 1600s in the figure below - we can see that these cycles have been repeating for a long time. In addition to the 11-year cycles, there are longer term fluctuations that occur over 80-90 years, known as Gleissberg cycles. Sunspot activity tends to be relatively low during certain periods, such as the early 1800s, early 1900s, and early 2000s, with higher activity occurring in between.
One particularly notable feature of the sunspot record is the pronounced absence of sunspots from 1650 to 1715, a period known as the Maunder Minimum. This era, named after British astronomers Edward and Annie Maunder, represents a time when the Sun's activity was unusually low. During this period, global temperatures were also lower, especially in the Northern Hemisphere, contributing to what is often called the "Little Ice Age." This wasn't a true ice age like we previously discussed, but it was a time marked by colder winters and significant climatic shifts in Europe and North America. Although the exact cause of this diminished solar activity remains a mystery, recent research by astronomers from Penn State (led by undergraduate-at-the-time Anna Baum!) has uncovered evidence of a similar phenomenon occurring in another star, offering intriguing clues about these solar mysteries.

Now, I want to stress that while the amount of radiation the Earth receives from the sun does change, this variability plays a relatively minor role in influencing the Earth's temperature. A quick back-of-the-envelope calculation on the effect of fluctuations in TSI (which I won't make you do, but meteorology majors study!) shows that the impact on the planet’s surface temperature is less than 0.1°C. Furthermore, we’ve been in a period of declining fluctuations in solar activity since the 1950s. These variations are also accounted for in climate models, where we can confirm that they play a minor role in driving changes in the Earth's temperature compared to other factors like greenhouse gas concentrations. So, when talking heads say, "climate change is just a bunch of sunspot cycles," they aren't totally wrong, but observed changes in the sun are a drop in the bucket compared to the temperature changes we are currently observing and expect to observe in the future.