Prioritize...
Upon finishing this page, you should be able to discuss the Dvorak Technique, classify a tropical cyclone's cloud pattern as one of the four basic categories (curved band, shear, central dense overcast, or eye), and identify the range of Current Intensity (CI) numbers that correspond to these basic categories.
Read...
One of the primary goals of this course is for you to develop the ability to comprehend the discussions, advisories, and forecasts issued by the National Hurricane Center. In this section we're going to look at another commonly referenced term found in many NHC discussions -- the Dvorak Technique. For starters, check out the excerpt from the NHC forecast discussion from 5 PM EDT on October 25, 2025, for Hurricane Melissa, which forecasters suspected was about to undergo a round of rapid intensification.
ZCZC MIATCDAT3 ALL
TTAA00 KNHC DDHHMM

Hurricane Melissa Discussion Number  18
NWS National Hurricane Center Miami FL       AL132025
500 PM EDT Sat Oct 25 2025

Melissa is likely beginning a period of rapid intensification (RI).
Since both the NOAA-P3 and Air Force Reserve C-130 aircraft sampled
the system this morning, the satellite presentation has continued to
improve, with cold -75 to -80 C cloud tops wrapping around the
center with hints of an eye starting to appear on visible images.
The eye is also becoming better defined on radar images out of
Jamaica with an overall diameter of around 20 n mi. In addition, an
earlier GMI microwave pass received after the prior advisory showed
a well-defined cyan ring on the 37-GHz, which is often a harbinger
of RI. Subjective Dvorak intensity estimates were T5.0/90 kt from
SAB, and T4.5/77 kt from TAFB. The objective estimates from UW-CIMSS
were a little lower, but are also quickly rising, and the initial
intensity will be set at 80 kt this advisory, blending these
intensity estimates.
If you read the above excerpt, you should note a few things. First, forecasters were able to benefit from data collected by the Hurricane Hunters that we just learned about. They also based their analysis on several satellite-based remote sensing tools that we're about to learn about, including the Dvorak Technique. In a nutshell, the Dvorak Technique is an analysis procedure for estimating the intensity of tropical cyclones based on cloud patterns on satellite imagery. The technique is named after Vernon Dvorak, who pioneered the technique with his research in the 1970s and early 1980s.
How does the Dvorak Technique work? In a nutshell, it's really just a statistical system that combines observed cloud patterns on satellite imagery with a set of established guidelines (based on years of observations) to estimate the intensity of a tropical cyclone. These estimates are called T Numbers, which range from 1.0 to 8.0. So, the reference to "T5.0" and "T4.5" in the discussion above correlated to intensity estimates of 90 knots and 77 knots, respectively. If you look at the formal Dvorak scale (opens in a new window), you'll notice that the scale refers to a "CI Number" (Current Intensity Number) and not, specifically, a "T Number". However, the two are usually highly similar. Forecasters arrive at a T Number (which estimates a tropical cyclone's intensity) by comparing cloud patterns on a single satellite image (sometimes referred to as the "satellite presentation") to a set of statistical guidelines. Once forecasters determine a T Number, they can then modify it in an attempt to preserve the continuity of past (recent) estimates and account for recent trends in the satellite presentation (indicative of intensification or weakening). The final value, after any modifications, represents the Current Intensity (CI) Number.
Manually conducting a complete Dvorak analysis to arrive at a specific T Number (and adjust to a CI Number) is a fairly complex process, which requires a great deal of experience to perform well. Don't worry, you won't be asked to perform such detailed analyses in this course, but if you're interested in seeing some more details, you may be interested in some of the links in the Explore Further section below. Still, it probably won't come as a surprise to you that some subjectivity exists when forecasters attempt to classify cloud patterns, which is one drawback to the technique. Indeed, in the Hurricane Melissa forecast discussion above, note that two different groups of forecasters arrived at slightly different T Numbers. However, the discussion also references "objective estimates" which refers to objective computer analyses that have been developed to take the subjective element out of Dvorak estimations. If you're interested in learning more about this evolution and the details of these objective schemes, check out the Explore Further section below. One standard objective technique is the Advanced Dvorak Technique (ADT), which attempts to achieve the accuracy of the original Dvorak Technique without the subjective limitations. Like the manual Dvorak Technique, the ADT can be applied to any tropical cyclone across the globe, in any phase of its life-cycle.
Forecasters have also developed a version of the ADT enhanced by artificial intelligence, known as the Advanced (AI-Enhanced) Dvorak Technique, or AiDT. In short, the machine learning models that underlie the technique are based on 12 years of ADT estimates for tropical cyclones compared to their official best track estimates of intensity. By learning from the errors in the training dataset, the AiDT is able to improve upon the ADT estimates, resulting in roughly a 20% improvement, on average. The graph below plots both the ADT and AiDT CIs for Hurricane Melissa throughout its life. Note that much of the time, the differences between the ADT and AiDT estimates are quite small, but when there is a more noticeable difference, the AiDT number is usually closer to the official best track intensity (the black line).
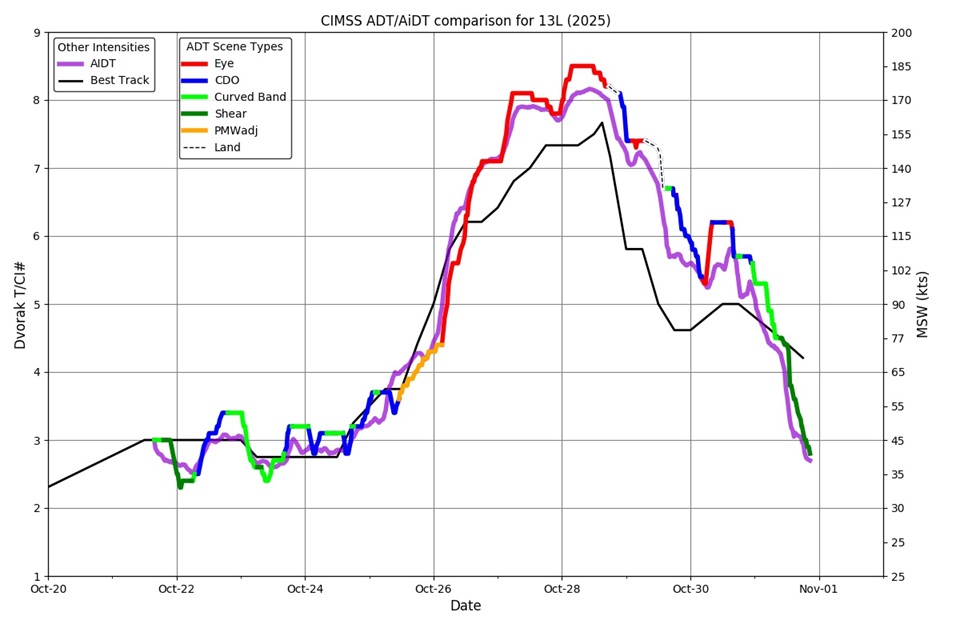
You may also notice that around the time of its peak intensity, Melissa's ADT and AiDT numbers were actually above 8.0! How is that possible, if the scale stops at 8? Well, for starters, let's look at Melissa on enhanced infrared imagery Melissa on enhanced infrared imagery (opens in a new window) early on October 28 (near the time when the intensity peaked). The storm had a perfectly circular eye surrounded by a highly symmetric ring of very cold cloud tops, approaching 180 Kelvin (about -93 degrees Celsius)! Melissa was about as close to "satellite perfection" as it gets, and the original Dvorak technique didn't account for a warm eye embedded so deeply in cloud tops that cold. In such cases, the objective computer-based Dvorak approaches may produce T/CI numbers slightly greater than 8, though this doesn't happen very often (it's a sign of an incredibly impressive satellite presentation).
While using objective approaches like the ADT and AiDT has many advantages, performing subjective analyses manually still has value. Referring back to the Hurricane Melissa discussion near the top of the page, you'll notice that forecasters referenced both subjective and objective approaches in their analysis. Indeed, analysts and researchers still regularly conduct manual Dvorak analyses. While you won't have to do complete Dvorak analyses in this course, conducting some basic Dvorak classifications can still help you become "one with the atmosphere" so that you can really be in tune with how a particular storm is evolving. As your experience grows in tropical weather forecasting, you will discover that tropical cyclones appear in a variety of sizes and shapes on satellite imagery. A major component of the Dvorak Technique hinges on forecasters classifying the shape and pattern of clouds they observe on visible and infrared satellite imagery into four basic categories, which you should be sure to know (click on each one to see a brief description and an example):
- Curved-band pattern
Often observed in the early stages of tropical cyclone development, this pattern is characterized by a band of dense cloudiness that begins to curve around the center of the storm. In weak hurricanes, the band coils entirely around the center of the storm. For example, Check out this infrared image that shows the curved-band pattern (opens in a new window) associated with a tropical storm with maximum sustained wind speeds of 60 miles per hour. At the time, the curved band wrapped around most of the center of the storm.
- Shear pattern
Typically observed in the formative stages of a tropical cyclone or during weakening, the shear pattern is characterized by deep convective clouds moving to one side of the storm's center. For example, check out this satellite image of a sheared tropical storm (opens in a new window) with maximum sustained wind speeds of 45 miles per hour. Note that the center of low-level circulation lies to the north of the deep convection, indicative of relatively strong northerly shear between 850 mb and 200 mb. Recall that a tropical cyclone is in a weakened state when upper-level winds push deep convection away from the storm's low-level circulation.
- Central Dense Overcast (CDO) Pattern
The CDO pattern describes the region of dense cirrus clouds that shrouds the core of a tropical cyclone, which is sometimes observed in stronger tropical depressions, tropical storms, and weak hurricanes. The presence of a CDO pattern sometimes indicates that intensification has stalled or is being delayed. For example, this satellite image showing a CDO pattern (opens in a new window) reveals a canopy of very cold cloud tops consolidated around the center of the storm. At this time, the storm was on the verge of being upgraded to a hurricane. For tropical depressions, tropical storms, and some weak hurricanes, the CDO appears fairly homogeneous (uniformly cold cloud-tops on infrared imagery) with no eye readily apparent.
I say "readily" because an embryonic eye may have already "secretly" formed. As a tropical cyclone intensifies, an eye typically starts to develop near the center of the tightening spiral associated with the cyclone's primary curved band. But, the CDO typically masks most of this emerging pattern from the view of conventional satellite imagery (high cloud tops shield lower-level features from detection by visible and infrared imagery). Forecasters do have tools for detecting these "secret" eyes, which we'll explore later in the lesson, but forecasters continue to use the Dvorak CDO pattern until an eye appears on conventional satellite imagery.- Eye Pattern
Once an eye is evident on conventional satellite imagery, an "eye pattern" exists. After the eye emerges, a large surrounding ring of cold convective cloud remains (which were formerly part of the CDO). For example, about 15 hours after the infrared image capturing the CDO pattern above, an eye emerged on infrared imagery (opens in a new window). The newly apparent eye appears as an oasis of warmth within the surrounding cold convective clouds as this storm was intensifying quickly into a major hurricane, with maximum sustained wind speeds of 120 miles per hour a few hours after the time of this image.
Eye patterns can characterize tropical cyclones of widely varying intensities. For example, a storm that has an eye could be a Category 1 or a Category 5 hurricane. That's a huge difference, but both would fall under the eye pattern! To further help forecasters refine their assessments based on eye patterns, they look at specific characteristics of the eye. For example, recognizing the eye of a hurricane is banded (check out this example of a banded eye (opens in a new window)) helps meteorologists recognize that a hurricane is weak (essentially a curve band had finished coiling entirely around the center of the storm to form the "banded eye"). On the other hand, highly circular eyes with few clouds surrounded by a thick symmetric ring of cold CDO cloud typically indicate a storm with major hurricane intensity (as in this enhanced infrared image of a super typhoon (opens in a new window)). Tropical forecasters look at a specially enhanced infrared satellite image called a Dvorak image to help them distinguish between various eye patterns. By using this imagery to determine the radiating temperature of the eye and compare it to the radiating temperatures of the surrounding cloud tops, they can more specifically assess the intensity of a particular hurricane. As a general rule, the larger the difference in temperatures between the eye and the surrounding cloud tops, the stronger the hurricane.
However, I should point out that hurricanes with very small eyes can present challenges to objective Dvorak analyses. When an eye is very small, the gradients in radiating temperatures within the eye and eye wall may not be depicted accurately on Dvorak imagery, lending the impression that the difference between temperatures in the eye and the surrounding cloud tops is less than it actually is. For example, check out the image slider below, showing Super Typhoon Chanthu's tiny pinhole eye on higher-resolution visible imagery compared to Dvorak imagery (advance the slider to see the Dvorak image). The Dvorak image doesn't really do justice to the characteristics of the tiny eye, which can lead to intensity estimates that are too low.
After classifying the cloud pattern and looking at satellite-derived temperatures, forecasters completing the Dvorak Technique manually would take into account other factors such as trends in the cloud pattern that indicate a weakening or intensification and assign a T Number and CI Number, which range from 0 to 8 in increments of 0.5. Officially, T Numbers and CI Numbers appear in a coded format (opens in a new window), which you may be interested in if you're into tracking tropical cyclones in real-time. But, how do these numbers translate to storm intensity? Below is a chart that links the estimated CI number with the basic patterns of clouds that I described above. Current Intensity Numbers have also been calibrated against aircraft reconnaissance of tropical cyclones in the Northwest Pacific and Atlantic Oceans. On average, the CI Numbers correspond to the specific wind speeds and central barometric pressures also shown in the graphic below.

In case you're wondering, the reason for the basin differences in central pressures at a fixed CI Number is that the overall mean sea-level pressures are lower in the Northwest Pacific (more details later in the course). So, given a central pressure and maximum sustained wind speed associated with an Atlantic tropical cyclone, the central pressure of storm in the Northwest Pacific must essentially be lower for it to generate the same wind speed. Remember, it's the pressure gradient that largely determines wind speed, which is why small tropical cyclones can generate stronger winds than a larger cyclone with the same minimum central pressure. It's important to keep in mind that the Dvorak intensity estimates in the graphic above are merely averages.
As you track tropical cyclones in real-time, you'll regularly see references to T Numbers and CI Numbers in discussions from NHC and JTWC, and a number of sites online provide Dvorak analysis data (links are in the Explore Further section below, if you're interested). With what you now know about the Dvorak Technique, you should be able to interpret those references and understand what they suggest about a tropical cyclone's current status. The Dvorak Technique, however, is far from the only way that satellites are used in tropical cyclone forecasting. We'll explore another intriguing use of satellite data on the next page with a discussion of "Cloud-Drift Winds."
Explore Further...
Dvorak Technique Data on the Web
If you're looking for Dvorak technique data to assess current storms, check out these resources:
- Cooperative Institute for Meteorological Satellite Studies (CIMSS) ADT page (opens in a new window) (includes current Dvorak ratings and time series for individual storms)
- CIMSS AiDT page (opens in a new window) (similar to the ADT page, but for the AiDT)
- NOAA ADT/AiDT page (opens in a new window) (includes AiDT time series, as well as satellite imagery
- RAMMB-CIRA Real-Time Tropical Cyclones page (opens in a new window) (click on your storm of interest, then "Satellite", and look for the IR image with "BD Curve Enhancement" to get Dvorak Imagery)
More on the Dvorak Technique
While I gave a basic picture of the Dvorak Technique in this section, I didn't really get into the nitty-gritty details of how to perform the technique manually, which takes a great amount of skill and experience! The execution of the Dvorak Technique has evolved over the years from completely manual analyses to the objective automated analyses of the ADT and AiDT. If you're a real tropical weather aficionado, you may be interested in learning more about the details of this evolution, from the details of Dvorak's original technique through the development and evolution of objective computerized versions. The academic papers below will enrich your understanding (although they contain material well beyond the scope of the course):
- Dvorak's seminal paper (opens in a new window) from 1984
- Paper on the development of the Objective Dvorak Technique (ODT) (opens in a new window) from 1998
- Paper on the development of the Advanced Dvorak Technique (ADT) (opens in a new window) from 2007
- Paper on the development of the Advanced (AI-Enhanced) Dvorak Technique (AiDT) (opens in a new window) from 2021
- A very readable paper describing the Dvorak Technique and its history (opens in a new window) from the Bulletin of the American Meteorological Society in 2006.