Figure 4 illustrates projected changes in other parts of the hydrological cycle during the time period 2081-2100 relative to 1986-2005 according to the high greenhouse gas emissions scenario (RCP 8.5). Note that the number of competing climate models represented for each panel of the figure is indicated by a number in the top right (range: 32-39 different models are averaged for each prediction). Future projections of water runoff or soil moisture are dependent on precipitation, which, as discussed earlier, is itself subject to substantial uncertainties. Nevertheless, it is worth considering what the variety of competing climate models have to say. For example, note the general (if slight) decrease in relative humidity over most land masses and a slight increase in relative humidity over the oceans (middle panel, left column). The middle panel in the right column shows changes in the difference between evaporation and precipitation with blue colors indicating a relatively wetter future (more precipitation relative to evaporation) and red colors indicating a relatively drier future (more evaporation than precipitation). The bottom panel in the left column predicts changes in surface water runoff. Note the significant declines in runoff throughout the southwestern US and southern Europe/northern Africa and parts of South America. This same trend is amplified in predictions of soil moisture, which is a primary control on plant growth (bottom panel, right column).
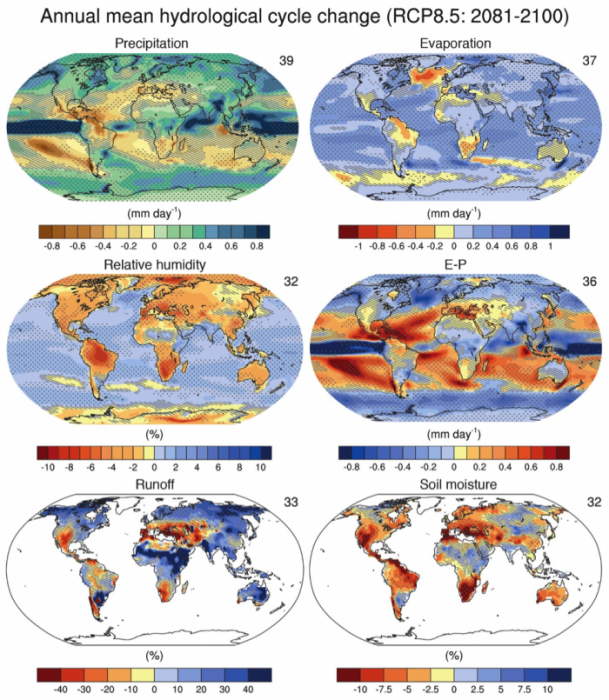
Figure 4. (IPCC TFE.1, Figure 3) Annual mean changes in precipitation (P), evaporation (E), relative humidity, E – P, runoff and soil moisture for 2081–2100 relative to 1986–2005 under the Representative Concentration Pathway RCP8.5 (see Box TS.6). The number of Coupled Model Intercomparison Project Phase 5 (CMIP5) models to calculate the multi-model mean is indicated in the upper right corner of each panel. Hatching indicates regions where the multi-model mean change is less than one standard deviation of internal variability. Stippling indicates regions where the multi-model mean change is greater than two standard deviations of internal variability and where 90% of models agree on the sign of change (see Box 12.1).