Earth 107N - Coastal Processes, Hazards, and Society
Earth 107N - Coastal Processes, Hazards, and SocietyQuick Facts
Instructors: Tim Bralower (Fall); Diane (Dinah) Maygarden (Spring)
Overview
Earth 107N will provide students with a global perspective on coastal landscapes, the processes responsible for their formation, diversity, and change over time, as well as societal responses to current changes in the coastal zones around the world. Emphasis is placed on hazards, including hurricanes, tsunamis, and the growing threat of sea level rise. Active learning elements include analyzing real data sets and applying critical thinking and problem-solving skills to real-world coastal issues that affect human populations. Students will complete a capstone project in which they examine how coastal cities worldwide are planning for the future.
This course is offered as part of the Repository of Open and Affordable Materials at Penn State. You are welcome to use and reuse materials that appear on this site (other than those copyrighted by others) subject to the licensing agreement linked to the bottom of this and every page.
Want to join us? Students who register for this Penn State course gain access to assignments and instructor feedback and earn academic credit. Official course descriptions and curricular details can be reviewed in the University Bulletin.
Module 1: Societies and Economics of Coastal Regions
Module 1: Societies and Economics of Coastal RegionsIntroduction
Each year brings new and bigger disasters to coastal communities around the world. Summer 2017 brought Harvey to Houston, Irma to the Caribbean and Florida, and Maria to the Caribbean. Summer 2018 brought us Hurricane Michael to the Florida Panhandle coast and Hurricane Florence to North Carolina, with devastating results. Not to be outdone, the Summer of 2019 brought Hurricane Dorian, which wreaked havoc in the Bahamas. The summer of 2022 brought Ian to southwest Florida. Fast forward to 2024 and Hurricane Helene delivered record breaking and devastating rainfall to the southeast US including the region around Asheville NC. Finally, 2025 saw Hurricane Melissa that intensified dramatically and devastated Jamaica. Each of these recent storms had unique effects on hundreds of communities, large and small, many of which are still struggling to recover. Looking back further in time, Hurricane Katrina (2005), Superstorm Sandy (2012), Super Typhoon Haiyan (2013), the Tsunami of Christmas (2004), and the Japanese Tsunami of 2011, all grabbed the world's attention. We all see images on our screens of the devastation and misery that result from these natural disasters. The ready accessibility of worldwide information on social media means we all have a certain level of knowledge about these disasters. However, coastal flooding is not limited to these notable storm effects. Communities around the world are dealing with quieter, yet still destructive, flooding caused by ongoing sea level rise. You may have heard about sunny day flooding in Miami, FL, and Annapolis, MD. These are just two examples of communities dealing with more frequent flooding related to sea level rise. By 2100 the situation will get much worse. With a projected sea level rise of 2-3 feet, more than 100 million people in coastal areas around the world would be displaced.
What is it like to live in a city that is highly vulnerable to coastal flooding, and what kinds of actions are people taking to protect themselves? This first module will introduce you to a few of the most vulnerable coastal cities and communities around the world through exploration via Google Earth. We will begin to consider why certain places are more vulnerable than others.


The dramatic examples above underscore the vulnerability* of some of the world’s major cities and many smaller communities. Each catastrophic event involved the inundation of large, densely populated areas – killing hundreds to thousands of people, flooding houses, businesses, schools, and hospitals, and crippling infrastructure. Many years are spent in recovery, during which time the media often turns its attention elsewhere.
Superstorm Sandy may have been the event that finally woke up enough people to bring to the forefront the conversation about addressing the pressing issues of the increasing level of coastal flood risks faced by major metropolitan areas around the world.
* "Vulnerability" is used loosely here. Later in the course, "vulnerability" will be used in a more specific way.
Some questions we will begin to explore in Modules 1-3 and continue to explore in later modules are:
- What are the underlying causes that make a community more or less vulnerable to these types of damaging events?
- Will disasters like Super Storm Sandy and Hurricane Katrina become more frequent?
- What can communities do to avoid future devastation and protect their residents?
- How do communities respond to more frequent flooding due to sea level rise?
Module 1 of this course will begin to explore these questions. You will use Google Earth and other sources to investigate the details of several coastal cities considered to be particularly vulnerable and begin to develop your own answers to the question posed above.
The modules that follow will introduce factors related to the geologic processes that have formed our coasts, as well as the geomorphology and ecology of coastal areas that contribute to the level of vulnerability of a location. The engineering solutions to the hazards will be considered, as will the ways societies can work to become more resilient to coastal hazards. The social science concepts of vulnerability will be explored further to provide a more complete picture of both hazards and hazard mitigation in coastal regions globally.
Goals and Objectives
Goals and ObjectivesLearning Objectives
By the end of this module, students should be able to:
- analyze real-world data on the global distribution of cities identified as most vulnerable to coastal flooding;
- consider the multiple variables that determine the ranking of these cities in the present and future; and
- use geospatial skills with Google Earth to explore and compile data for a variety of coastal communities at risk from coastal flooding.
Module 1 Roadmap
| Activity Type | Assignment |
|---|---|
| To Read | In addition to reading all of the required materials here on the course website, before you begin working through this module, please listen to/read the following required readings to build some required background knowledge on sea level rise predictions and future changes in storm intensity.
Note: Extra readings are clearly indicated throughout the module and can be pursued as your time and interest allow. |
| To Do |
Note: All submissions are made in your course management system. |
Questions?
If you have any questions, please use the Canvas email tool to contact the instructor.
Our Increasingly Urbanized Coasts and Sea Level
Our Increasingly Urbanized Coasts and Sea LevelCurrently, more than 10% of the world’s population (currently estimated at 634 million and growing) lives on land that is within 10 meters in elevation from sea level. Some of the world’s most populated regions lie within this elevation range. Another way to view this is that 75% of the world's cities are on a coast. Coastal communities in the U.S. are home to 123 million people. In many regions of the world, migration to coastal population centers is occurring at a rapid pace. These low-lying cities include London, New York, Miami, and Tokyo, as well as Mumbai in India, and the rapidly growing megalopolis of Guangzhou in China, and other large cities we may rarely think about. Numerous smaller, little-known communities are equally precariously located but come into sudden focus when a disaster strikes. Tacloban in the Philippines, which was devastated by Super Typhoon Haiyan in 2013, is a good example. Meanwhile, low-lying U.S. cities, such as Boston, Miami, and New York, all face a future that will require adaptation to more frequent flooding from the ocean.
We know that while populations have increased in coastal cities, Earth's sea level has also been rising at an increased pace. These two factors have contributed to an increased probability of inundation of coastal communities by storm surges, high tides, and other events. The measured global sea level rise has been well documented using worldwide tide gauge and satellite altimeter data. This shows that during the 20th century, the global sea level rose at an increasing rate. Between 1880 and 2011, this rate was 0.07 inches (0.18 cm) per year. Between 1993 and 2011, the rate increased to 0.11 inches (0.28 cm) per year. This represents a 64% increase (US EPA). These seemingly small increments add up: sea level has risen by approximately 5 to 8 inches (13-20 centimeters) since 1900. The latest information shows that the rate of rise continues to accelerate: NASA Global Climate Change: Sea Level Latest Data (This is a very cool data portal, and we highly recommend you look at it!)
The most recent sea level rise projections from the Intergovernmental Panel on Climate Change indicate that sea levels could continue to rise another 39 inches (approximately 1 meter) by the end of this century. This may not seem like a huge amount, but communities that are currently at an elevation close to sea level are already seeing increased flooding, and this problem will continue to get worse over the next few decades, so it is no longer just a nuisance but a major issue to be tackled. There is a great deal of uncertainty in predictions of future sea level rise, so this also must be taken into account when considering the future of our coastal cities.

These rates are global averages and, in fact, sea level change varies greatly from place to place around the globe. Above is a data plot from the tide gauge at The Battery in southern Manhattan, NY, with mean sea level in meters plotted over time from 1850 to 2010 (and average rates in millimeters rise per year).
If subsidence (sinking of the land level) is factored in, a location’s relative sea level rise can be much higher than the global average. This is illustrated by comparing the tide gauge data for The Battery with that of Grand Isle, LA. (below), where subsidence of the Mississippi River Delta sediment exacerbates sea level rise rates considerably – a difference in sea level rise of 6.47 mm/year between these two locations! We will explore these ideas further in later modules.

Sea Level Rise: The Uncertainty of Predicting Future Sea Levels
The following modules will explore in detail sea level changes in relation to coastal processes and hazards, and their impacts on coastal communities. Here in Module 1, we will touch on the topic of sea level rise. Our goal is to examine coastal cities globally and consider the hazards presented by sea level rise. You will learn about some of the controversies surrounding the prediction of future sea levels. The links we have provided will help explain how the predictions are made. The sea level rise predictions used – now given to be approximately 1 meter by the year 2100 – were made using computer modeling. The models run by different groups have provided a range of predictions, underlining the complexity of predicting future sea levels. This is an issue that is the focus of intense research. Quantifying the contribution of the melting of the polar (Greenland and Antarctic) ice sheets to sea level rise has been a source of uncertainty as scientists worked to unravel the mechanisms at work. Scientists are now more confident in determining the contribution of the water flowing from the ice sheets, but it seems that the projected sea level rise rate increases as more is understood about the fate of the ice sheets. However, current research has given coastal managers an estimate of a 1-meter rise by 2100 to use in their planning for the protection of coastal communities in this century.
Storm Frequency and Intensity
Another factor that impacts the coastal hazard risks experienced by coastal communities is storm frequency and intensity. The International Panel on Climate Change reports that predictive modeling suggests that storms could become more intense in the future. However, the frequency of storms may actually decrease. This quote from IPCC Climate Change, 2007, sums up the evidence for these predictions from modeling results:
“There is evidence from modeling studies that future tropical cyclones could become more severe, with greater wind speeds and more intense precipitation. Studies suggest that such changes may already be underway; there are indications that the average number of Category 4 and 5 hurricanes per year has increased over the past 30 years. Some modeling studies have projected a decrease in the number of tropical cyclones globally due to the increased stability of the tropical troposphere in a warmer climate, characterized by fewer weak storms and greater numbers of intense storms. A number of modeling studies have also projected a general tendency for more intense but fewer storms outside the tropics, with a tendency towards more extreme wind events and higher ocean waves in several regions in association with those deepened cyclones. Models also project a poleward shift of storm tracks in both hemispheres by several degrees of latitude”.
Introductory Activities
Introductory ActivitiesInvestigating Coastal Community Vulnerability Around the World
The following two pages include a look at coastal communities around the world and their relative vulnerability to coastal flooding, based on research. These materials are important to developing a context for the course and can also form a foundation for the Capstone Project. These pages include Learning Check Points designed to help enhance your understanding. These questions are asked for your benefit; you are encouraged to answer them, since they frequently introduce methods and applications that you will need to use again during graded assessments and in your Capstone. They are not for credit, but you need to take the time to do them, as they are often required knowledge for other assessments.
To get started on the Module 1 Learning Check Points, click the first link below or use the menu.
Learning Check Point: Summarize an Article
Learning Check Point: Summarize an ArticleRequired Reading
Take a few minutes to read Population Plus Climate: Why Coastal Cities Will Face Increased Risks From Floods: A new study names the global cities most at risk of coastal flooding - both today and in a warmer future (Time Magazine, Aug. 20, 2013). After reading the article, please answer the questions below. Note: There is no credit for this activity, but you are expected to know the material for quizzes.
Learning Check Point: Compare Cities
Learning Check Point: Compare CitiesBackground: World Bank Study – Ranking coastal cities according to the risk of coastal flooding.
In the report published in the journal Nature Climate Change in 2013, authors from the World Bank and other institutions created a ranking system for the vulnerability of coastal cities around the world. In the report, the authors “provide a quantification of present and future flood losses in the 136 largest coastal cities”. (Hallegatte et al, 2013).
The measure used for ranking is Average Annual Loss (caused by flooding). If the Gross Domestic Product (GDP), a measure of the wealth of the community, is factored in, this changes the ranking as a greater proportion of the GDP of poorer communities is likely to be affected by a flooding event. This causes poorer communities to rank higher when the GDP is included in the calculation. It is a known fact that the poor are disproportionately impacted by a catastrophic event such as a flood, as they have less capacity for recovery.
Several factors must be taken into account to calculate a city's vulnerability and to project this vulnerability into the future - see below (those cities with lower country GDP have a greater % of GDP affected by flood loss):
- the wealth of the city's country (GDP);
- relative sea level rise in the area;
- population and population growth trends;
- property values;
- flood protection measures;
- storm frequency in the area.
These factors will be studied in more detail later in the course. In this module, we will explore some of the data from the above-referenced report and take a look at the cities that rank in the top 10 of the 136 cities at risk of coastal flooding.
In Module 1 Lab, you will use Google Earth to “travel” to at least two of these cities to learn what makes them vulnerable.
Activity: Compare Cities - World Bank Study – Ranking of coastal cities' vulnerability to coastal flooding.
To prepare for the Module 1 assessments, read through "Which Coastal Cities Are at Highest Risk of Damaging Floods? New Study Crunches the Numbers" The World Bank, August 19, 2013.
| List A - City - Overall Cost (Average Annual Loss) | AAL (US$ Million) | List B - City - AAL as of % of City GDP | AAL as % of GDP |
|---|---|---|---|
| 1. Guangzhou, China | 687 | 1. Guangzhou, China | 1.32 |
| 2. Miami, USA | 672 | 2. New Orleans, USA | 1.21 |
| 3. New York, USA | 628 | 3. Guayaquil, Ecuador | .95 |
| 4. New Orleans, USA | 507 | 4. Ho Chi Min City, Vietnam | .74 |
| 5. Mumbai, India | 284 | 5. Abidjan, Ivory Coast | .72 |
| 6. Nagoya, Japan | 260 | 6. Zhanjiang, China | .50 |
| 7. Tampa, USA | 244 | 7. Mumbai, India | .47 |
| 8. Boston, USA | 237 | 8. Khulna, Bangladesh | .43 |
| 9. Shenzhen, China | 169 | 9. Palembang, Indonesia | .39 |
| 10. Osaka, Japan | 120 | 10. Shenzhen, China | .38 |
In List A, the top four cities alone (3 of which are in the US) account for 43% of the forecast total global losses. Highlighted in bold red are the cities that appear on both lists.

Please take a moment to compare lists A and B in Table 1.1 above. When you are ready, answer the questions in the Learning Checkpoint below.
Note: There is no credit for this activity, but you are expected to understand the principles (i.e., don't learn the ranking or the data) for assessments.
Learning Check Point
Module 1 Lab A: Discussion
Module 1 Lab A: DiscussionIntroductions and Exploring US Coastal Property Risk from Rising Seas Interactive ArcGIS Story Map
Overview
This discussion will allow you to introduce yourselves to each other while diving into some core content.
In this module, we have examined the global distribution of cities identified as most vulnerable to coastal flooding and considered the multiple variables that determine a community's ranking.
For the Module 1 Lab A Graded Discussion, we will spend time looking at one more source of data that can be used to look at future scenarios for U.S. coastal communities and their risk of chronic inundation in the future. You will use this tool to explore what this may mean to a couple of coastal communities and respond to a prompt on this topic in the discussion forum. You will also respond to at least one other student's responses throughout the week.
Once you read this description, return to your course management system to participate in the discussion.
Required Resources
To stimulate the discussion, please complete the following steps:
Listen to at least the first 10 minutes and 30 seconds of Got Science? Ep. 36: Coastal Homes and Properties at Risk: Sea Level Rise, Flooding, and Inundation, Podcast.
Click for a transcript of the Podcast: Got Science? Episode 36: Coastal Homes and Properties at Risk: Sea Level Rise, Flooding, and Inundation.As we’re recording today, it’s just past the first official day of summer. I happen to live year-round in a beach town here in Massachusetts—so for me, that means it’s tourist season. They’ve arrived and they’re everywhere!
Some folks come to spend the summer in my town, where they have houses that may have been handed down in their families for generations. Some folks come for a few weeks at a time and stay in a summer rental or the local hotel steps from the water. And some folks make the drive down from Boston to lie out on the beach for the day and grab a bite to eat.
So many people have fond memories of spending their long summer days in my town. I do, too, of course… since I live there by choice. And so much of our local economy depends on tourism and the revenue generated by the people who visit us and spend money at our businesses.
So I’ll be honest: I kind of didn’t want to have the conversation that follows with today’s guest, my colleague, Dr. Rachel Cleetus. It’s not that I don’t want to talk to Rachel! She’s fabulous. But she’s an economist and a sea level rise specialist here at the Union of Concerned Scientists. And her team has just released a new report on coastal real estate…and how sea level rise is a serious and unaccounted-for threat to millions of dollars worth of homes and businesses located in seaside cities and towns like mine.
Rachel is our lead economist and policy director, which means she can clearly see how rising seas can spell real financial trouble for coastal communities. She joined us to talk about the implications of this new research, what it means for towns like mine and the people who live there…and what she would do differently if she were crowned Queen of Science-Based Sea Level Rise Policy.
Colleen: Rachel, thanks for joining me on the Got Science? Podcast.
Rachel: Thank you so much for having me, Colleen.
Colleen: So you're one of the authors of a report that was recently released titled "Underwater: Rising Seas, Chronic Floods, and the Implications for U.S. Coastal Real Estate." So tell me about the analysis and who you're trying to reach.
Rachel: Well, with this analysis, what we were trying to do was look at the risk to coastal properties all along the lower 48 states of the U.S. from chronic inundation. And this is regular high tide flooding that's getting worse because of sea level rise. We're seeing high tides get higher reach further inland, and this is putting a lot of property and people in harm's way.
Colleen: And what's the time span that you're looking at?
Rachel: With this analysis, we're looking as near as 2045, within the lifetime of a 30-year mortgage issued today. And then we go out to the end of this century, looking at this risk of chronic inundation, which we define as 26 times per year or more of high-tide flooding.
Colleen: So this is not from major storms; this is happening throughout the year on a regular basis; places are flooding?
Rachel: The reality is, even in the absence of storms, this type of high-tide flooding is getting worse because of accelerating sea level rise.
Colleen: So, how did you approach the analysis? What data did you use?
Rachel: We started with data from NOAA, which basically looks at sea level rise today and projections out to 2100. We localized these sea level rise projections because in many places along the east and Gulf coast of the U.S., we're actually seeing higher and faster rates of sea level rise because of other local factors like land subsidence. And onto this data, we intersected a property dataset coming from Zillow to look at the properties at risk from high tide flooding.
Colleen: So you can actually...you're actually looking at a community and saying, by 2045, X number of houses will be underwater or really no longer in livable condition?
Rachel: By bringing together this data from NOAA on sea level rise and the property data from Zillow, we are able to tell at the zip code level how many properties, the value of properties, and the tax base those properties represent that are at risk from chronic inundation.
Colleen: So, who are you really trying to reach with this report?
Rachel: Our aim here with this research is really to inform people about what the science is telling us about this looming risk that's flying under the radar, frankly, at this point, in many parts of the U.S. coast. So we want people to be educated to make decisions about key things like the homes they own, which are often people's single biggest financial asset, based on the best available information about the kind of risk that's coming our way because of climate change and sea level rise.
Colleen: Let’s sort of zoom in on the map. What were some of the communities, cities, and areas that are going to see the biggest impact?
Rachel: Well, with this research, what we found was that there are some parts of the country, particularly in places in Florida, New Jersey, California, and New York, that are very highly exposed in terms of the number of properties and the value of that property that is at risk. That said, there are many other places where, in dollar terms, the value may not be high, but these are still people's single biggest asset. So ordinary working-class communities, low-income communities where the homes may not be super expensive, but these are people's only homes. And there are many, many of those types of communities as well in New Jersey, North Carolina, Massachusetts, Louisiana, all around the country, many communities that might see a significant portion of their housing stock at risk, as well as their local property tax base.
- Open the "US Coastal Property at Risk from Rising Seas" story map.
- Read the Introduction.
- Set the map on the By Community tab.
- Zoom out so you have a good view of the Atlantic coast. Choose a city/ community that you have some familiarity with (for example, Atlantic City, NJ) to focus on.
- Move to the Gulf Coast. Choose and city/ community to focus on (for example, St. Petersburg, FL).
- For your Atlantic Community, on the Town by Town page, start with the Homes 2045 tab. Now go to Homes 2100.
- Make notes on the number of homes at risk of chronic inundation in the chosen community in 2100 compared to 2045. Make notes on their value and how much they contribute to the local tax base.
- Repeat the steps above for a chosen community on the Gulf Coast. Make notes to compare the number of homes affected, their value, and how much they contribute to the local tax base for 2045 and 2100.
- What Factors are taken into account in this mapping tool to estimate the future scenarios for these coastal communities?
- Write a response in your course management system to the prompt below.
Discussion Prompt
Please write a short personal introduction and tell us about yourself, and what interests you about this course. Perhaps you have personal experiences from living or vacationing in a coastal city. In addition to your introduction, after listening to the podcast and exploring the interactive mapping tool, and your observations from these two sources, briefly describe what a homeowner is facing in the next 25 years in one of the two communities you chose to examine on the map (include the name of the city). How does this change in the 50 years following this period? What advice would you give to a 30-year-old person buying property in this location with a 30-year mortgage who is planning to raise a family in this community? Provide evidence from this module to back up your answer.
 Statement of Use of AI on Exams, Quizzes, and Labs
Artificial Intelligence (AI) may NOT be used to answer questions in exams, quizzes, and labs.
Instructions
- Use Word or another text editor to respond to the prompt with your thoughts backed up with evidence from Module 1. The length of your response should be between 200 and 400 words. (Typing your response in Word or another text editor and then copying/pasting from Word or similar to this discussion forum is recommended to avoid losing your work midstream in the event of an accidental browser closing, intermittent Internet connectivity, etc.)
- Go to the Module 1 Lab A (Discussion) Assignment in your course management system.
- Type or copy/paste your response to the prompt into the text box marked 'reply' and select Post Reply by 11:59 p.m. Thursday.
- Your response is now visible to your classmates and your instructor. Read through others’ responses and write a thoughtful reply to at least one other student by the date listed on the calendar. These replies should be either a rebuttal in which you add your ideas in the form of a persuasive argument (written with respect for the originating author), or a response that agrees with, supports, and builds upon the original response. Because a timely response to the conversation is part of your grade, subscribing to the forum is required. Check in to the discussion forum often throughout the week to post and respond to comments. Your responses to at least one other classmate should be posted by 11:59 p.m. Sunday to allow for authentic discussion to occur.
Grading
The grading rubric will help you understand what constitutes an appropriate level of participation on your part. The instructor reserves the right to not award any credit (including points for timing and interaction) if the content of the posts, however on-time they may be, is off-topic, offensive, or otherwise inappropriate. Such posts may be deleted at any time by the instructor as well.
| Content | Addresses all facets of the assigned discussion prompt, with accurate supporting detail where necessary. A response post is at least 200 words of substantive content addressing the prompt. Posts are appropriately cited as needed. To earn full credit in this category, your comments and reply to a classmate must demonstrate thoughtful consideration of the topic and go well beyond, "I agree with you." | 6 Points |
|---|---|---|
| Formatting and Mechanics | Posts should be edited and cited appropriately as needed. While a discussion forum has an informal tone, please refrain from foul or offensive language, texting abbreviations, etc. | 2 points |
| Timing | This assignment is deliberately structured to allow you to participate throughout the week. Your initial response to the statement should be shared by 11:59 p.m. Thursday and your response to one other classmate by 11:59 p.m. on Sunday to allow for authentic discussion to occur. | 2 points |
Module 1: Lab B (Using Google Earth)
Module 1: Lab B (Using Google Earth)Introduction
In this Lab, we present two coastal communities at risk from coastal hazards - Guangzhou, China, and New Orleans, USA. You will use Google Earth tours to explore these communities. For each place, you will spend time looking at ground level views to gain an overview of the place in terms of its elevations; proximity to tidal water; the type of topography in the area (are there higher elevation places nearby?); the presence of major river/ river delta; presence or absence of flood control structures. If you are not sure of something, make observations in Google Earth, read the profiles in the online materials, go to links to more profiles, and/or search for specific information about the topic on the Internet. You will compare and contrast the economic factors that drive society in the two communities. The goal is for you to become fully comfortable using Google Earth.
Google Earth Resources for the Module 1 Lab
The best strategy for working through this Lab is to first read over the instructions for Google Earth so you have everything set up correctly on your computer and have a good understanding of what you will need to do. Before beginning this assessment, you should have visited the Google Earth Pro Download and Tutorials page in the Orientation section, watched the Google Earth Tutorials, and downloaded Google Earth Pro. If you haven't completed these steps, please go to the Google Earth Pro Download and Tutorials page now to prepare for using Google Earth. Probably the most valuable starter resource is the Science Education Resource Center (SERC), which has an extensive tutorial document that is extremely useful.
Additional short Google Earth Tutorials are linked below. These cover basic features for review, which may help if you are just beginning to use Google Earth.
Video: How to use Google Earth for Beginners (7:20)
How to Use Google Earth for Beginners
PRESENTER: After you install Google Earth, you will be presented with this screen here, and we're going to give you a quick overview today of how to use Google Earth. First, I wanted to clarify that, when you're using Google Earth and viewing the images that are created in Google Earth, they are not live images. They're usually between one and three years old. So first, let's look at navigation. When you're looking at the Earth here, you can click and drag the Earth, and orient it in any direction you'd like. If you look over on the right-hand side, you've got a series of tools. The one on the top is putting north at the top of the screen like a normal map. You can rotate the Earth by rotating the compass. Next, you can use the Move tool down below to rotate the Earth and orient it in right-to-left, up and down. I think it's easier to click and drag the Earth whatever direction you'd like it to move. Finally, this bottom tool is to zoom in and out of the location that you're looking at. You can accomplish the same thing if you have a rotating mouse wheel on your mouse. You can scroll in or scroll out to zoom very quickly into an area. You can see, when I zoom in, that the picture starts out blurry. And then, depending on the speed of your internet connection, if you just pause for a few seconds, you will notice that the image becomes clearer and clearer.
The clarity of the image depends on the resolution of the image based on that particular area. Some areas get a real high-resolution image. Some do not. And we can look at the bottom left-hand side of this map. And it tells us that the image that we're currently looking at was taken in March of 2012. We have the exact coordinates of where we're pointing on this map right here, including the elevation of this particular point on the Earth. And then way over on the right-hand side, depending on how far you've zoomed in, you can see where you would be approximately in height. So at the moment, we're 7,000 feet above this city. The closer I zoom in to a particular point, the more blurry you may find that the image becomes. Here I'm only 2,000 feet. I get way into this little water slide. I'm only 1,400 feet above the water slide. But you can see, it gets quite blurry.
So I can zoom back out and get a clearer view of that area. Because it is a Google product, Google excels in search. So, in the upper-left-hand side of your screen, here is the Search box. So if I type in something like Empire State Building, it knows what I'm talking about. And it'll immediately take me to that point. So you can type in the names of structures. You can type in the name of a city. You can type in a full address if you know an exact address. And it will bring you directly to that spot. So use the Search engine up here in the upper left to quickly find things that you want to look for. The next thing I want to show you on the left-hand side of the screen are what are known as Layers. Layers let you overlay the map with all kinds of different information, from the roads to 3D buildings. You can put in the weather, all kinds of different things.
So I'm going to take all layers off, so you can see what it looks like without the layers. And then if I add layers-- for example, borders and labels-- then I get state, and country borders, and of course, the labels for what I'm looking at. If I click Places, now I start getting names of cities, names of geographical points like oceans, rivers, et cetera. If I click Photos, now I get all these little dots on my screen. And I can zoom in. I'll go back here to New York City. So when you click on one of these little icons, you can get a photo. And sometimes you'll see multiple photos from the same spot. So experiment with Layers. There's many different things you can do there. And it allows you to learn more about an area. One quick thing I will show you while I am in New York City is the 3D buildings. If I click 3D buildings-- not all areas have it-- but you can start to see that the buildings are starting to get a little bit of texture to them. Once you have enabled 3D, or even if you have not enabled 3D, you can use your compass up here to tilt and get a 3D look at the landscape. So I'm just hitting these little arrows here to get a 3D view of the landscape as I see it. Some other features that have been added to Google Earth are Google Sky. And that, you can get to up here from your toolbar. Click on this little Saturn. And then click Google Sky.
So you can drag it around, zoom in, zoom out, and even search, just like we did with the regular map. Also, under the little Saturn icon up here is Google Mars. And again, they're using various NASA and USGS satellite expeditions and putting in some of the imagery from those missions. And lastly, underneath the Saturn icon is the Moon. And you can explore the Moon, just like you can Earth and Mars. One last feature that I'm going to take you back to Google Earth-- that I want to show you is the ability to measure distances very quickly and easily.
So let's say you wanted a rough estimate of how far across the United States it is. You could click the Ruler up here on your toolbar. Make sure Line is selected. Choose what measurements you would like. So I'm going to choose kilometers because I'm trying to learn the metric system. Then I'm going to click on one spot, and then let go of the mouse, and then click on the final spot. And it tells me that that is approximately 4,089 kilometers. Or I can change that on the fly to miles-- 2,500 miles. Now, if you've been to a new city and you would like to measure a walk that you did-- and let's say you got left at the airport, and you had to walk up the strip from the airport. So I can click Path. After I click the Ruler, I get this little box. I can click Path. Then I can start my clicking.
We'll just start from over here by the airport. And then we'll go all the way over here to Las Vegas Boulevard. And let's say we walked up quite a few blocks. Then we walked back across here, then over to here, back to the strip. And it tells me I walked 3 and 1/2 miles. So there is a way to measure a path that you'd like to measure using Google Earth. So we touched on just a few of the basics with Google Earth today. Have a lot of fun experimenting and learning from the amazing resource that Google Earth is.
Video: Google Earth Advanced Tools 2016 Tutorial (11:32)
Google Earth Advanced Tools 2016 Tutorial
PRESENTER: This video focuses on some of the amazing things that you can do with Google Earth. In previous videos that I've made I taught the basics of using Google Earth, as well as how to use these layers, how to add them in, take them out, and some of the best layers and what they can do. So please check out that video. And then I also have another video which shows how to create your own Google Earth tours, whether they be narrated tours or not narrated. So please check out those two other videos on Google Earth. But the focus of this particular video is going to be on these tools that are across the top of the Google Earth window. So let's look at what they're for. And let's just start with the first button that's there at the top. And this is the hide or show sidebar button. It's as simple as clicking it to make the sidebar disappear and go full screen with the image or you can click it again to get the sidebar. I usually leave it like this. 99% of the time I want the sidebar there, so I just leave it as is. Let's look at the second button. We have what's called the Add Placemark button. And this, for a lot of people, is a mysterious kind of thing.
Why would I want to do this? What is it and how would I use it? And what's it for? Well, basically it's for marking places on the map-- on the earth. Key places maybe in your own history or in the history of the world-- whatever it might be. So for example, what if I would like to mark all of the birthplaces of my immediate family? I could do that by flying to the first location. My dad was born in northern Mexico. So I'll just type in the name of his birthplace, click Search. And it zoomed in on that part of the map. Now at this point, I could put a little placemark there just by clicking Add Placemark. When you click that, it puts a pin on the map and that pin is movable. I can pin it in a very specific location or in a more general location, whatever you want to do. But let's say I want to mark this exact spot. I just drop the pin there. And then I could name the pin. I can put in a description if I would like to. You can also change the style, the color of the placemark, the view, and the altitude. So some pretty neat options that you have here. Then just click OK. And now that pin is in place.
Now notice that it adds it here to My Places. There's an entry here for the pin that I've just put in. And so now, any additional placemarks that I add should be listed here, as well. All right, let's move on to the next button. This is the Polygon button. If you click Add Polygon, it lets you click and then release the mouse. Click again, click again, and you can create a polygon using really, as many points as you would like. And this is used to designate parts of the map or parts of the earth as being something. So it's like you're creating a shape that covers an area. And then you could label this. For example, I could label this Family Property. Now, this isn't really true, but I could go in and label that as being part of my family property. I could go in and choose a style and a color. Click OK, click OK. And now I have an overlay that I've created that goes over the top of this part of the map of the Earth. Similarly, you can add a path just by clicking, moving the mouse, clicking, moving the mouse, clicking. I could create a path. So you could mark a journey this way. Let's say the Lewis and Clark expedition or other explorers-- you could map out their paths that they took. Kind of a neat thing. And once again, you can choose a color and so forth for your lines. When you're done, click OK. And it's added to the map, and it's added here to your places.
You can also do image overlays. And this is a little trickier. I've had mixed luck with this, but when it works, it's pretty cool. You can give it a name if you want to. And then what you need to do is find an image. I have an image here on my desktop, and I've selected that. And it pulls in the picture and adds it to my Google Earth map. So that's pretty cool-- an image overlay. Now, because this window is open, I can move the image, put it where I want it to be. I can resize it. And that's generally true of these other things that you add, as well. As long as the window that corresponds to the item is open, you're able to move them. But look, I can't move this pin. Why? Because it's window isn't open. This picture's window is open, so I can move it by clicking on the center of it and dragging. Just click OK when you're done.
Now, if you ever want to open up the window for each of these things or for any of these things, just right-click on one of them, choose Get Info. It pops open and now you're able to move them again. All right. Cool. Next up, we have a Record a Tour button. And you should watch my other video on this topic, so please check it out. But basically, you can click that and record your voice and do some cool things to make a tour. Next up, we have Historical Imagery button. And this is pretty exciting. When you click that, it gives you a timeline here in the upper-left corner. And this timeline is often just littered with horizontal lines that you can click on to see a historical image of that area. I'm going to fly to a really populated area. How about New York-- New York City, that is. And I just click Search and it should fly me to New York City. Once I'm there, you'll see that there are some historical photos of New York. I'm going to turn off 3D buildings. There's so many 3D buildings here, if I have that turned on it might crash my Google Earth. But anyway, this is what New York City looked like in 2016. And you can see that here. It says Image-- there's the image date-- 2016. And you can zoom out and zoom in. But if I want to, I can click and drag this timeline to go back to 2014. You can see down on the bottom-- Imagery Date, 2014. Now I can go back to 2007. That's what it looked like in 2007.
I can go back further-- further. In the case of New York, they even have a picture from 1974. There we have a picture from 1974, a historical photo of New York City. So check out this timeline tool, it's pretty cool. I'm going to restore it back to the most recent imagery. And I'm going to turn off that Historical Imagery button. And instead, next, I'm going to show you the sunlight option. When you click on this-- in some ways, it's similar, but instead of going back in time and seeing a historical photo, it just changes the time of day. So if you want to picture an area in the morning, change it to 8:00 AM in the morning. Right? But if you want to get a sense of what it would look like later in the day, change it to later in the day. Now, this also works once zoomed in on an area. It gives you a better sense of why you might use this tool when you change the lighting when you're more zoomed in. To be honest with you, I don't use that one much at all. But I like that it's available. Next up, we have something pretty cool and exciting. And that is there's a button here-- it looks like Saturn. When you click on it, it lets you switch from Google Earth and go to Google Sky, which is a wonderful tool for learning about the constellations, and the planets, and other things that are out there in space. So pretty neat. Very different from the actual Google Earth. This isn't necessarily a 3D experience. But you can still search for things, like constellations, landmarks-- I don't know if they would be called landmarks out in space, but you get the idea. So that's kind of fun.
You can also switch to Google Mars, which I really like. And as a young person, I had a telescope and I loved looking up at the sky, looking at the moon, and things like that. This is just a wonderful tool for people like me who are interested in space and the planets. You can get some really nice photography-- some nice images that are as accurate as we can make them of Mars, in this case. But in addition to Mars, there's also Google Moon. So again, it's searchable. You can even find the locations of the lunar landings and the different launch sites and things like that. So there actually are quite a few landmarks on the moon, and you can search for them or discover them by browsing. Lots of fun things you can do with this part of Google Earth. For now, though, I'm going to return to Earth and show you the last few tools that we have across the top of the screen in Google Earth. One that is very useful, and I've used this several times, is the ruler tool. If you click here where it says Show Ruler, it gives you the ability, with this window popped open, to measure anything on the earth. So, for example, I could measure the continental United States from west to east. And notice that the line curves along the surface of the Earth as you move. So pretty cool. I can click and drag and it measures that distance and it tells me what it is. 2,665.8 miles. If you don't want it in miles, you can change it to yards-- you can change it to meters, kilometers, feet, inches-- whatever you want to do that's listed here-- centimeters. So a fun tool, especially for teachers and others that might need to measure or teach units of measurement and things like that.
You can also do a measurement along a path. So, for example, I could just click, click, click, keep clicking, and it's measuring along that path, a fun and useful, and educational tool that's built into Google Earth. We also have the ability to send an email of a screenshot, or the current view, or a placemark that's here at the left, or a folder full of placemarks. So that's a nice built-in email option. You can print images that you see here. You can save pictures. So I can zoom in and basically take a snapshot-- take a picture. Tell it where to save it, tell it what the name is, and click Save. And you're going to have a picture that you can use in presentations or slide shows or whatever it might be. The last button that we have here at the top is View in Google Maps. And you can see what happens-- it opens up a window and it shows the location that you're looking at in Google Maps. So I hope that this video has helped to add to your knowledge of Google Earth. These are some nice tools across the top. But there's even more that you can learn about Google Earth, so please watch my other videos, including the one on how to make your own Google Earth tours. Thanks for watching this video. And please consider subscribing to my YouTube channel for more videos about technology for teachers and students. And watch for a new video at least every Monday.
Important Google Earth skills necessary for completing the Module 1 Lab
- Getting started – downloading or starting Google Earth Pro.
- Using the direction tools in the top right of the screen to maintain the north arrow and vertical view.
- Altitude - zooming in and out to a specific eye altitude.
- Turning layers on and off and navigating “My Places” in the left-hand pane.
- Opening the KMZ file provided (note you cannot open the file by double clicking on it, go into Google Earth and under the "File" tab choose "Open") and flying to the selected places by clicking on the name of the city.
- Measuring distance: Use the ruler tool to measure distance.
- Estimating area: Use the polygon tool to measure the area of a city.
- Finding coordinates; correct format for coordinates in search.
- Observing the elevation shown at the bottom right of the screen, using the mouse.
- Using the path tool to create an elevation profile.
- Changing units to metric. Be sure to set your units to kilometers for distance measurement and meters for altitude. These units will be consistently used throughout the course.
Downloads/Resources
KMZ file (Please note, there are many cities in the file. You only need to focus on Guangzhou, China, and New Orleans, but feel free to explore the other cities!)
City Profile: Guangzhou, China*
City Profile: New Orleans, LA*
*Profiles are also available on the next two pages.
Statement of Use of AI on Exams, Quizzes, and Labs
Artificial Intelligence (AI) may NOT be used to answer questions in exams, quizzes, and labs.
Instructions
Before you begin the Lab, you will need to download the Lab worksheet and Google Earth file. In addition, you will need to read the two City Profiles mentioned above. We advise you to either print or download/save the Lab worksheet, as it contains the steps you need to take to complete the Lab in Google Earth. In addition, it contains prompts for measurements and questions that you should take note of (by writing down or typing in) as you work through the Lab.
Once you have worked through all of the steps and completed the measurements, you will go to the Module 1 Lab B (Quiz) in your course management system to complete the Lab by answering multiple-choice questions. The answers to questions on this Lab worksheet will match the choices in the multiple-choice questions. Complete the Module 1 Lab B (Quiz) for credit.
City Profile: Guangzhou, China
City Profile: Guangzhou, ChinaBackground Information
The city of Guangzhou ranks as number 1 on both of the lists of vulnerable coastal cities of the world (World Bank), while Shenzhen ranks number 9 on List A and number 10 on List B. What makes these two cities, which are relatively close to each other geographically, rank so high on these two lists?
This discussion will include the region in southern China known as the Pearl River Delta, or PRD, which is within Guangdong Province, of which Guangzhou is the capital. Guangzhou (formerly known as Canton) is one of several cities that have merged to form a megacity. More detailed information on the economy of this rapidly growing region may be found in this Fact sheet about Guangdong Province:

The third-largest city in China, Guangzhou, is the capital of Guangdong Province and has a population of approximately 15 million people. Guangzhou is actually part of a megalopolis formed by the coalescence of several cities. To the south of Guangzhou is Shenzhen, which itself ranks 9 on List A and 10 on List B. South of Shenzhen is Hong Kong. The region of mainland China to the north of Hong Kong is considered one of the more progressive parts of China. In recent years, it has seen rapid economic and population growth.
The population of the city of Guangzhou is estimated to be a little over 14 million, presenting many issues for city leaders. The rapid growth has occurred mainly because of the influx to the city by people from rural areas. 15 million has been deemed Guangzhou’s maximum capacity, so city leaders are considering ways to control population growth, while at the same time planning for the relaxation of the one child per family rule imposed by the Chinese government.
This densely populated city sprawls across the Pearl River Delta, a low-lying coastal plain formed by the Pearl River and its distributaries as they enter the South China Sea. The low elevation of much of the most densely populated areas is significant to the overall vulnerability of the people living here to inundation in the event of a tropical cyclone and as a result of sea level rise.
Shenzhen, to the south, is part of the “Special Economic Zones” formed as part of the reform and opening-up policy in China. Shenzhen sits close to Hong Kong, and here people move freely between mainland China and Hong Kong.
Hong Kong is today considered a “Special Administrative Region” of the People’s Republic of China. China resumed sovereignty from Britain over Hong Kong in 1997. Because of its turbulent political history, Hong Kong is a cosmopolitan region with a large population of non-Chinese residents, setting it apart from its mainland neighbors. It is a mountainous coastal region with an area of a little over 1,000 km and a population of 7 million, most of whom live on the low-lying coastal fringe. This makes Hong Kong one of the most densely populated areas in the world. This densely populated fringe of land is highly vulnerable to inundation.
City Profile: New Orleans, Louisiana, USA
City Profile: New Orleans, Louisiana, USABackground Information
New Orleans was established more than 300 years ago on the banks of the lower Mississippi River for strategic and commercial reasons. The northern perimeter of this port city is the south shore of Lake Pontchartrain, a 629-square-mile bay open to the Gulf of Mexico. The city is surrounded, on all sides, by water and wetlands. Its growth to the currently occupied area was facilitated by draining the low-lying swamps and marshes between the Mississippi River and Lake Pontchartrain. Stormwater must be pumped out of the city with every rainstorm. The city’s relationship with water is currently defined by its complete enclosure within flood protection levees. The older levees protect the city from Mississippi River floods, while newer levees protect the city from inundation by hurricane storm surges from the Gulf of Mexico. The drainage and dewatering of the delta sediment on which New Orleans sits have caused compaction and subsidence so that the elevation of many areas of New Orleans is now below sea level.
The hurricane protection levee system (see image below) failed in 2005 when Hurricane Katrina’s storm surge breached it in many places. This resulted in the flooding of 80% of the city, filling the shallow bowl of low-lying land with salty water.
The population of New Orleans before Hurricane Katrina was 454,865. The 2012 census estimates the population to be 369,250, or 76% of the 2000 population (nola.com). Therefore, New Orleans is a smaller city than before Katrina in terms of the number of residents. The demographic and other changes in New Orleans since Hurricane Katrina are complex. Although parts of the city remain relatively unrecovered since the storm, other areas have made great improvements economically and in other ways (see the article from the Times-Picayune linked below).
Of the four coastal cities featured here, New Orleans is the only U.S. city, and it is the only one of the cities to weather a recent major disaster related to coastal hazards. It has received billions of dollars in recovery funds and undergone a major rebuilding of its flood defenses since 2005. These important factors should be taken into account as you analyze the coastal cities on the list and their vulnerability to coastal hazards. Another important consideration is the fact that the massive hurricane protection system of levees, flood walls, and gates, or the Hurricane and Storm Damage Risk Reduction System (HSDRRS), which was breached in Hurricane Katrina in 2005, has been repaired and received significant upgrades to the tune of $14 billion. If the World Bank study, completed in 2005, were repeated in 2015, New Orleans may have received a lower ranking, in spite of its location.


Summary and Final Tasks
Summary and Final TasksThis module has introduced some broad ideas about the distribution of communities around the world that are experiencing increased vulnerability to coastal hazards due to their proximity to tidal waters and various other geomorphic and societal factors. The module directed you to explore data compiled by the World Bank and other agencies that rank the vulnerability of coastal cities using many variables, including economic measures. You have gained experience in using Google Earth, a powerful free online tool that enables us to investigate places in terms of their physical (elevation, proximity to water, geographic location, etc.), and societal characteristics, including the economy. These tools have enabled you to make comparisons among cities across the globe and to reach your own conclusions about how these characteristics affect the vulnerability ranking. This module is designed to be a jumping-off point for the course and to lead into a more detailed look at coastal hazards and society.
Reminder - Complete all of the Module 1 tasks!
You have reached the end of Module 1! Double-check the Module 1 Roadmap (in Goals and Objectives) to make sure you have completed all of the activities listed there before you begin Module 2.
References and Further Reading
Hallegatte, Stephane, Colin Green, Robert J. Nicholls, and Jan Corfee-Morlot; Future flood losses in major coastal cities. Nature: Climate Change: LETTERS: PUBLISHED ONLINE: 18 AUGUST 2013 |, DOI: 10.1038/NCLIMATE1979.
Nature Climate Change: Supplementary Information - Future flood losses in major coastal cities.
Tatyana Deryugina, Laura Kawano, and Steven Levitt, The Economic Impact of Hurricane Katrina on Its Victims: Evidence from Individual Tax Returns.
Capstone Project: Directions and Requirements
Capstone Project: Directions and RequirementsThis course examines the processes that shape the coastal zone, produce coastal hazards, mitigate those hazards through engineering, impact coastal societies and economies, and influence public policy and planning to reduce vulnerabilities and risks. The capstone project is an opportunity for you to assemble and integrate this wide array of processes – and to apply modern Earth Science principles of systems thinking – into a single project.
You will investigate the coastal processes, hazards and policy of a world city that is threatened by storms, tsunami and/or sea level rise.
Your finished product will be a presentation-quality PowerPoint created using the Coastal City Slide template. This presentation will encapsulate the key concepts learned in the course relative to one coastal city. You will gather and record details about your city and submit these details as assignments when prompted at certain stages in the course.
Directions and Requirements
The CVAT
To complete your Capstone, you will first work to complete the Coastal Vulnerability Audit Tool (CVAT) PowerPoint, using the template provided, in stages throughout the semester. The CVAT serves as an outline to help you develop your capstone project. As you will see, each section of the CVAT is organized hierarchically to follow the course material. You will compile notes about your coastal city on topics indicated in the CVAT PowerPoint and submit the four stages of the CVAT PowerPoint. You may use AI for research, but you may not copy and paste directly out of AI into the CVAT (see summary of AI use below).
Coastal City Slides
You will assemble most of the Coastal City Slides including a map, relevant illustrations, graphs, and other data as you work on the CVAT during the semester. You will get feedback on them when you submit CVAT Stages 2-5. At Stage 6 you will transfer these slides to the City Slide Presentation PowerPoint and place them in the indicated locations. To these you will need to add Summary slides for each of Stages 2-4. Finally, you will need to write a script for a narration and record it in as an MP4 video using ScreenPal. Your 10-15 minute presentation should be suitable for presenting to an audience, conveying the most important concepts. More detail is provided below. You may not use AI for the City Slides under any circumstances (see below).
Overview of the Capstone Project Stages
Stage 1
In Module 1, you will download two PowerPoint files. The first is the Coastal Vulnerability Audit Tool (CVAT) Audit. The second is the Capstone Coastal City Slides. In Module 1, you will be given a list of approved coastal cities to select from, and you will submit your top choices in Module 2. You will then be assigned one city as the focus of your project for the semester.
Stages 2-4
Throughout the semester, you will complete the Coastal Vulnerability Audit Tool (CVAT) PowerPoint for your city. At each stage, you will record information and submit it to the instructor for grading including a check of AI use. You will also submit relevant slides for the City Slide Presentation for feedback (not grading). You cannot use AI for the City Slides under any circumstances (see below). Make sure you include references for your information sources as you go along. This will save you time at Stage 5.
Stage 2
You will record information on the Physical Systems to be turned in during Module 8. The instructor will grade your CVAT and provide feedback on completeness of your City Slides.
Stage 3
You will record information on the Human and Engineering Systems, to be turned in during Module 11. The instructor will grade your CVAT and provide feedback on completeness of your City Slides.
Stage 4
You will record information on the Vulnerability, Planning, and Action; Resiliency Policy, Planning, and Actions during Module 13. The instructor will grade your CVAT and provide feedback on completeness of your City Slides.
Stage 5
You will also record information on the Site-Specific Concerns and Considerations; Recommended Resiliency Action Plans; and References and Key Resources during Module 13. The instructor will grade these entries.
Stage 6
During Stage 6, you will transfer the relevant City Slide figures from your CVAT to the City Slide PowerPoint. You will add summaries for each of the stages. Then you will write and record a narration for the entire presentation to tell the story of your city using information collected in your CVAT and your collated city slides. This narrated presentation will summarize and illustrate the physical, human, and engineering aspects of your city, highlight aspects of its coastal vulnerability, and review the policies and actions taking place to address these vulnerabilities. Your final presentation will also include your site-specific concerns for your city and provide recommendations for increasing coastal resilience. You will record the presentation as an MP4 file using ScreenPal, a free recording program (www.screenpal.com). You will submit the narrated Coastal City Slides as well as the MP4 file. You do not need to submit the CVAT at this stage.
Detailed Outline of your City Slide Presentation for Stage 6
The completed City Slide presentation should contain:
- Your Coastal City Slides PowerPoint downloaded from Canvas in Stage 1 includes the different required elements consisting of approximately 12-18 slides collected during Stages 2-5 as well as a few others outlined below
- You will follow these minimal guidelines to complete your presentation (see template):
- A title slide.
- A map annotated with text and symbols in PowerPoint, and conveying the most important points about the city (assembled in Stage 4).
- At least twelve (12) figures on 12 separate slides (photos, graphics, graphs of data) that help the viewer understand the details about your chosen city collected during Stages 2-4. Include captions for all figures and reference the source of the image. Figures should include graphs or other kinds of data, as well as photos.
- Summary pages (3) with bullet points summarizing the most important takeaway messages you want to get across about your city.
- One (1) page outlining your site-specific concerns (from CVAT).
- One (1) page outlining your Recommended Resiliency Actions for your city (from CVAT).
- A list of references for all sources used in your research, written in citation format (from CVAT).
- An audio narration for each slide, in MP4 format (recorded with ScreenPal). Be concise and keep each slide to 30-60 seconds. Plan and write out your narration. Read it rather than ad-lib.
Use of AI

We allow you to use AI for the CVAT but not the City Slides. For the CVAT, you can use AI for research, but you cannot under any circumstances copy out of AI directly into the CVAT. You must rewrite everything in your own words. We can and will check all entries with a ChatGPT checker, which detects AI-generated text with 96% accuracy. There is no credit given for grammar, so please write everything from scratch and do not use Grammarly, as these can trip the AI checkers. Any direct copying will result in a ZERO for the assignment. You must cite all references that AI gives you.
You cannot use AI for the City Slides under any circumstances. You can search for images using Google Images or any other search engine. Copying images or presentations out of AI is easily detected and you will receive a strict penalty if we determine you have used AI for this part of your Capstone project.
Please note again that AI is not allowed in any other part of this course, as we discussed in the Academic Integrity part of the Orientation. Please let us know if you have any questions.
Module 2: Coastal Landscapes
Module 2: Coastal LandscapesIntroduction
What is the coastline or shoreline? What is a coast or coastal zone?
For most of you, the terms coast or shore likely bring to mind visions of things such as vacations, waves, wind, sand, sailboats, coastal birds, and, perhaps, very bad cases of sunburn. Regardless of your first thoughts and whether you have ever been to a coast, if you were asked to define it, you would probably recognize that a coast is a location where the solid dry surface of Earth interfaces with the open-ocean environment. It is reasonable to think of the intersection of the water line with the firm ground as a coastline, but, in this entire course, we will be focusing on the intersection of the open marine/salty water/ocean/sea environment as the coastal zone. As you learned in Module 1, our global society is intrinsically linked to the coasts of the world and, for this reason, there is a wide range of interest in developing a sound scientific understanding of the form of coastal zones and the processes that cause them to change or evolve through time.
Throughout this course, you will hear or see the term coast or coastal zone. This is where an explicit definition becomes a bit more fuzzy and difficult to provide. Most scientists who conduct research within coastal zones would probably agree that the coastal zone, or coast, can be defined as a part of the land that is affected by processes of the open ocean, such as tides or salty ocean water. It includes the land above as well as below the water in these types of locations. On a global basis, coastal zones are highly varied, and a single coastal zone may consist of numerous coastal sub-environments such as marshes and estuaries, or may consist of a single type of environment, such as a sandy beach at the base of some very high cliffs (the images below show some very iconic coastal zones). Consequently, they may be highly varied in their width, ranging between perhaps only a few hundred meters or as much as several hundred kilometers.
Regardless of the scale of the coastal zone, each coastal zone of the planet is characterized by a unique set of physical, chemical, and biological processes. Physical processes include things such as the daily movement of water and sand grains because of tides or waves. Chemical processes include the formation of small grains of the mineral calcium carbonate as it precipitates out of seawater. Biological processes include things such as the growth of plants in coastal marshes or the formation of small reefs in estuaries by organisms such as oysters. Collectively, all of the physical, chemical, and biological processes of a coastal zone interact to affect how a specific coastal zone looks, the ecosystems that are present there, the natural resources that are present, how it changes through time, and how we as humans interact with the coastal environments.
Finally, because of the diverse range of physical, chemical, and biological processes that exist in coastal zones, a solid scientific understanding of coastal zones requires a very holistic scientific approach with input from oceanographers, geologists, biologists, chemists, and engineers. In this unit, we will take a close look at how we classify coastal zones and the overall morphology and environments of coastal zones.
Classification of Coastal Zones
As humans, we love to be able to categorize things and create nice little compartments or classifications for the natural world around us. For example, think of how we have taken the animal kingdom and created a classification scheme that separates birds from mammals or invertebrates from reptiles on the basis of the differences between these organisms. Classification, regardless of what we are classifying, provides a way for us to organize things and then ultimately compare and contrast the differences between different parts of the natural world so that we can best understand how and why it developed.
During the last century, there have been numerous classification schemes proposed for coastal zones. Each one has had some good and bad ideas embedded in it, but one of the more recent and useful classification schemes of coastal zones relies upon understanding the concept of plate tectonics.
Goals and Objectives
Goals and ObjectivesGoals
- Students will gain an understanding of how plate tectonics plays a first-order control on the characteristics of a coast and how other processes, such as glaciation, climate, sediment supply, waves, and tides, also influence the characteristics of a coast.
- Students will develop an appreciation for the geomorphological diversity of coastal zones.
- Students will gain an understanding of the differences between emergent and submergent coasts, depositional and erosional coasts, as well as how the hydrodynamic regime exerts a strong control on the geomorphology of the coast.
Learning Objectives
By the end of this module, students should be able to:
- examine and show, using Google Earth, the global diversity of coastal zones;
- identify the plate tectonic setting of a coastal zone based on geographic location relative to major tectonic boundaries;
- identify and be able to describe the second-order processes that can act on coastal zones;
- integrate knowledge of coastal geomorphology and understanding of coastal processes to identify the types of processes that create specific coastal geomorphologies; and
- evaluate the history of a coast based on the coastal geomorphology.
Module 2 Roadmap
| Activity Type | Assignment |
|---|---|
| To Read | In addition to reading all of the required materials, before you begin working through this module, please read the following required article to make sure you are familiar with the content, so you can complete the assignments.
Extra readings are clearly noted throughout the module and can be pursued as your time and interest allow. |
| To Do |
Note: All submissions are made in your course management system. |
Questions?
If you have any questions, please use the Canvas email tool to contact the instructor.
Getting Down to Business: Plate Tectonics
Getting Down to Business: Plate TectonicsWhat is a collisional margin? What is a passive margin?
We know from a wide range of different studies that the Earth is not a completely solid sphere but instead consists of a series of different layers ranging in composition, which dictate the way they react when forces are applied to them. The outermost layers are very different with regard to composition and density from the innermost layers of the Earth. A generalized segregation of the Earth recognizes these three primary units: crust, mantle, and core.
Earth Structure
Earth StructureCrust
At the scale of the whole Earth, the crust is a relatively thin, solid outermost layer that ranges in thickness. The thickest part of the crust exists in areas with mountain ranges and may be as much as 100 km thick in some locations, but generally, the crust is between approximately 30 and 35 km thick. Below the oceans, the crust is much thinner, averaging about 5 km. Two fundamental types of crust are recognized: Continental Crust, which is below continental landmasses, and Oceanic Crust, which is below the oceans.


Mantle
Below the crust is a much thicker layer called the mantle. Because of a higher abundance of dense minerals, the mantle is much denser than the crust. At shallow levels just below the crust, the mantle is rigid; whereas at deeper levels, although the mantle is still solid, it can flow slowly like taffy or putty. Because the rigid part of the upper mantle behaves mechanically like the overlying crust, the two are lumped together and referred to as the Lithosphere. It is the lithosphere of the planet that breaks by fracturing, and it is the lithosphere that is broken into a series of tectonic plates. These plates can move very slowly across the hotter and partially molten underlying material that deforms by flowing and is referred to as the asthenosphere. It is the flow of the very hot asthenosphere that helps to deform and drive the motion of the overlying lithospheric plates.
Core
From a depth of approximately 2,000 km to the center of the Earth at a depth of 6,378 km is the very dense and very hot metallic core.
Plate Tectonics
Plate Tectonics
Plate Tectonics
Take a look at the global base map that shows and identifies with labels, the different tectonic plates of the Earth. You will notice that the margins of the plates are very irregular and that the boundaries of the plates fit together, similar to a jigsaw puzzle. If you look very closely, you will also see that the margins of the plates are sometimes located on the edge of the continents, and sometimes the margins are located in the middle of the oceans. As previously mentioned, these plates are not static, but instead, move at very slow rates, averaging just a few centimeters per year. In the course of very long intervals of time, such as 100,000 years, these very slow rates of motion can add up to hundreds of meters or kilometers of total motion.
The result of these rigid plates moving around is the creation of one of three different types of plate boundaries: divergent, convergent, and transform boundaries.
Divergent Boundaries
This is a boundary between two plates that are moving apart from one another. For example, if you look at the global base map again, you will see a plate boundary that extends through the middle of the Atlantic Ocean. This is a divergent boundary where the North and South American Plates are moving away from the African and Eurasian Plates. At this location, new oceanic crust is forming (see Illustration of three types of tectonic boundaries) as underlying mantle material flows up through the gap created by the separation of the plates. It is referred to as the Mid-Atlantic Ridge because along this margin, the oceanic crust is elevated and creates a ridge. Because the edges of the continents on opposite sides of the divergent boundary are considered tectonically inactive, they are called passive continental margins. Divergent boundaries can also extend across continental crust, such as where the Arabian Plate is moving away from the African Plate and in the process creating the Red Sea Rift.
Convergent Boundaries
Convergent boundaries are those where plates are colliding with one another, forming either a subduction zone or a continental collision. There are two types of convergent boundaries: continental-oceanic and continent-continent.
Continental-Oceanic Boundaries: In the case of a continental-oceanic crust collision, the denser oceanic plate will fold or subduct underneath the less dense continental plate. For example, take another look at the global map of the tectonic plates, and you will notice that there is a boundary along the entire length of the western edge of South America. This is a margin where the Nazca Plate is in direct contact with the South American Plate. Earthquakes, volcanoes, and mountains are often associated with convergent margins (see Illustration below of the three types of tectonic boundaries), and all three of these occur along the western edge of South America.
Continent-Continent Boundaries: A continent-continent collision, or orogeny, occurs when two continental plates collide, fold, fault, and uplift, creating mountain ranges. The Himalaya Mountains are actively building as a result of the compressional forces put upon the Indo-Australian Plate and the Eurasian Plate, pushing against each other during the last 30 to 50 million years.
Transform Boundaries: Transform boundaries exist where plates are sliding past, or more scientifically stated, shearing past one another. The San Andreas Fault of southern California is one of the most recognized transform boundaries where the Pacific Plate interacts with the North American Plate. During the approximately 30 million years that the San Andreas boundary has been active, there have been approximately 550 kilometers of movement.

A final thing to keep in mind is that plate tectonic interactions generate stresses that can lead to the development of fractures in the lithosphere. If the movement of the lithosphere takes place across these fractures, they are called faults. Three main types of faults are recognized: 1) normal faults, 2) reverse faults, and 3) transform faults. You probably have realized that transform faults, like transform boundaries, are those where opposing sides of the fault slide past one another. In the case of a normal fault, part of the lithosphere slides down past the lithosphere of the opposing side, whereas in the case of a reverse fault, part of the lithosphere moves over the top of the lithosphere on the opposing side of the fault. Understanding faults and faulting will become important later on, in Module 6, when the creation of tsunamis is covered.
For more information on plate tectonics, check out these U.S. Geological Survey (USGS) resources.
- USGS Historical Perspective: useful information about the history of thought regarding plate tectonics
- USGS Developing the Theory: information regarding how the modern theory of plate tectonics was developed
- USGS Understanding Plate Motions: additional information regarding the types and characteristics of different plate boundaries and how different plates interact with one another
Learning Check Point
Learning Check PointPlease take a moment to think about what you have learned in this section, then answer the question below to test your knowledge.
There is no credit for this activity, but at this point, you should be able to explain/discuss the differences between the layers of the Earth and the different types of boundaries that exist between the plates.
Coastal Zones: The Margins of Continents
Coastal Zones: The Margins of ContinentsWhat are continental margins, and what is the morphology of continental margins?
Continental Margins
Before we get too far along in a discussion of plate tectonics and coastal zones, we need to address the characteristics and form of continental margins because this is where the coastal zones that we will be referring to are located. As indicated by the name, continental margins are the edges of the continents and transition into the deep-water environments of the ocean basins. In general, continental margins have several distinct physiographic subenvironments, including the continental shelf, continental slope, and continental rise (see cross-sectional profile).
Continental Shelf
The continental shelf of a continental margin includes the seafloor that extends from the subaerial part of the continent, or shoreline, seaward to what is known as the shelf break. Continental shelves are typically relatively gently sloping surfaces, but a change in the gradient, or slope, of the continental shelf takes place at what is referred to as the shelf break. There is a wide range of widths and gradients for continental shelves (see global map), but the global average water depth for where the shelf break is located is between 120 to 130 m. The global average width for continental shelves is approximately 75 km, and the average slope of the continental shelves is on the order of 6 to 8 degrees. One fundamental characteristic of continental shelves is that they can represent areas of extensive deposition because of their proximity to continental river systems that supply sediment to the continental margins. In fact, in some places, the continental shelf may be underlain by as much as 10 to 15 km of sediment, representing tens of millions of years of deposition above the granitic crust that forms the foundation of continental margins. On a global basis, the sediment at the surface of the continental shelves can derive from many different sources. Depending upon the location of the continental shelf and the characteristics of the adjacent continent, the sediment can be sourced from river systems, glaciers, and ice sheets, or can be calcium carbonate sediment sourced from organisms that produce shells of calcium carbonate.


Continental Slope
The continental shelves of the world transition into the continental slopes at the shelf break, where a distinct change in the gradient or slope of the seafloor exists. This change in gradient is coincident with a reduction in crustal thickness and a granitic to basaltic change in the composition of the underlying crust. Continental slopes are narrower than continental shelves, with a global average of only 20 km. They extend from the shelf break at approximately 120 m to as deep as 3,000 m with approximately a 4-degree gradient, but may be as high as 20 degrees. Overall, slopes also vary according to the nearby plate tectonic boundary, where slopes are steepest in locations adjacent to geologically young plate tectonic margins with narrow continental shelves. Deposition on continental slopes is predominantly finer-grained than the sediment that is deposited on continental shelves because there is less moving water from waves and tides to carry large sediment particles. One exception, however, is that during past periods of low sea level, when rivers extended across continental shelves to meet the low sea level shoreline, relatively larger sedimentary particles were transported to continental slopes by river systems. As a result of the past low sea levels, some continental slopes contain buried deposits with large sedimentary particles such as coarse sand and gravel. One unique feature about the outer parts of the continental shelves and continental slopes is that they may be the sites of submarine canyons through which sediment and water can be carried out to deeper parts of the ocean basin. Through the years, there has been much speculation as to how these canyons form, but most scientists agree that their origin is a result of erosion by oceanic currents, gravitational forces that cause failures and incision, or are the remnants of river valleys formed during past lowered sea level.
Continental Rise
The continental rises are the most distal parts of the continental margins and represent the transition from the slope to the deeper, flat physiographic regions of the open ocean basins known as abyssal plains. Wedges of sediment that can be several kilometers thick and several hundred kilometers wide developed because of the seaward transport of sediment from the more shallow water continental shelves and slopes. Overall, the gradients of the continental rises are typically less than 1 degree.
For more information on continental margin physiography and morphology, see the following resource.
Learning Check Point
Learning Check PointTake a few minutes to think about what you just learned, then answer the question below to test your knowledge.
There is no credit for this activity, but at this point, you should be able to explain the structure of continental margins and the fundamental differences that exist along a transect from land to the open ocean.
Back to Coastal Zones: Plate Tectonics and Coastal Classification
Back to Coastal Zones: Plate Tectonics and Coastal ClassificationWhat are the characteristics of coastal zones along collision coasts and trailing margins?
The tectonic setting and tectonic history of a continental margin are probably the most important factors that control the character of a continental shelf and coast. You can think of the tectonic setting as a first-order control on the morphology of a coastal zone. There are other factors that certainly are important, such as sediment supply, but we will get to those in later sections.
A very useful and widely recognized classification scheme of a coastal zone is the tectonic coastal classification developed by two scientists. In 1971, Inman and Nordstrom published a scientific paper that linked different types of coastal zones to tectonic characteristics. They suggested that the most important factors in determining the coastal characteristics were:
- location of the coast with respect to plate boundaries;
- tectonic setting of the coastline on the opposite side of the continent;
- time; and
- exposure of the coast to open ocean conditions.
Collision Coasts
Collision coasts face a plate boundary. They occur at the point of subduction zones, on the edge of a plate. These are tectonically active coasts, with frequent earthquakes and volcanic activity. Features found on and near collision coasts include mountains of more than 3,000 meters; deep trenches offshore, into which sediment falls when it reaches the coast. Here, the continental shelf is narrow, and there are few depositional features to be found. The rivers that drain to collision coasts are relatively small, and there are few of them.
Examples of collision coasts are the west coasts of North and South America.
Trailing Edge Coasts
Trailing edge coasts face a spreading center where new material is added to the oceanic plates (e.g., mid-Atlantic spreading center). Trailing edge coasts are near the middle of a tectonic plate and far from the plate boundary. The characteristics all trailing-edge coasts have in common are a lack of tectonic activity (no earthquakes or volcanism). There are three types of trailing-edge coasts:
Amero-trailing edge coasts
Amero-trailing edge coasts occur in the middle of a tectonic plate and face a spreading center. The coast on the opposite side of the continent is a collision coast. Characteristics of Amero-trailing edge coasts include NO tectonic activity, a wide continental shelf, and a wide, low coastal plain. There is abundant sediment deposition and, therefore, numerous depositional features. These features include marshes, barrier islands, spits, mangroves, and deltas. Examples of Amero-trailing edge coasts are the east coast of North America, the east coast of South America, and India.
Afro-trailing edge coasts
The distinguishing characteristics of Afro-trailing edge coasts are: they face a major spreading center, AND the opposite coast also faces a spreading center. The entire continent is located within a plate. They also have no tectonic activity. The continental shelf can vary in width from wide to narrow. The coast itself can feature cliffs, hills, and low mountains, and coastal plains. Sections of an Afro-trailing edge coast can have many depositional features, while other sections have very little sediment deposition, so they are highly variable. Examples of Afro-trailing edge coasts are the east and west coasts of Africa, the coast of Greenland, and parts of coastal Australia.
Neo-trailing edge coast
This type of coast faces relatively young plate tectonic spreading centers, which means that there has not been enough time for them to develop. There may be some volcanism, and they may be seismically active with rugged, young topography adjacent to them. The continental shelf is very narrow here. There is very little deposition taking place on these coasts, as few rivers enter the ocean. A few pocket beaches form, but no other depositional features. They are backed by cliffs, hills, and low mountains. Examples include the Gulf of California, where Baja rifted from mainland Mexico about 20 million years ago (relatively recent in geologic time).
Marginal Sea Coasts
Coasts of this character occur along continental coasts facing an island arc. They are sheltered from the conditions of the open ocean by other landmasses, such as island arcs, which were created by the collision of tectonic plates. They feature wide continental shelves and are backed by hilly or low-lying regions. There is no tectonic activity on these coasts. There is a high sediment influx from rivers, resulting in depositional features such as deltas. Examples of marginal sea coasts include the coasts of mainland China on the South China Sea, the East China Sea, the Sea of Japan, and the Yellow Sea. The Caribbean islands form an island arc that protects the coasts of mainland Central and South America on the Caribbean Sea.
Learning Check Point
Learning Check PointPlease take a few minutes to think about what you just learned then answer the questions below to test your knowledge.
There is no credit for this activity, but you should now be able to explain the different types of coastal zones as a function of plate tectonic settings and understand how different tectonic settings influence the type of coastal zone characteristics that may be present.
A Few Notes on Other Types of Coastal Classifications
A Few Notes on Other Types of Coastal Classifications- What is an emergent coast?
- How does an emergent coast differ from a submergent coast?
- What is an erosional coast, and how is it different from a depositional coast?
As mentioned at the beginning of this module, there have been a number of coastal classification schemes proposed throughout the time of coastal scientific inquiry. There is not enough room in this module to discuss all of these in detail, but here are a few more as food for thought and discussions that will come later in this course.
Emergent and Submergent Coasts
Emergent and Submergent CoastsThe elevation of sea level has not always been constant. It varies locally daily because of the phenomenon of tides, but has also changed across much longer periods. For example, about 18,000 years ago, when large ice sheets were present on the planet during a period of cooler climate, sea level was approximately 120 meters lower than it is today because a large volume of ocean water was frozen in ice sheets at that time. In this case, sea level was below the current sea level elevation because of actual volumetric changes to the amount of water stored in the ocean basin.
There are, however, other ways to change the apparent elevation of sea level along a coast. Consider, for example, keeping the global sea level steady along an active plate tectonic margin where the coast is being uplifted. Because the land surface is being uplifted, there is an apparent fall in sea level elevation, even though the total volume of water in the ocean basins has not changed. When we can observe evidence of a change in sea level elevation, whether it be an increase or a decrease in elevation, we call it a relative sea level change because we may not necessarily know what mechanism contributed to the observed change. You will learn a lot more about changes in sea level later in this course, but, for now, keep in mind that many lines of geologic evidence exist for a long history of relative sea level changes. This leads us to recognize two different types of coasts on the basis of whether they have experienced a relative sea level fall or a relative sea level rise.
Emergent Coasts
Emergent coasts are a result of local tectonic uplift of the land surface or a fall in the elevation of sea level because of a reduction in the water volume of ocean basins. Quite often, emergent coasts have rocky coastlines with cliffs and nearly flat platforms that extend inland, where older coastal plains have been tectonically raised and are now elevated above the modern land and water interface. A very good example of an emergent coastline, because of its proximity to an active plate tectonic margin, is the west coast of North America. Parts of the Scandinavian coastline (Sweden and Norway) are also emergent, where the land surface has been rebounding upward due to the removal of the weight of glacial ice that formed during the last Ice Age but has since melted. The images below show typical emergent coastlines.


Submergent Coasts
Submergent Coasts are those that have been flooded by ocean waters because of a relative rise in the elevation of sea level at that location. The rise in sea level can be either the result of an increase in the volume of water in the ocean basins or the result of the land surface sinking, both of which create an apparent rise in the elevation of sea level. A common feature of submergent coastal zones is river valleys or glacially-carved valleys that have been flooded by ocean water. The Chesapeake Bay of the eastern United States is a classic example of a river valley that extended to the edge of the continental shelf during the last Ice Age, when ocean waters were stored in the ice sheets. As the ice age ended, ice sheets melted, and sea level rose; the river valley was flooded with marine waters to create the Chesapeake Bay. The images below show the Chesapeake Bay as well as the spectacular Sydney Harbor, also formed in a drowned river valley.
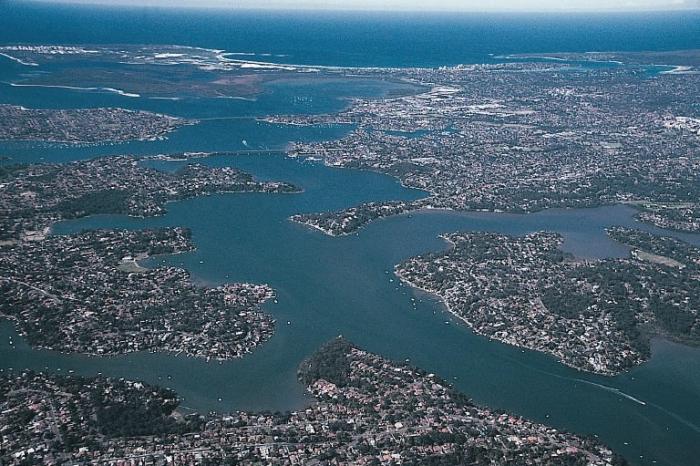

Erosional and Depositional Coasts
Erosional and Depositional CoastsAnother approach to coastal classification is to consider whether coastal processes in the coastal zone are primarily contributing sediment to the coastline or whether they are removing sediment from the coastline. The former of these is recognized as deposition, whereas the latter is known as erosion. Where erosion is the dominant process, the coastline is retreating landward, and where deposition is dominant, the coastline is advancing seaward.
Erosional Coasts
In places where there is an abundance of wave energy or ocean currents and/or a lack of sediment available for deposition, erosion of the coast will be the dominant mechanism of change. Quite often, erosional coasts are narrow and characterized by resilient rocky shorelines that are exposed to high-energy waves and supply relatively little sediment to the adjacent shore. This is the case for much of the western U.S., where there are numerous rocky exposures and vertical sea cliffs (see images from the Oregon and Washington coasts below). Often, but not necessarily always, erosional coasts are associated with coastal zones along active plate margins where there is a steady uplift of the landform, and few well-developed drainage basins and river systems have developed to deliver large quantities of sediment to the coast.


Depositional Coasts
Depositional coasts are characterized by abundant sediment supply that results in the net deposition of sediment and the creation of new coastal landforms despite the energy of the waves and ocean currents. There is a wide variety of landforms along depositional coasts, such as extensive beaches, barrier islands, and expansive coastal wetlands and mudflats (see typical depositional coasts in the images below). They are most common along mature, tectonically inactive continental margins where ample geologic time has passed for large drainage basins and rivers to develop, which can provide large quantities of sediment that can be distributed by waves and tides at the coastline.


Learning Check Point
Learning Check PointPlease take a moment to think about what you have learned in this section, then answer the question below.
There is no credit for this activity, but at this point, you should be able to discuss the characteristics of glaciated coasts, the role of climate in the biological activity and weathering of coasts, as well as the types of storms that can impact coasts.
Second Order Influence on Coastal Zones
Second Order Influence on Coastal ZonesBased on the information discussed in the last several sections, it should now be evident to you that plate tectonics has a strong influence on the characteristics of continental margins and the associated coastal zones. There are, however, several other key secondary influences that also affect how coastal zones evolve. These include:
- sediment supply,
- glaciations (direct and indirect),
- climate,
- hydrographic regime.
Each of these will be discussed individually in the following sections to provide a comprehensive framework of the types of processes that need to be considered when attempting to evaluate coastal characteristics and evolution.
Sediment Supply
Sediment SupplyHow is sediment supply related to the tectonic setting of a coastal zone?
The availability and transport of sediment, loose non-cohesive material, within the coastal zone strongly affect the morphology of the coastal zone. Additionally, it turns out that sediment supply to a coastal region is very closely linked to the tectonic setting of the coastal zone.
To understand this better, let us take a look at Afro-Trailing and Amero-Trailing Edge Coasts. Along Afro-Trailing Edge Coasts, relatively little sediment is delivered to the coast when compared to the amount of sediment that is deposited along the Amero-Trailing Edge Coasts. Recall that a characteristic of Amero-Trailing Edge Coasts is large mountain systems inland of the coastal zone and on the opposite side of the continent. These uplifted mountain systems provide a ready source of sediment that can be transported by river systems to the tectonically inactive Amero-Trailing edge of the continent. The opposite side of the continent from an Afro-Trailing Edge coast, however, also has a trailing edge and no substantial uplifted mountainous areas that can supply sediment. The east coast of North America is a somewhat special case because it was once a collision coast, and, therefore, it is drawing sediments from the Appalachian Mountains, which were formed during a geologically much older tectonic collision between North America and North Africa.
To put this in context, examine the drainage basin of the Amazon River on the maps below. The Amazon basin extends all the way from the western collisional margin of South America, where the Andes Mountains are located, to the trailing passive margin of the east coast of South America. The Andes Mountains are geologically young and are the result of tectonic uplift associated with subduction. Because of their elevation and size, they provide a large amount of sediment to the Amazon drainage basin that can be carried by the Amazon River to the Atlantic Ocean. Alternatively, the Niger River on the west coast of Africa has its headwaters in low-lying (compared to the Andes mountains), very old rocks that provide little loose sediment to the river. As a result, the Niger River carries approximately two orders of magnitude less sediment to the ocean than does the Amazon River (Table 2.1).

| Type | River | Sediment Discharge |
|---|---|---|
| Amero-Type | Amazon River | 2000 x 106 tons yr |
| Afro-Type | Niger River | 20 x 106 tons yr |
Glaciations
GlaciationsWhat are the direct and indirect effects of glaciations on coastal zones?
Glaciated Coasts
The effects of glacial activity along coastal zones can be broadly broken into two categories. Direct effects would include the shaping of coastal zones in high latitude areas toward the north and south poles of the planet, where glacial ice is in direct contact with the land surface. Indirect effects would include low-latitude areas toward the Equator, where glacial ice is not a permanent feature in coastal zones.
Direct Effects on Coasts by Glaciation
The New England states of the northeastern United States are a good example of where glacial ice has had a direct and obvious impact on the coastal morphology, specifically along the coast of the state of Massachusetts and around the city of Boston. Between approximately 100,000 and 18,000 years ago, a large percentage of the North American continent was covered by a several-kilometer-thick sheet of ice that progressively advanced southward during this time. As this massive ice sheet advanced, it scoured and scraped the underlying ground. The scoured sediment was transported as the ice sheet advanced into progressively lower latitudes. Sediment was also carried by meltwater streams that flowed out in front of the ice sheet. The result is that glaciers and ice sheets such as this can move substantial amounts of sediment and act to create a unique suite of glacial landforms, such as terminal moraines and outwash deposits. It is these types of deposits that formed the surface sediments of famous New England places such as Cape Cod, Martha’s Vineyard, and Nantucket.

Another type of direct effect that ice sheets and glaciers can have along the coast does not involve the deposition of sediment, but rather the erosion of sediment and the creation of features such as valleys. On a global basis, the modern-day fjords were created during the most recent global glacial event that led to the advance and growth of ice sheets and mountain glaciers everywhere. It was during this period that the ice carved out what would later become known as fjords. 18,000 years ago, ice sheets and glaciers were melting worldwide, and this extra water in the ocean basins has led to a rise in sea level and flooding of the glacially carved valleys. Famous fjords of places such as Alaska, Chile, and Norway are the direct result of glaciers once extending to the sea from high areas, carving very long and often deep but generally narrow valleys.


Indirect Effects on Coasts by Glaciation
The indirect effects of glaciations are considered to be associated with the lowering of sea level during the last Ice Age and the subsequent rise of sea level that coincided with the melting of the ice-age ice sheets and glaciers. During the period of major ice sheet and glacial expansion, sea level was approximately 120 meters lower than it is today. During this period of lowered sea level, river systems on a global extent would have extended across the continental shelves, which were subaerially exposed because of the lowered sea level. River valleys cut across the continental shelves as rivers flowed to reach the new elevation of sea level. The valleys were progressively widened and deepened, and during deglaciation melt, meltwater was released back into the ocean basins and sea level progressively rose so that the river valleys became inundated. This indirect process of glacial and ice sheet influence on the coastal zone is evident in the Chesapeake Bay of the eastern United States. The Chesapeake Bay, as well as many other drowned river valleys, provide critical habitat for freshwater, brackish, and marine water species of plants and animals, but are becoming a progressively more endangered habitat because of the influx of agricultural nutrients through runoff and discharge of wastewater into these environments.

For more information on glaciers and ice sheets, check out these links:
Climate
ClimateThe climate of a particular coastal area plays a significant role with regard to the biological activity, weathering, and severity of storms that can impact the coast. Read on to learn about the way these factors influence coastlines.
Biological Activity
Biological ActivityWarm, low-latitude climates encourage the growth of lush vegetation in comparison to relatively colder, high-latitude climates. For example, in warm coastal climates, thick, extensive platforms of mangrove forests or salt-tolerant grasses can develop if the substrate is suitable for the development of good root zones, and the plants are not exposed to high-energy waves or tidal conditions that can uproot them. Although a wide range of coastal plant species exists even within high-latitude coasts, the species that occupy warm climates will tend to be more organically productive with longer growing seasons.

Along coasts where vegetation is highly productive, this vegetation can constitute a significant contributor to the coastal sediment budget. When plants of the coastal zone die, the fragments of the plant, also known as organic detritus, can accumulate and help incrementally add elevation to the land surface. In some coastal areas, this process of accumulating organic debris derived from the plants has been suggested to be a major contributor to the health of coastal marshes and their ability to maintain a suitable elevation above sea level as sea level rises.
Vegetation plays another important role along some coasts because extensive root systems help to stabilize environments such as coastal marshes and dunes, and can reduce the amount of wave and wind erosion that can take place. The presence of extensive coastal plant communities can also help reduce the destructive power of storm surges and tsunamis to inland areas and coastal infrastructure because the plants act to buffer the energy of these phenomena to the more inland areas.
Some coasts are also fringed by coral reefs. The most extensive reefs are located in warm ocean waters because corals are temperature-dependent, with optimal growth of most coral reefs taking place in low-latitude climates where ocean waters are warm. Corals produce their hard structure out of the mineral calcium carbonate, as do shelled organisms such as clams, oysters, and snails. All of these organisms can be broken apart or fragmented by marine currents and ultimately contribute sediment to a coast. In some areas of the world, the beaches consist wholly of broken coral and shells.

Weathering
WeatheringWeathering is a term that is used to describe the breakdown of solid rock into particles of sediment, such as boulders, sand, silt, and mud, as well as ions that are dissolved in water. Two types of weathering processes are recognized: physical weathering and chemical weathering. Physical weathering refers specifically to the reduction of the volume of rock and or individual particles of sediment into progressively smaller and smaller sedimentary particles through mechanical processes. These mechanical processes include fracturing and disintegration by freezing and thawing, transport by glaciers, or even rolling along a shoreline by waves. Chemical weathering, on the other hand, refers to the chemical breakdown of minerals in rocks and the production of new minerals from the dissolved ions. Most chemical reactions proceed fastest when temperatures are elevated and also when water is abundant. In warm, wet climates, chemical weathering proceeds fastest, so one would expect that the same rock would chemically weather much faster in a tropical rain forest rather than on an arctic tundra. It is also important to note that because of the nature of chemical reactions in warm, humid climates, there is a more significant production of very fine sediment.
Recommended reading for weathering
- Wikipedia article: Weathering: This article gives an explanation of chemical weathering.
- Watch an informative video on chemical weathering.
Video: Chemical Weathering-Hommocks Earth Science Department (4:04)
Chemical Weathering-Hommocks Earth Science Department
Storms
StormsLarge storms in coastal settings typically produce strong winds that can create larger-than-normal waves. Increased wave heights, and thus the energy associated with the waves, can very quickly change the overall morphology of coastal environments that are exposed to the storm. Even relatively smaller-scale storms, such as thunderstorms, can, with strong enough winds, create substantial changes to a beach or other environments within the coastal zone if they occur with a high frequency during the course of several days or weeks.
Wind can also modify coastal environments. For example, strong winds steadily blowing across a fine-grained beach and dune system for several days can lead to the transport of some of that sand from the beach and dunes and its deposition elsewhere. As a result, environments exposed to strong winds during the course of several days can be reduced in elevation through a process known as deflation.
There is a wide range of scales when it comes to discussing storms. Although capable of inducing change, it is not the random small-scale thunderstorm or even weeks of continuous thunderstorms that cause the most modification to coasts. The most powerful storms to potentially impact a coast are tropical cyclones. We will introduce these systems in the following, but also explore them in more depth in Modules 5 and 6.
Tropical Cyclones
Tropical cyclones are low-pressure rotating weather systems that are created in the atmosphere by the transfer of heat from the ocean basins to the atmosphere. These low latitude systems (23.5 N and S of the equator) spin clockwise in the Southern Hemisphere and counterclockwise in the Northern Hemisphere, and are referred to by different names depending on the ocean basin. In the Atlantic Ocean, they are known as tropical storms and hurricanes when the wind speed exceeds 119 km/hr (75 miles/hr), whereas, in the western Pacific Ocean, they are referred to as tropical cyclones and typhoons, respectively. In both cases, tropical cyclones can generate very large, high waves that have the potential to devastate the natural environments of a coastal zone and any human infrastructure that is present where the storms make landfall. Another critically important component to understand about tropical cyclones is the storm surges, or elevated levels of sea level, that occur as these low-pressure systems move through an ocean basin. Very large storm surges can be created depending upon the morphology of the coast, the gradient and width of the neighboring continental shelf, the strength of the storm, and the rate of forward motion of the storm. For example, a storm surge over 7 m (25 feet) was created along parts of the northern Gulf of Mexico shore by Hurricane Katrina in 2005 and resulted in inland flooding several kilometers from the non-storm-surge shoreline. We will explore these systems in detail in Modules 5 and 6.
Extratropical Storms and Fronts
North of the Tropic of Cancer (23.5 N latitude) and south of the Tropic of Capricorn (23.5 S latitude), extratropical storms and weather fronts dominate as the major storm impact on coastal zones in these regions. Although not capable of packing the full magnitude of punch that a hurricane can produce, some storms outside of the tropics can produce wind speeds equivalent to those of weak hurricanes, resulting in very large waves and storm surges along coastal environments.
Northeasters
Along the east coast of North America, the classic example of an extratropical storm system is the Northeaster, which is a storm that tracks from the Midwest of the United States northeast along the east coast of the United States and into Maritime Canada before being turned eastward into the northern Atlantic basin. The term Northeaster derives from the fact that the winds of these storms are from the northeast within this irregularly shaped but counterclockwise rotating storm system. They occur between late fall through spring when cold arctic air moving southeast comes in contact with warmer air moving north from more southerly latitudes to create a low-pressure system with a cold center (in contrast to a hurricane with a warm center). Although not as strong as hurricanes, northeasters are larger in diameter and can impact three to four times as much shoreline as a very large hurricane. Further, their frequency of occurrence is higher for the east coast of North America, with 20 to 40 annually, although only several of these generate severe offshore wave heights greater than 5 meters (16 feet).
Recommended reading for Northeasters
- Wikipedia article: Nor'easter formation: This article provides details of Nor'easter formation.
- USGS article on Northeasters: This article provides a brief description of northeasters.
Fronts
Numerous other types of weather systems can affect coastal zones. The most common along the northern Gulf of Mexico is what is known as a front. A front is a zone between two air masses with different temperatures, different levels of humidity, and densities. In the winter, low-humidity cold air systems sweep southward across North America and encounter more humid, warmer air over the Gulf of Mexico. A strong southerly flow (winds blowing from south to north) persists along the northern Gulf in the days before the arrival of the cold front. These sustained winds blow as much as 30 to 50 km/hr and can generate large waves in the Gulf of Mexico that then travel northward and impact the shore, leading to erosion, deposition, and overall modification of the pre-frontal morphology. As the front passes, the wind direction shifts to blowing from the north, bringing much colder and drier air. These north winds can similarly reach sustained speeds over 30 km/hr, persisting for a couple of days. Because these winds are from the north, they can generate large waves in the bays on the north side of the shorelines and be very effective at eroding the marsh and other features on the north-facing shorelines of barrier islands and marsh platforms.
Hydrographic Regime
Hydrographic Regime- What does it mean to discuss the hydrographic regime of a coastal zone?
- What variability exists in the range of tides and the amount of wave energy for different coastal zones?
Hydrographic Regime is a term that is used to describe the relative influence that waves and tides have along coasts, particularly coasts where the deposition of sediment is more dominant than erosion and removal of sediment. This is because waves and tidal currents are responsible for the movement of sediment along depositional coasts and, ultimately, the relative magnitude of these parameters dictates the type of coastal morphology that will develop. In a discussion of the hydrographic regime, there are two primary things to consider: waves and tides. The following sections provide a brief background on each of these phenomena.
Waves
WavesA full description of waves is beyond the objectives of this course, but very rigorous and sometimes complex theories and mathematical models have been developed to explain waves in water. It also turns out that no singular theory or mathematical model adequately describes the full range of waves and wave behavior within water bodies. An equation that perhaps quite adequately describes wave behavior in deep water might be completely useless when attempting to quantify the behavior of shallow-water waves. Because waves are the most common energy source along most coastal zones, understanding them is paramount to understanding how coasts evolve through time.
Fundamentally, a wave can be considered to be a disturbance of the water as energy is passing through the water. In open ocean basins, wind is the source of this energy that is transferred to the body of water as the wind blows across it. Consider what happens when you blow on the surface of a cup of hot tea or coffee to cool it down, the energy of your moving breath is transferred to the surface of the tea or coffee and causes small ripples or waves to develop.
The characteristics of waves are geometrically described by several different parameters including the: 1) wave height or amplitude, 2) wave length, and 3) wave period. As the name implies, the wave height is the vertical distance between the trough of a wave and the top or crest of a wave. Wave length refers to the horizontal distance between successive wave crests or troughs, and the wave period refers to the number of waves that pass a set point within an established period of time (Fig. 2.27).
Overall, the height, length, and period of a wave fundamentally are governed by 1) wind speed, 2) the duration of time that the wind has been blowing, and 3) the fetch or distance across open water that the wind has traveled. Wave height and the steepness of the wave increase through time as the amount of energy transferred from the wind to the water increases. For example, an increase in wind speed will cause more energy to be imparted to the water, and the result is that the wave heights correspondingly increase. A wind-generated wave can however not grow indefinitely in the open ocean; at some point, waves will grow so large that they break, and this is how whitecaps are generated.
Waves have the ability to travel great distances in the open ocean, and some studies have been able to track waves more than 10,000 km in the open ocean after many days of traveling. Importantly, one should keep in mind that the water of the waves does not actually travel with the wave but rather the waveform itself does. Fundamental to this fact is the process of circular orbital motion, wherein the energy of the wave is passed along as individual water particles move in a circle below the water surface. These circles of travel, or orbitals, are stacked on top of one another with the largest orbital diameter at the top and the smallest orbital diameter at the bottom. The diameter of the orbitals becomes negligible at a water depth that is equal to half of the wavelength, and this water depth is known as the wave base of the wave. In water depths that are less than half the wavelength, the orbitals become deformed and progressively evolve from being perfectly circular to elliptical. The speed of the wave decreases towards the coast but other waves moving in behind are still traveling at a speed that was equal to the first wave's speed before it began to slow down. All of the waves, therefore, begin to get crowded together and the height and the steepness of the waves increase. Eventually, the waves become unstable because they are too high relative to the water depth, the front of the wave collapses and the wave breaks onto the coastline to create surf (Fig. 2.28). The energy of the traveling wave is then transferred onto the shoreline either carrying sediment up onto a coastal environment such as a beach or removing sediment and transporting it offshore or alongshore.


Longshore Currents
Very rarely do wave trains approach a shoreline aligned perfectly parallel to the trend of the shoreline. It is much more common for wave trains to arrive at an angle to the trend of the shoreline. The net result of waves breaking at an angle to shoreline is to produce a weak current known as a longshore current (LSC). This current flows parallel to the shoreline. Some of you may perhaps recall swimming in the ocean when the waves were relatively large, and where you entered the water was not where you got out of the water. The reason for this is that the longshore current moved you slowly down the beach. This same wave-induced current, in conjunction with sand being suspended by breaking waves, is responsible for moving sand along the beach (Fig. 2.29). For this reason, beaches have sometimes been referred to as rivers of sand, because there is constant sediment transport as a result of longshore currents. The movement of sand parallel to the trend of the shore results in the development of features you will learn about in the next module such as spits; it can also increase the length of barrier islands and the buildup of sand next to coastal structures such as groins and jetties that you will learn about in Module 8.

Tides
TidesPeople have been fascinated with tides throughout history, with various aboriginal legends dating back tens of thousands of years accounting for this phenomenon. One Native American legend tells of a raven who wanted to alter the depth of the oceans to make it shallower and therefore make more food accessible for his people, while Australian Aborigines have legends that speak of the moon filling with water while it was waxing, and how water drained back out of the moon as it waned, demonstrating the understanding that the lunar cycle was associated with water levels of the ocean.
Our current understanding of the tides can be explained using Sir Isaac Newton’s universal law of gravitation. He proved that the gravitational attraction between two bodies is directly proportional to mass and inversely proportional to the square of the distance between them. This is the case with the relationship between the sun, the moon, and the Earth. While the moon is relatively small, it is also relatively close to Earth and exerts a gravitational pull on the Earth’s surface that is stronger than that of the sun, which is much larger but also much further away. It is this gravitational attraction of both the moon and the sun to the Earth that causes the periodic rising and falling of the ocean’s surface that we call tides.
Tidal “Bulge”
The gravitational attraction between the moon and the Earth causes the water in the oceans, which is fluid and mobile, to be pulled towards the moon. This creates a “bulge” in the ocean that is closest to the moon and as the Earth rotates, the location of the waters that are affected, change. Picture the moon as a magnet that draws the water towards it. This movement of water towards the moon is counteracted by the force of inertia, the force that tends to cause a moving object to continue moving in a straight line. This is what balances out the movement of our oceans, but because the gravitational pull is stronger, the resultant force causes our tides. The sun also has this effect, but due to the vast distance from Earth, plays a smaller role.
Spring and Neap Tides
We sometimes hear on the news during a coastal storm that the effects on the shoreline will be more severe due to especially high tides. This is due to the position of the moon and the sun in relation to the Earth and the resulting gravitational attraction at various stages in the lunar cycle.
When the moon is in a position relative to the Earth where it is pulling in a direction that is in the same axis as the sun (new and full moon), both bodies are exerting a force on the Earth that is cumulative. This is called conjunction, and because these forces are both working to pull the Earth’s surface in the same directional axis, we experience higher high tides and lower low tides than we see throughout the month at a given location. This is the period during the lunar cycle that we experience spring tides.

When the moon is in a position that is at right angles to the sun, the gravitational pull of the two bodies is working in opposing directions on the Earth’s surface. This is when the gravitational forces of the sun and the moon are working against each other and we experience moderate changes in water levels. We refer to this period in the lunar cycle as neap tides that occur during quarter moons.

The difference during spring and neap tides is evident in the tide graphs for a tidal gauge in Halifax Harbour shown for Spring tide and Neap tide. This tide gauge is measuring water levels at the same location. However, during a spring tide the high water is almost 6.5 ft while during the neap tide, the high water is approximately 4.8 ft. The low tide during the spring tide is 0.2 ft and during the neap tide is 1.5 ft. The highs and lows during the full or new moon are much more pronounced than they are during the quarter moons. That is why a storm event paired with a spring tide may cause more serious damage along a coastline than a storm event paired with a neap tide.
Tidal Graphs
Tidal Cycles
A tidal cycle is one high tide plus a successive low tide. Due to land masses, the movement of water moving around on the Earth's surface due to tides is impeded. The resulting tidal cycle or pattern, therefore, depends on geographic location. There are three basic types of tidal cycles that are globally distributed.
Semi-diurnal Tides
This is the most common tidal pattern, featuring two highs and two lows each day, with minimal variation in the height of successive high or low waters, and is very common along much of the east coast of North America.
Diurnal Tides
There is only a single high and a single low during each tidal day; successive high and low waters do not vary by a great deal. Such tides occur, for example, in the Gulf of Mexico, the Java Sea, and in the Tonkin Gulf.
Mixed Tides
These are characterized by wide variation in heights of successive high and low waters, and by longer tide cycles than those of the semidiurnal cycle. Such tides occur, for example, along the U.S. Pacific coast and many Pacific islands.

Plots showing the variation in tidal curves for diurnal, semidiurnal, and mixed semidiurnal tidal cycles during a tidal period and tidal day.
Semidiurnal Tide
Tidal period: Time between high tide peak (lower) to high tide peak (higher) or low tide trough (lower) to low tide trough (higher).
Tidal day: Time between higher high tide peak to higher high tide peak.
Mixed Tide
Tidal period: time going through the peak of lower high water, higher low water, and the peak higher high water.
Tidal day: From the peak of higher high water, to lower low water to lower high water to higher low water back to the peak of higher high water.
Diurnal tide
Tidal period = tidal day: between the peaks of high tide

Summary of Waves and Tides
Summary of Waves and TidesIn summary, waves and tides can have a profound influence on the morphology and evolution of a coast. In areas with large waves and thus high wave energy, sediments can be extensively reworked by the erosive energy of the waves and widely distributed by the process of longshore transport. In high-energy coastal areas with strong tidal currents, large volumes of sediment can be transported or reworked by the tidal currents to create deposits that are aligned perpendicular to the coastline but parallel to the flow direction of rising and falling tides. In coastal areas that have large tidal ranges or are low gradient, some parts of the shoreline may be exposed for several hours each day before the next rise in tide, and extensive mudflats can develop for very large horizontal distances.
For more information on tides and waves:
- Why does the ocean have waves?
- Wikipedia website with a discussion of tidal range
- Wikipedia website with a discussion of longshore transport
Video: Longshore Transport (2:19) (Video is not narrated.)
Wave, Mixed Energy, and Tide Dominated Hydrographic Regimes
Wave, Mixed Energy, and Tide Dominated Hydrographic RegimesOur understanding of waves and tides now sets the stage for a more thorough understanding of how they interact to shape a coastal zone. In the context of the hydrographic regime, there are two fundamental things that must be considered: the wave and tidal energy of a coast.
- Wave energy (E) is a function of wave height (H) with the energy (E) of a wave approximately equal to the square of the wave height (H2).
- Tidal energy can be equated with tidal range because it is the rise and fall of the tides that produce tidal currents. Tidal range (TR) is the vertical difference between high and low tides, which are commonly categorized into three ranges:
Microtidal: TR < 2.0 m
Mesotidal: 2.0 m < TR < 4.0 m
Macrotidal: TR > 4.0 m
The relative dominance of wave versus tidal energy dictates coastal morphology, and three general regimes exist along depositional coasts:
- Wave Dominated Coasts
- Mixed Energy Coasts
- Tide-dominated Coasts
Wave Dominated Coasts
Along wave-dominated coasts, the role of the waves and, thus, longshore transport processes is the dominant factor controlling the coastal morphology. Because longshore transport carries sediment along the shore, these types of coasts tend to have long linear barrier islands and beaches with relatively few inlets or passes between the open ocean and the more interior bays and waterways. The reason for this is that the longshore transported sediment tends to fill in these inlets and passes. Since the tidal currents are relatively weak, there is no energy available to keep the inlets open as a connection between the open ocean and interior waterways.

Mixed Energy Coasts
Mixed energy coasts are a product of both wave and tidal processes and neither process exerts an excessive influence on the coastal morphology, although some mixed energy coasts show tidal or wave dominance. Rarely in nature are processes in equilibrium. These types of coasts typically contain short stubby barrier islands, have numerous tidal inlets and passes, and are separated from a mainland by extensive marshes and an array of tidal creeks.


Tide Dominated Coasts
Tide dominated coasts are those where strong tidal currents act to redistribute sediment along the vector of falling and rising tidal currents, which are orientated perpendicular to the trend of the coastline. Quite often, the highest energy tidal currents develop in locations where large tidal ranges are present in conjunction with a shoreline morphology that accentuates tidal flow by constricting tidal currents into funnel-shaped embayments. Sediment is reworked by the resulting tidal currents to create subaerial and subaqueous tidal shoals and islands that are aligned parallel to the tidal flow direction, perpendicular to the coastline. Moreover, in areas with very large tidal ranges, extensive tidal flats, and marsh or mangrove systems form along the borders of the embayment and can cover large areas.


Learning Check Point
Learning Check PointPlease take a few minutes to think about what you just learned, then answer the question below.
There is no credit for this activity, but this point, you should know that the relative energy of tides and waves along a coast strongly affects how sediment is transported and the morphology of the coast. You should be able to explain how you think different coastal zones look in the context of the relative strength of tides or waves.
Module 2 Lab
Module 2 LabIn this brief lab, you will record a Google Earth tour of two of the classifications of coastlines described in this module: choose either emergent or submergent for the first, and choose erosional or depositional for the other. So your submission will include two files (see below for more details).
Statement of Use of AI on Exams, Quizzes, and Labs
Artificial Intelligence (AI) may NOT be used to answer questions in exams, quizzes, and labs.
Instructions
- Read the material on emergent and submergent coastlines in the module and choose a location that exemplifies one of these types of coastlines from one or two of the following worldwide locations:
Emergent:
Any of the example locations labeled as emergent on the Emergent and Submergent Coasts page of the Module 2 course material, plus locations on the west coast of the U.S., focusing on the states of Oregon and Washington, and Scotland.
Submergent:
Any of the example locations labeled as submergent on the Emergent and Submergent Coasts page of the Module 2 course material, and other locations on the eastern coast of the U.S., focusing on the states of Maryland, Virginia, and North Carolina; the Gulf Coast of the U.S.; and Southern China.
Erosional:
Any of the example locations labeled as erosional on the Erosional and Depositional Coasts page of the Module 2 course material, plus other locations on the west coast of the U.S., Southwestern United Kingdom (England), and southern Australia.
Depositional:
Any of the example locations labeled as depositional on the Erosional and Depositional Coasts page of the Module 2 course material, plus other locations on the east coast of the U.S. and the Gulf Coast of the U.S.
Be sure the location you choose for your tour has obvious features and landforms that are evidence of the classification you are highlighting. - To prepare for your tour, open Google Earth Pro. Cruise around that location at about 25- to 30-mile elevation, then zoom in close to about a mile (~5,300 feet or 1.6 km). Zoom in further to see greater detail (~500 ft. or 150 meters). Note the morphological features you see that make the coast fit into that classification. Examples: Do you see cliffs or a low-profile shore? Do you see a wide or narrow beach?
- Next, write a brief 100-word script to describe the morphological features (landforms you see) that are evidence of your chosen coastline fitting into that category. Base your description on the information found in the class material, using terminology learned in the reading and other sources. The script can be informal; it will help you remember what to say when you begin recording. Be concise and limit your recording to 2 minutes or less.
- Next, use ScreenPal to record your tour. The tool is free and easy to use.
- Follow the instructions to 1. record, 2. save, and 3. email the MP4 file to yourself. Once you receive the emailed file, reopen it and play it in Google Earth Pro to make sure it works. Then, make a screen recording using Screenpal to add the audio narration to your tour.
- Repeat steps 1-4 for the material on erosional or depositional coastlines, choosing to describe either an erosional or a depositional coastline example.
- The finished product for this assignment will include two screen recordings (MP4 files) that you will submit to the Module 2 Lab (File Uploads). Name the files you upload with the type of coastline you are describing and the location (e.g., “submergent-Grand Isle.mp4).
- NOTE: Submissions are made in your course management system.
Summary and Final Tasks
Summary and Final TasksThroughout this unit, you have been introduced to the global diversity of coastal landscapes. You have learned about the role of plate tectonics in coastal classification as well as other approaches to coastal zone classification such as recognizing whether a coast is emergent or submergent and depositional or erosional. Finally, you have been introduced to an array of other processes that operate in coastal zones and that exert an influence on the overall morphology of the coast, including climate, sediment supply, glaciation, and the relative role of waves and tides. This unit sets the stage for Unit III, which will provide an overview of very specific types of coastal sub-environments such as rocky coasts, sandy beaches, coral reefs, barrier island shorelines, and marshes and mangroves.
Reminder - Complete all of the Module 2 tasks!
You have reached the end of Module 2! Double-check the Module 2 Roadmap (in Goals and Objectives) to make sure you have completed all of the activities listed there before you begin Module 3.
Capstone Project: Stage 1 Instructions
Capstone Project: Stage 1 InstructionsCity Selection
- Review the Capstone Project Overview to familiarize yourself with the overall project. You will only be working on Stage 1 right now.
- Download two PowerPoint templates: CVAT Coastal City Audit and the Capstone Coastal City Slides, in Canvas Module 1. Read these over so that you gain a better understanding of what you are working towards.
Choose 3 cities from the following list that you would like to focus on for the rest of the semester (you will be assigned one of them). Include at least TWO U.S. Cities and at least ONE city from another country in your selections, and rank them first, second, and third choice.
City Selection US World Astoria, Oregon Accra, Ghana, West Africa Alexandria, Egypt Baltimore, Maryland Amsterdam, the Netherlands Auckland, New Zealand Boston, Massachusetts Bangkok, Thailand Calcutta (Kolkata), India Charleston, South Carolina Cairns, Australia Cancun, Mexico Honolulu, Oahu, Hawaii Dhaka, Bangladesh Dubai, United Arab Emirates Houston and Galveston, Texas Guangzhou, China Hanoi, Vietnam Key West, Florida Ho Chi Minh City (Saigon), Vietnam Istanbul, Turkey Miami and Miami Beach, Florida Jakarta, Indonesia Lagos, Nigeria New Orleans, Louisiana London, England Manila, Philippines New York, New York Melbourne, Australia Mumbai, India Norfolk, Virginia Osaka, Japan Port au Prince, Haiti Seattle, Washington Santo Domingo, Dominican Republic Sendai, Japan Tampa - St. Petersburg, Florida Shanghai, China Suva, Fiji Virginia Beach, Virginia Sydney, Australia Tacloban, Philippines No data Tokyo, Japan Vancouver, British Columbia, Canada No data Venice, Italy Victoria, British Columbia, Canada No data Wellington, New Zealand No data
- Submit your choices by the due date to Capstone Project Stage 1 (City Selection) in Canvas.
- So that we have a range of cities represented by the class, you will be assigned your first choice if you are the first or second person to propose it. If two people propose it before you, you will get your second or third choice. The goal is for no city to be represented by more than three people. If we have too many people choosing one city, I may have to ask some people to choose again.
- I will post the list of cities against everyone’s name in the assignment comment box by the end of Module 3.
Module 3: Coastal Systems: Landscapes and Processes
Module 3: Coastal Systems: Landscapes and ProcessesIntroduction
What types of sub environments exist across various coastal zones?
In Module 2, you were introduced to the variety of coastal landscapes that exist on a global basis and developed an understanding of how large-scale plate tectonics exert an influence on the characteristics of coastal zones. You also learned that an array of other factors, such as sediment supply, climate, and hydrographic regime, strongly affect how an individual coastal zone develops and evolves. In this module, the focus will be on developing an understanding of the many different types of specific coastal environments that can be present within a coastal zone, as well as the different types of processes that are active in these environments.
Goals and Objectives
Goals and Objectives- Students will build upon the material of Module 2 and be able to recognize that there are discrete, unique coastal systems such as rocky coasts, coral coasts, deltas, barrier islands, and marshlands within regional-scale coastal zones.
- Students will develop an understanding of what processes are operative within the range of coastal systems and how these processes shape the coastal systems.
- Students will appreciate that coastal systems evolve differently in response to fair-weather conditions or storm conditions.
Learning Objectives
By the end of this module, students should be able to:
- identify and describe the different types of coastal systems that exist;
- explain the morphological differences between these types of coastal systems.
Module 3 Roadmap
| Activity Type | Assignment |
|---|---|
| In addition to reading all of the required materials here on the course website, before you begin working through this module, please read the following required readings to make sure you are familiar with the content, so you can complete the assignments. Extra readings are clearly noted throughout the module and can be pursued as your time and interest allow. |
| To Do |
|
Questions?
If you have any questions, please use the Canvas email tool to contact the instructor.
Environments of Coastal Zones
Environments of Coastal ZonesIn what sort of tectonic setting would you expect rocky coasts most often? What is the role of different rock types in how erosion may take place along an uplifted, high wave energy rocky environment?
Rocky Coasts
Some estimates suggest that nearly 75% of the world’s shorelines are considered rocky coasts, meaning that the shoreline consists of erosionally resistant cohesive bedrock or sediment that has been recently cemented together to form a cohesive unit. Most often, rocky coasts are in areas of high wave energy and are erosional, with only localized areas where sediment might accumulate, such as small beaches between rocky headlands. They exist across a wide range of geologic settings, including very mountainous regions, areas that have been or are covered with glacial ice, or along volcanoes that are located in the open oceans. Although rocky coastlines may be present on passive, trailing tectonic margins, they are most frequently located along collisional tectonic margins.


Tectonics, Sediment Supply, and Morphologies Along Rocky Coasts
Tectonics, Sediment Supply, and Morphologies Along Rocky CoastsAlong active collisional margins, tectonic processes have uplifted and deformed rocks to create rugged landscapes with very little sediment input because of immature drainage basins along such geologically youthful landscapes. The presence of recently uplifted mountainous areas can also act as a barrier and prevent river systems from flowing, and thus carrying sediment, to the coast. Moreover, as you learned in Module 2, the relatively narrow and steep continental shelves that are characteristic of active tectonic margins do not help to dampen waves that move onshore from the open oceans. The result is that along active tectonic margins there is little delivery of sediment that could accumulate, and that sediment that does make it to the coast can be easily eroded and transported away by the high wave energy. Globally, there are many different types of morphologies along rocky coasts because of a wide range of rock types, styles of tectonic deformation, hydrographic regime, and styles of weathering.
Some of the most spectacular features of rocky coasts include sea arches and sea stacks, which are produced by the constant erosion of waves. A sea arch develops when a headland protruding into the ocean causes waves to refract around it. This refraction of waves concentrates their energy in specific locations along the headland, causing particularly rapid erosion if weakness such as faults and fractures are present in the rocks. In other cases, the waves may simply begin to erode into rock that is less resistant to erosion than the surrounding rock. Either way, the erosion leads to the development of small caves that may eventually meet below a promontory, leaving an arch above. The erosion continues and, for this reason, sea arches are very ephemeral coastal features. When they ultimately collapse, the remnants of the arch are called sea stacks.


For more information on sea arch formation and sea stacks, check out the following videos:
Video: West Wales - Sea Arches & Stacks (3:04)
West Wales - Sea Arches
To understand what's happening, we need to start at the southwestern corner of Wales, in Pembrokeshire. This is one of the most exposed parts of the Welsh coast because the prevailing winds are from the southwest. Waves driven across the Atlantic smash against the cliffs, continually wearing them away.
The harder pieces of coastline, like this headland, only erode quite slowly. But the softer bits, like that bay, get eroded much more quickly. And it's this difference, between hard and soft rocks, that leads to the repeating pattern of bays and headlands.
Although these cliffs are all made of the same material, carboniferous limestone, the rock isn't uniform throughout. It has weak layers, faults, and cracks running through it, all prime sites for erosion.
The erosion is due to several processes. There's hydraulic action, where the crashing waves compress water and air trapped in cracks, weakening and eventually loosening the rock. There's abrasive action, where material suspended in the water gets smashed up against the cliff face. And finally, there's chemical action, where the rock is dissolved by seawater and the rain. And just below where I'm standing is an absolutely stunning example of all these processes at work. This is the green bridge of Wales, a fabulous example of a sea arch.
If we go back 5 million years, the coast would have looked like this. First, the sea goes for the weak bands of rock, then it goes for the cracks in the harder rock, forming first arches and then stacks. This leaves the green bridge as we know it today. It's easy to guess what will happen in the future. Not all stacks are formed this way. Sometimes they just get left behind as the coastline around them erodes.
Those stacks will get worn down by the waves and the weather and become stumps like this one.
Video: How Caves, Arches, Stacks, and Stumps are Formed (1:58) (Video is not narrated.)
How Caves, Arches, Stacks, and Stumps are Formed
How Caves, Arches, Stacks, and Stumps are formed. By Katie Jamson.
First, headlands and bays are formed on a discordant coastline.
- HEADLAND
- BAY
- Bay sheltered by Headland (less erosion here)
- Hard Resistant Rock (little erosion) (e.g., limestone / chalk)
- Less Resistant Rock (lots of erosion) (e.g., Chalk / Sands and Clays)
- BAY
- Wave Direction (label pointing with arrows)
- DISCORDANT COASTLINE (Rocks outcrop at 90° to coastline)
- Bays and Headlands formed along this coastline due to differential erosion
- CONCORDANT COASTLINE (Rocks parallel to coastline)
- Wave Direction
This means the rock alternates between soft and hard rock. The rocks outcrop at a 90-degree angle to the coastline. This means the soft rock erodes quicker than the hard rock… forming Headlands and Bays. Headlands feel the full force of the waves. If there are any weaknesses in the form of cracks and faults, the sea will erode away the rock… This may eventually make caves mainly through hydraulic action. The cave is then widened and deepened by erosion to form an arch. As the roof of the arch is continually undercut, it eventually collapses, leaving an isolated stack caused by erosion and weathering. Again, these get eroded by the pounding waves and turn into stumps due to continual erosion. So, as you can see through the agents of erosion (hydraulic action, abrasion, attrition, and corrosion) along with weathering, landforms can change dramatically. Thank you for watching!
Learning Check Point
Learning Check PointTake a few minutes to think about what you just learned, and then answer the questions below.
Reef Coasts
Reef Coasts- What is the global distribution of coasts lined with coral reefs?
- Why are reefs globally distributed in this fashion?
- What are the different types of reef systems we see on a regional scale of kilometers or more?
Historically, the exact definition of a reef has been a bit controversial, and different definitions would be provided if you were to ask a geologist or a biologist. For the purpose of this discussion, a reef can be considered any organic framework that is wave resistant and modifies the environment around it because of organic growth. Keep in mind that this definition offers no information about the type of organism creating the reef. Corals, shellfish such as oysters, and even some types of worms can create reefs, although the scale of reefs created by oysters and certain types of worms is much different than the scale of reefs that can be created by corals. The Great Barrier Reef of northeastern Australia extends for nearly, 2300 km and is the only organic structure that is visible from space, whereas oyster reefs are typically only several 10s of meters in length. Fundamentally, reefs rise above the substrate that they are sitting upon and thus modify or alter the speed and direction of currents and waves.

Global Distribution of Coral Reefs
Global Distribution of Coral ReefsThe vast majority of large reefs created by corals in shallow, sunlit waters (< 50 m water depth) are located within a tropical zone located between 30º N and 30º S latitude with a preferred temperature range of approximately 22º to 29º C. Corals also grow best in areas with little suspended sediment in the water, so large coral reefs systems are not common to locations where there is a large input of sediment to the coastal zone by river systems. Although there are cold, deep water types of coral present in the ocean basins, they do not create large nearshore reef structures that affect adjacent coasts.

In total, there are three main types of shallow water coral reef structures: 1) barrier reefs, 2) fringing reefs, and 3) coral atolls. These three types are differentiated on the basis of proximity to land, the overall scale of the reef structure, and the shape of the reef.
- Barrier reefs are typically large-scale, linear features that extend parallel to a shore, with a lagoon between the reef and the mainland.
- Fringing reefs are directly attached to the shore, with no well-developed lagoon between the reef structure and the mainland.
- Coral atolls are circular reefs that often start out as fringing reefs attached to a volcanic island. As the volcanic islands subside, the reef grows upward and a lagoon develops behind the reef and inside the submerging island. Eventually, the island can subside below the water level, and a ringlike coral reef structure remains.
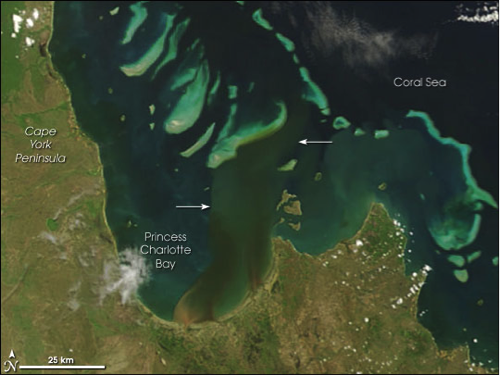


Recommended Readings and Video: For more information on coral and coral reefs, check out these links:
- Coral Reef, Wikipedia
- Corals and Coral Reefs, Smithsonian Natural Museum of Natural History
- Atoll, Wikipedia
- Formation of coral islands, 38-second video
Learning Check Point
Learning Check PointTake a few minutes to think about what you just learned, then answer the questions below.
Nearshore, Beaches, and Dunes
Nearshore, Beaches, and DunesHow can beaches be zoned? What is the basis for this zonation: morphology or process? Why are some beaches steep and higher gradient than other beaches? What processes can drive sediment exchange between the nearshore, beaches, and dunes? How does the storm profile of a beach look compared to the fair weather profile for the same beach? If ample sediment is available, what can happen to a beach following a major loss of sediment? Can it recover? How?
For many of you, the concept of the nearshore, beach, and dunes probably conjures ideas such as swimming about in breaking waves, games of Frisbee on a sandy surface, or heavily vegetated mounds of sediment that have to be crossed in order to reach the beach. From a coastal geologist's morphological perspective, each of these has a unique definition, where the:
- nearshore is a broad classification defined as the region extending from the land water interface (shoreline) to a location just beyond where the waves are breaking,
- beach is defined as the zone of unconsolidated material that extends landward from the low water line to a place where there is a marked change in physiographic form or a line of permanent vegetation representing dunes,
- dunes are defined as topographically elevated ridges and or mounds that may be heavily vegetated, but are formed as sand is transported by wind and subsequently deposited.
Each of these environments is unique in form and composition and is characteristically molded by fundamentally different processes that act to modify each environment on a daily or longer timescale

Zonation by Tidal Elevations
Another convenient and slightly more simplistic way of dividing the nearshore through dune system is to recognize areas along such a transect as a function of where they lie relative to the tidal range for the area. In this sense, the nearshore through the dune system can be divided, on the basis of elevation relative to mean sea level, into subtidal, intertidal, and supratidal zones.
- Supratidal zone: is situated above the high tide elevation and only occasionally is flooded, most commonly during high spring tides and storms. It includes the uppermost part of the beach as well as the dunes, and so, the non-storm process acting to transport sediment in this area is wind (aeolian transport). In this context, this area is recognized as the backshore and dunes zone.
- Intertidal zone: is located between the normal low and high tide levels. This zone is therefore repeatedly inundated by water and exposed to air. This also represents the zone where waves are routinely interacting with the land, leading to daily transport of sediment. In the image above this area is recognized as the foreshore or beachface.
- Subtidal zone: consists of regularly submerged, relatively shallow water area seaward of the intertidal zone. Waves and tides are always acting to move sediment in this environment. In the image above, this area is recognized as the shoreface.
Nearshore
NearshoreAn examination of nearshore zones on a global basis reveals that they are characterized by a wide variety of morphologies, which are dependent upon the wave and tidal conditions as well as the size of sediment that is present. Overall, it is a zone in which there is generally the capability for significant sediment transport both perpendicular to the beach as well as alongshore because of longshore sediment transport by wave action. In some nearshore systems, there may be a variety of alongshore bars or ridges of sediment that can eventually migrate landward and attach to the beach and thereby contribute to the seaward extension of the beach.

Beach
BeachThe beach is located landward of the nearshore zonation and can consist of a wide range of sediment types including pebbles, gravel and even sediment particles that are as large as boulders. The composition of a beach can also be highly variable, and sediment on a beach can be anything from grains of the mineral quartz to fragments of calcium carbonate shell produced by shelled organisms. The size of the sediment as well as the composition of the sediment that is located on a beach is wholly a function of the character of the sediment that is available at that location. Because beaches are constantly being influenced by the impact of waves and by changes in the elevation of the water levels because of tides, they can be extremely dynamic environments, capable of undergoing drastic changes in morphology within a timescale that ranges between nearly instantaneous to seasonal or longer.
During high energy events, such as large storms or tropical cyclones, waves increase in size and therefore are more capable of eroding sediment from a beach and transporting it either farther offshore or along the shoreline to a new location in very short periods of time. During longer time periods, similar results can occur even during fair weather when low energy waves are affecting the beach. In general, however, most beaches undergo the most substantial erosion and loss of sediment during storm events and then experience a period of recovery to regain a cross-sectional profile that is in equilibrium with the wave and tidal conditions.
The slope of beaches can also be highly variable and is a function of the composition of the beach and the characteristics of the waves impacting the beach. Consider what happens as a wave breaks and the swash of the wave runs onto the beach and then returns. As a wave breaks onto a beach, it rushes up the slope of the beach and carries some sediment with it. The energy of the wave is expended due to friction with the surface and the pull of gravity downslope on the beach. As the water of the wave returns downslope, referred to as backwash, it still carries some sediment with it. However, if the beach is very coarse-grained, then the backwash can rapidly percolate into the subsurface and very little water remains to carry sediment back down the beach to the sea. In this case, any sediment carried up the beach by the breaking wave becomes stranded at the landward limit of the breaking wave, and no backwash is available to carry sediment back down to the base of the beach. Alternatively, if the beach is fine-grained and saturated with water, then the backwash cannot percolate into the subsurface, and as the water returns to the sea it carries relatively more sediment with it, leading to a gentle gradient. As a result, coarse-grained beaches with a significant amount of percolation have overall steeper gradients than fine-grained beaches under similar wave conditions.

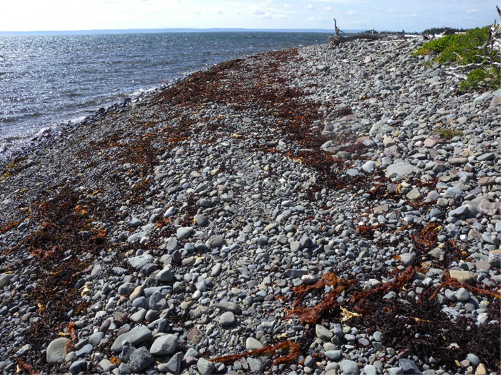
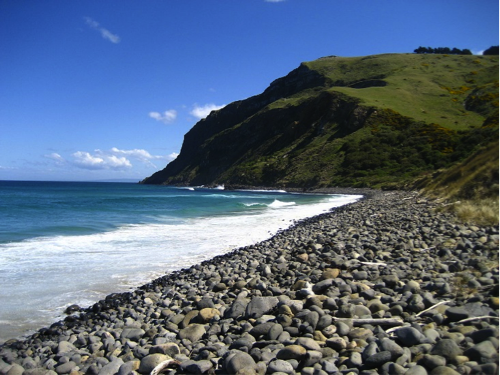
Dunes
DunesCoastal dunes, often referred to as sand dunes, form where there is a readily available supply of sand-sized sediment and are located landward of the beach in the supratidal zone. The size of the sediment, duration, velocity, and direction of winds in the coastal zone, as well as the size and extent of vegetation, are fundamental properties that govern the size and shapes of dunes in coastal settings. The development and growth of dunes derive from the beach when the wind is blowing in an onshore direction. When the wind is blowing offshore, sediment in the dunes is transported back onto the beach or offshore into open water where it may later be carried back to the beach by waves.
Sand accumulates to create a dune system when the wind carrying the sand encounters an obstacle. Pieces of driftwood, trash, or piles of seaweed can all provide such an obstacle, causing the velocity of the wind to locally decrease, at which point the transport of the sand ceases and it is deposited. Most often, the obstacle that creates large continuous sand dunes is salt-water tolerant vegetation, either beach grasses or shrubs and trees depending upon the climate of the region. Vegetation, therefore, promotes the deposition of sand and acts to stabilize the dune system because of rooting.
During fair weather conditions, the base of the dunes is not affected by wave energy when a beach is in equilibrium with the prevailing conditions, because the waves dissipate on the beachface. During a storm, when water levels are elevated because of storm surge and large waves are being produced, a dune system may, however, be subjected to breaking waves that can cause erosion and the removal of significant volumes of sediment from the dunes. In extreme situations, dunes can be completely washed over by storm waves, completely flattened, and the sediment that was removed can be carried offshore, alongshore, or farther inland to create a wash over platform.
Overall, the presence of well-established dune systems act as barriers against storm waves and, thus, help to protect infrastructure that is located landward of the dune systems. For this reason, as well as the unique coastal ecosystems that they provide, dunes are very often protected environments. Fences around dunes and walkways above dune vegetation are common features in high traffic areas, and walking through dunes or riding motorized vehicles across them can be met with hefty fines and punishment because of the damage these activities can cause to the dune vegetation.

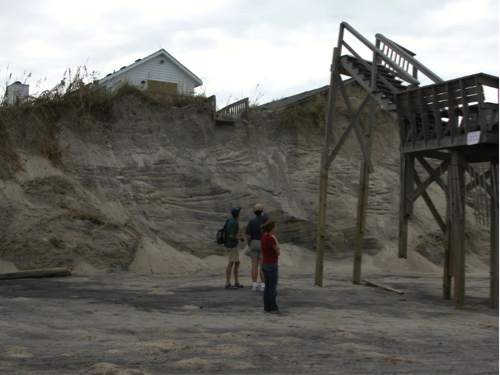

For more information on beach systems, check out these links:
- Information on different types of sand, Geology.com
- Explanation about the littoral system, Wikipedia
- Information about the nearshore and beaches, University of Puerto Rico, Department of Geology
- Review of beach processes along California, U.S., 4:48 minute video, Keith Meldahl, Professor of Geology and Oceanography, Mira Costa College
- Sand movement in dune systems, 5:32 minute video, Simon Haslett, Professor of Physical Geography, University of Wales
- Formation of Sand Dunes 30-second video, Darron Gedge's Geography Channel
Learning Check Point
Learning Check PointPlease take a few minutes to think about what you just learned then answer the questions below to test your knowledge.
Barrier Islands
Barrier Islands- How is a barrier island defined?
- What marine process is primarily responsible for the alignment of sand that is required to maintain a barrier island?
- How does the hydrodynamic regime affect barrier morphology?
Barrier islands are shore-parallel, elongated accumulations of sand that are constructed by waves and built vertically by the accumulation of sand from wind transport. They can be found along approximately 15% of the world’s existing coastlines, with the majority of them located along trailing edge or marginal sea coasts with wide, low gradient continental shelves. In some locations, they are isolated and separated from the mainland by either open bodies of water or marsh and tidal creek systems, depending upon the hydrodynamic regime of the area. However, in some locations, they can be attached to the mainland at one end (barrier spit) or both ends (welded barrier). The length of barrier islands can range from just a few kilometers to as much as 100 km, and they can be as wide as several kilometers wide.


Primary Morphological Components
The primary components of a barrier island system include the following:
- Nearshore, beach, and dune systems: these environments share the same characteristics as those that were discussed in the section on beaches.
- Backbarrier: the area located between the barrier and mainland and can consist of bodies of water such as bays, lagoons, and sounds, as well as marshes, tidal creeks, and tidal flats.
- Bays and Lagoons: shallow, open to partially restricted water areas located in the backbarrier.
- Marshes: salt-tolerant vegetated areas within the intertidal area of the backbarrier.
- Tidal Flats- flat, sandy to muddy areas that are exposed at mid to low tide along the backbarrier.
- Tidal creek: a backbarrier creek through which water flows during flood and ebb tide.
- Tidal Inlets: openings along a shore-parallel chain of barrier islands through which water is exchanged between the open ocean and the backbarrier environments during a tidal cycle.
- Tidal Deltas: sandy to silt-rich shoals that rise above the adjacent seafloor and are located on the landward and seaward side of tidal inlets.


Hydrodynamic Regime
Hydrodynamic RegimeBecause barrier islands are built by waves, they do not develop in tide-dominated environments. Waves are responsible for the longshore transport of sediment, and it is this transport that drives the deposition of sediment to create elongated features consisting of sandy barrier islands. There are, however, numerous examples of barrier islands within mixed-energy as well as wave-dominated environments. In fact, the two fundamental types of barrier islands are recognized as wave-dominated and mixed-energy barriers.
Wave-Dominated Barriers
Wave-Dominated BarriersWave-dominated barrier islands are long, narrow barrier islands with typically widely spaced tidal inlets. Because of the wave dominance, the capability for longshore transport is high, and tidal inlets in this type of system are relatively narrow because longshore transported sediment acts to fill in the inlets and restrict their widths. The tidal deltas on the seaward side of the inlets, ebb-tidal deltas, also tend to be small compared to mixed energy barrier systems because waves tend to limit the distance that ebb-tidal deltas can migrate seaward.

Mixed-Energy Barriers
Mixed-Energy BarriersMixed-energy barrier island systems are typically short and wider at one end than the other end. Historically, this type of morphology has been referred to as a drumstick barrier island because of its approximate similarity in shape to the drumstick of a chicken leg. The tidal inlets between these barriers are large because of the relatively higher tidal energy. Compared to wave-dominated barriers, they also have large ebb-tidal deltas because the strength of the tidal currents is able to transport sediment seaward in a regime of relatively low wave energy. The relatively wider end of the island is the result of the accretion of sediment as waves refract around the edge of the ebb-tidal delta, causing a localized reversal in the longshore transport pattern and leading to sand accumulation.

Future of Barrier Islands
Future of Barrier IslandsIn recent years, there have been numerous studies investigating how barrier island systems respond to change in sea level and impacts created by storms as they erode sediment and destroy coastal property. Because barrier islands form a true barrier along many inhabited coastal zones, they represent a line of defense for inland communities from the destructive power of storm surges and waves that are driven by large storms. Unfortunately, however, there are global trends in barrier size reduction because of reduced sediment input caused by damming rivers, human modifications to coastal systems, storm-driven erosion, and relative sea level rise.
In future modules, we will explore the dilemmas facing communities located on barrier islands and the question of whether these communities can expect to survive.
Check out these links to explore barrier islands further:
Louisiana's barrier islands: Barataria-Terrebonne National Estuary Program: Barrier Islands
Video and article on restoring Louisiana's barrier islands: Restoring Louisiana's Barrier Islands
Learning Check Point
Learning Check PointPlease take a few minutes to think about what you just learned, then consider how you would answer the questions on the cards below. Click "Turn" to see the correct answer on the reverse side of each card.
Deltaic Coasts
Deltaic Coasts- What is a delta?
- How does the morphology of a delta reflect the processes acting to shape it?
- Why are deltas at risk?
Geologic and archeological evidence clearly indicates that a significant part of the rise of modern societies and culture can be attributed to the development of the modern world's deltas, which started forming during the slowed post-ice age sea level rise. Numerous lines of evidence indicate that well-developed societies were occupying deltas in the time frame of 4,000 to 7,000 years before present because of the many natural resources that deltaic environments generally contain. Resources such as shellfish, fish, furs, and plants were necessarily taken from the wild by our ancestors, and so many ancient societies began proximal to deltaic environments.
The term delta comes from Herodotus, a Greek historian, and philosopher who recognized the similarity of the upside-down Greek letter delta (Δ) and the shape of the Nile river delta when viewed from the south toward the north.

What is a delta?
A delta is a subaerial and subaqueous volume of sediment that has accumulated at the mouth of a river as it enters into an open body of water. The largest deltas are the product of very large river systems that are transporting large quantities of sediment. The Ganges-Brahmaputra delta is one of the largest deltaic environments on the planet and carries vast amounts of sediment to the ocean. There, the sediment is reworked by strong tidal currents of the region to form inlets and sediment ridges.

Delta Morphologies and Driving Processes
Delta Morphologies and Driving ProcessesVariations in delta morphology tell us something about the processes that cause and drive the evolution of deltaic environments. Globally, it is widely accepted that there are three end-member morphologies of deltas that reflect the relative influence of wave energy and tidal energy in the receiving basin or sediment input by the source river into the receiving basin. On a ternary plot, these three end members each represent one apex of the plot, and all deltas fall somewhere on this plot. Deltas that are primarily the result of high rates of sediment input tend to be elongated because of their rapid outbuilding associated with high rates of deposition into the receiving basin. Wave-influenced deltas have smooth, often arcuate shorelines with numerous ridges that reflect the longshore transport of river-delivered sediment by the high wave energy. Tidally influenced deltas have numerous shoreline perpendicular tidal passes and tributaries, with sediment bodies aligned parallel to the direction of tidal exchange.


Deltas in Crisis
Deltas in CrisisDuring the last decade, a substantial amount of concern has arisen regarding the health of the planet's major deltas. Over-exploitation of deltaic resources by humans, the introduction of pollutants, and excess nutrients to the rivers, as well as the management of river water that feeds deltas has severely damaged the sensitive environments of many deltas. Additionally, reduced sediment loads in many deltas, because of the construction of dams, coupled with global sea level rise and/or local land subsidence has resulted in widespread loss of deltaic wetlands and fronting sandy barrier shorelines. Because deltaic plains are so heavily relied upon by humans and, in some cases, are densely inhabited by humans, there are, for some deltas, widespread efforts to try to halt coastal erosion and environmental damage.
For example, the wetlands of the Mississippi River delta have undergone substantial change during the last century, with large areas of wetlands converted to open water because of relative sea level rise and erosion by storms. The rate is just staggering, with a football field of wetlands vanishing into open water every 30 minutes! The loss of wetlands across the delta is so severe that communities and infrastructure that were once separated from the open Gulf of Mexico by wetlands are now exposed to open marine water and have become more vulnerable to the damaging effects of storm surge. As a result, the state of Louisiana has developed a series of plans to build new land and infrastructure that would help reduce the net loss of land. The staggering change between 1932 and 2011 can be seen in the two satellite images below.


More Information
- For more information on deltas, see Delta.
- For more information on issues with and plans to restore the Mississippi River Delta in Louisiana, see Restore the Mississippi River Delta.
Learning Check Point
Learning Check PointPlease take a few minutes to think about what you just learned, then answer the questions below.
Estuaries
Estuaries- What is an estuary?
- How do estuaries form?
- What sort of processes takes place in estuaries?
Definition and Morphology of Estuaries
Coastal geologists define an estuary as a semi-enclosed body of water with an open connection to the ocean and one or more rivers flowing into it. They represent a transitional environment between the solid mainland and the sea and because of the inflow of rivers are partially diluted with fresh water so that they do not contain normal salinity marine water. As a transitional environment, they are influenced by marine processes, such as waves and tides, as well as river processes, such as the delivery of sediment and fresh water.
The Importance of Estuaries
Some of the world's most productive ecosystems are located within estuaries and host a wide range of organisms. In fact, many species of commercially important fish and shellfish spend part of their life cycle within estuaries before reaching maturity. They are, however, an environment that, like many other coastal environments, faces a wide range of environmental problems arising from land-use practices, dumping of sewage and other pollutants, and the introduction of excess nutrients because of poor agricultural practices.
Historically, estuaries have been classified a number of ways, including how they formed and their morphology, the circulation patterns that are present within the estuary, and the relative importance of waves and tides within an estuary. In this module, we will only be discussing estuary formation and circulation patterns of classification.


Estuary Formation
Estuary FormationDifferent ways that estuaries can form include:
- Ria Estuaries: rising sea level fills an existing river valley, such as what happened to create a special case of Ria known as the Coastal Plain Chesapeake Bay Estuary of the eastern U.S.A.
- Tectonic Estuaries: tectonic deformation of the Earth’s crust, such as faulting, creates a localized depression that fills in with marine waters such as San Francisco Bay. Water depths in tectonic estuaries can be highly variable.
- Bar Built Estuaries: migrating barrier islands or spits extend across the mouth of a bay and restrict the amount of marine water entering the bay to create an estuary. They tend to be relatively shallow and typically less than 10m of water.
- Fjord Estuaries: glacially carved, U-shaped valleys that filled with marine water since the end of the last ice age. They can extend long distances 10s to 100s of kilometers and as deep as several hundred meters.


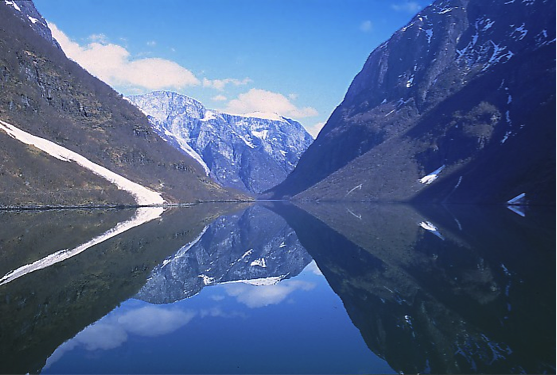
Estuary Salinity Patterns
Estuary Salinity PatternsThe relatively higher density of saltwater compared to freshwater means that freshwater will float on top of saltwater. In some cases, there may be mixing between the two water masses but, in other cases, little to no mixing may take place to produce a highly stratified water column with a layer of buoyant freshwater situated above a layer of saltwater. The development of a well-mixed estuary or a highly stratified estuary is a function of the estuary morphology, magnitude of freshwater input, estuary-mouth tidal range, and how the tide propagates up the estuary. A classic comparison is that relatively shallow, bar-built estuaries are often well-mixed, and, alternatively, deep, fjord-style estuaries are highly stratified. It is also important to note that besides there being a vertical profile of salinity variation possible, there are also variations along the length of the estuary. Near the mouth of an estuary, one would expect to generally find the highest salinity water where the influence of the sea is the greatest and the most freshwater at the most inland extent where freshwater river systems enter into the estuary. These variations in salinity structures lead to differences in the distributions of salt-water and fresh-water tolerant plant and animal species within an estuary and how organisms use the estuary environments.

Recommended reading for salinity
- Harte Institute for Gulf of Mexico Studies: Freshwater Inflows: An Estuarine System can be Classified by the Salinity Zone
Estuary Circulation Patterns
Estuary Circulation PatternsPatterns of estuarine circulation play an important role in sedimentation within the estuary and the distribution of different ecosystems in the estuary. Fundamental control on the types of circulation patterns can be linked to the relative relationships of freshwater input, the tidal range, velocity, and direction of winds, and currents created by waves. Each of these is capable of creating currents within the estuary and thus control how freshwater and saltwater interact in the estuary and where sediment can accumulate within an estuary. For example, during periods of low river inflow to an estuary, wind-driven saltwater may move farther into an estuary than it would during high river discharge into the estuary. During intervals of high freshwater runoff, freshwater, and sediment may extend well into the estuary and lead to sedimentation near the mouth of the estuary in a location where sedimentation by rivers is typically low.
Earth Complexity in Action: Estuaries
Earth Complexity in Action: EstuariesThe complexity of natural systems and the complexity of the interaction between the various spheres of the Earth is extremely evident when considering coasts and coastal systems.
Consider the potential for the complexity of salinity and circulation within an estuarine system, a partially enclosed coastal body of brackish water that has freshwater input by rivers and saltwater input by marine processes. The circulation of an estuary can vary substantially across a range of time scales such as daily, seasonally, or annually. Changes in freshwater input during periods of heavy rain, fluctuations in tides, or changes in the direction that the wind is blowing can all contribute toward how water moves around within the estuarine system. During periods of heavy rainfall, freshwater input may result in a much-lowered salinity in the estuary, whereas during periods of drought and strong onshore winds, salty water can be pushed into the estuary by waves and the salinity of the estuary increases. Complexity in an estuarine system exists because of the numerous interacting physical processes of the hydrosphere and atmosphere that act on the system.
Now, consider how this complexity may affect the anthrosphere or the part of the environment that is made or altered by humans for human activities or habitat. Suppose you were making a viable living, fishing oysters for commercial resale. Most oysters are relatively environmentally restricted, and too much freshwater can kill them, as can too much saltwater. Perhaps, one year, you are able to very successfully oyster fish an area of the estuary because the freshwater and saltwater input has been perfectly balanced to create optimal conditions for oysters very close to your home. The following year, there is so much freshwater runoff into the estuary that all of the oysters near to your home die or do not grow to the adequate size. As a result, you would have to travel to new locations in the estuary to find the optimal oyster growing conditions, something that might mean longer boat travel time for you and more fuel to get onsite, thereby reducing your net profit. So, the complexity of natural processes interacting with each other generates complexity for how society deals with these changes.
Summation
SummationThe complex interaction of estuary morphology, freshwater influx, waves, and tides leads to the diverse range of estuarine conditions and environments that exist on a global basis and that may exist daily to seasonally in an individual estuary. The high primary and secondary productivity of estuaries and the fact that they can provide an important buffer to inland communities and infrastructure against the open ocean make estuaries a critically important coastal system. Yet, many are at risk because of exploitation. The Chesapeake Bay estuary, for example, has experienced widespread degradation of fisheries because of damage to bay habitat from the introduction of excess nutrients and pollution, and extensive programs are underway to mitigate against the substantial damage that has already been done to the system.
For more information on estuaries, check out these links:
- Check out more information on estuaries.
- More details on human impacts are on this site: Hart Research institute for Gulf of Mexico Studies: Estuaries
- Watch a YouTube video about estuaries.
- Check out more information on the Chesapeake Bay.
Learning Check Point
Learning Check PointPlease take a few minutes to think about what you just learned then answer the questions below.
Coastal Wetlands and Maritime Forests
Coastal Wetlands and Maritime Forests- What is a coastal marsh?
- What are mangroves and what role do they play in capturing sediment and anchoring substrate?
- How can the presence of extensive marsh platforms and mangrove forests help to reduce inland storm surges and flooding?
Coastal wetlands and maritime forests are unique communities of vegetation that can exist along coastal zones. They are directly affected by coastal conditions including changes in water level due to tides, coastal river influx, freshwater, saltwater, wave activity, wind and salt spray, and storm surges. Inasmuch as they are communities uniquely synced to the conditions of their environment, even subtle changes in one condition can cause widespread deleterious changes to the plants themselves.
Coastal Wetlands
Coastal WetlandsThe term coastal wetlands defines an area of land that is permanently or seasonally inundated with fresh, brackish, or saline water and contains a range of plant species that are uniquely adapted to the degree of inundation, the type of water that is present, as well as the soil conditions.
In some cases, coastal wetlands can extend across extremely large areas, as is the case for southern Louisiana along the north-central Gulf of Mexico. The importance of coastal wetlands is well known in southern Louisiana because there, like many other places, the coastal wetlands provide important habitat for a wide range of organisms. They also protect inland communities from the large storm surges that tropical cyclones can produce, by creating friction against an incoming storm surge, resulting in a reduction of the magnitude and extent of inland flooding during tropical cyclones. The greater the width of intact wetlands, the less likely it is that more inland areas will experience the full force of a tropical cyclone. Southern Louisiana has been, however, experiencing drastic loss of wetland at rates that for the last several decades have been equivalent to the loss of a U.S. football field every approximately 30 minutes.

Coastal Wetland Examples
Coastal wetland is used broadly here to identify areas where wetland plants inhabit the coastal zone, in either freshwater or saltwater environments of the coastal zone. For this reason, along the continental U.S. coastal zones, it includes vegetated environments such as salt marshes, fresh marshes, bottomland hardwood swamps, and mangrove swamps. In the United States, coastal wetlands extend across nearly 40 million acres and constitute approximately 38% of the total wetlands in the conterminous U.S.
- Marsh: A marsh is a type of wetland that consists of herbaceous plants (plants with leaves and stems). Typically, there is a period of annual dieback or at least a resting period from growth, and the system can be either salt or freshwater in nature.
- Salt Marsh: True salt marsh is strongly affected by the tides of a given area on a daily basis because they are located within the intertidal window of elevation. Along the coast of the U.S., all salt marsh experiences a severe to slight dieback during the winter, but begins growing strongly the following year with the return of warmer temperatures. Typical salt marsh structure includes tidal creeks through the marsh platform and localized ponds that may hold some water even during very low tides.
- Fresh Water Marsh: On a global basis, the distribution of coastal-zone freshwater marsh is most closely tied to river systems that enter into coastal zones. The steady influx of freshwater into coastal rivers provides an opportunity for fresh-water vegetation to dominate and prevents the incursion of flora that requires some level of salinity. The Florida Everglades of Florida in the U.S. represent some of the largest, and perhaps the largest, freshwater marsh in the world.
- Swamp: Forested wetlands with little circulation to nearly stagnant conditions are characteristic of swamps. Freshwater, brackish, and saline water are all possible environmental conditions in a swamp.
- Bottomland Hardwood swamps: In the coastal zone, bottomland hardwood forests are closely linked to the availability of freshwater. As a result, most extensive bottomland hardwood swamps are in low-lying river flood plains. Occasional flooding of these environments provides sediment to help anchor the vegetation and nutrients that are critical to growth. Excessive flooding or the introduction of saline waters can have serious effects on the health of such systems.
- Mangrove Swamps and Forests: Mangrove swamps are distributed through tropical and subtropical regions. There are numerous species of mangroves, but they all represent a plant that is halophytic or salt-loving and is associated with other trees and plants that grow within brackish to saline tidal waters. They may consist of a very complicated maze of woody roots and limbs. Depending upon the species of mangrove, very complicated interwoven root structures can develop and provide a significant buffer against erosion and inland progressing waves and storm surges during high-energy events. Across the U.S., they are restricted to low-latitude environments because of the species' intolerance for cold temperatures. Three different species exist from south Florida along to the Texas Gulf Coast, and, in fact, one of the largest mangrove swamps in the world is on Florida's southwest coast where Red Mangrove form structurally resilient coastal environments because of their interlocking woody growth patterns.
Maritime Forests
Maritime ForestsMaritime forests are coastally located areas of woods that develop on elevations and topography that is higher than that of coastal wetlands. They primarily rely upon shallow freshwater and cannot tolerate long exposure to salty water; even salt spray can be detrimental to some species of trees that establish maritime forests habitats. Such systems are discontinuously distributed along the U.S. Atlantic coast, but can be found elsewhere as well. In most cases, the soil composition promoting the growth of these forests is sand, either derived from sedimentary units deposited in the past or more recent deposits, such as beach ridges.
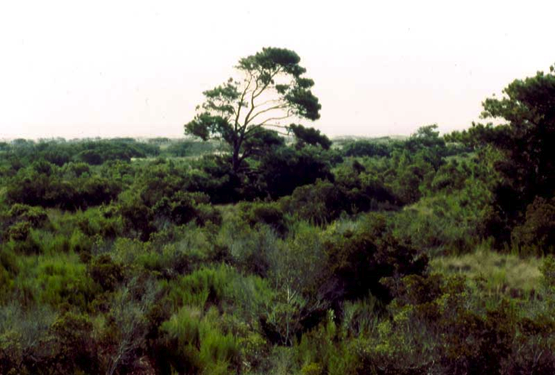
Coastal Wetlands and Maritime Forests Summary
Coastal Wetlands and Maritime Forests SummaryCoastal wetland and maritime forests represent unique provinces of vegetation that are uniquely adapted to the harsh conditions of the coastal zone. They provide a range of different habitats for coastal animals and simultaneously provide an important coastal barrier to more inland-located environments, as well as people and infrastructure. There is, however, much concern for the future of our modern coastal vegetation as the different provinces of coastal vegetation face continued exposure to pollution and excess nutrient inputs, changes in the elevation of sea level, and repeat large-scale storm impacts.

For more information on coastal vegetation, check out these links:
- Very good overview of salt marshes
- Nice YouTube video about freshwater marshes
- Information on freshwater marshes
- More information on maritime forest
Learning Check Point
Learning Check PointPlease take a few minutes to think about what you just learned and then answer the questions below.
Module 3 Lab
Module 3 LabIntroduction
In this lab, you will examine a sandy shoreline's dynamics. Two types of data will be explored: shoreline erosion using Google Earth timeline and shoreline elevation change data produced from elevation profiles. These two types of data yield a great deal of information about the dynamics of a sandy, wave-dominated shoreline and reveal trends in the erosion and deposition of sediment.
Important!
We advise you to either print or download/save this document as it contains the steps to complete the Module 3 Lab in Google Earth. In addition, it includes prompts for measurements and questions that you should take note of (by writing them down or typing them in) as you work through the lab.
Download
Statement of Use of AI on Exams, Quizzes, and Labs
Instructions
Once you have worked through all of the steps in the worksheet, you will go to the Module 3 Lab (Quiz) to complete the Lab by answering multiple-choice questions. The answers to questions on this Lab worksheet will match the choices in the multiple-choice questions in Canvas. Submit the quiz in Canvas for credit.
Summary and Final Tasks
Summary and Final TasksThroughout this module, you were introduced to a wide range of coastal environments that exist across Earth. Each of these has a unique geomorphology that results from the interplay and influence of processes such as waves and tides, sediment supply, climate, type of bedrock, and, of course, plate tectonics.
A focus of the module was to point out that processes such as plate tectonics (Module 2) may affect the characteristics of a coast at the scale of several 100s to 1000s of kilometers along a continental margin but along such an extent of coast there may be smaller scale (10s to 100s of kilometers) coastal systems that are considerably different from one another. For example, the trailing-edge coast of eastern North America varies substantially from Canada to Florida, with rocky coastline characteristics in northeastern Canada and the northeastern U.S. to major sand-rich barrier island systems farther south around the mid-Atlantic states (e.g., Cape Hatteras of North Carolina) of the United States. These variations along a continental margin are a result of variability in sediment supply, climate, and hydrodynamic regime along the length of the eastern North America continental margin. The same type of along-margin variability in processes holds true along other continental margins, and it is clear that a unique suite of processes collectively contributes to create the wide range of global coastal geomorphologies that are evident on Earth today.
You have reached the end of Module 3! Double-check the Module 3 Roadmap (in Goals and Objectives) to make sure you have completed all of the activities listed there before you begin Module 4.
References and Further Reading
- Coastal Landforms and Processes
- Text Book on Coasts: Davis, R.A. and FitzGerald, D.M., 2004, Beaches and Coasts, Blackwell Science, Oxford, England. 419 p.
- Barrier Island Morphology: Schwartz, L.M., 1971, The multiple causality of barrier islands, Journal of Geol., v. 79, no. 1, p. 91-94.
- Danube Delta Discussion
- Nearshore Dynamics
- The Not-So-Mysterious Loss of Salt Marshes and Ecosystem Services
Module 4: Sea Level Rise
Module 4: Sea Level RiseIntroduction
You have no doubt seen numerous references to sea level rise, in the media and elsewhere, in recent years. With 60% of the world’s population living within 60 miles of the coast, the current rates of sea level rise – 3.2 mm/yr. (~0.12 inches), and a predicted of sea level rise of approximately 1 meter (39 inches or 3 feet, 3 inches) before the end of the 21st century - we know there will be serious consequences. Such phenomena as king tides, sunny day flooding that occur when there is a new or full moon, accelerated beach erosion, higher and more destructive storm surges, and salt water intrusion into freshwater wetlands and aquifers are a few of the effects that we are hearing about more and more frequently. As these effects persist, difficult questions about the future of some coastal communities will have to be addressed by municipalities, local governments, states, and the federal government, and are indeed already being addressed. In fact, there are many examples around the U.S. and the world of ways in which sea level rise is becoming a persistent problem for residents, and plans and policies to address the issues are being implemented.
In this module, we will examine sea level change at various temporal and spatial scales to gain a perspective and understanding of these current issues. In later modules, we will look at case studies in which sea level rise plays a major role in the daily lives of people in communities around the U.S. and the world and consider the implications for the future of these communities.
Required Video
Begin by watching the following 6-minutes 20-second video Rising Sea Levels - Changing Planet from the National Science Foundation. Learn and make notes on the main takeaway points. These points will recur in this module Note: the narrator incorrectly says that 3 mm of sea level rise is equivalent to 1.2 inches. It is actually 0.12 inches.
Rising Sea Levels
ANNE THOMPSON, reporting:
The shoreline, where the land and the ocean meet; here 60 percent of the world's population live and work within 60 miles of the coast; making rising sea levels a very big threat. For centuries, global sea levels have remained mostly constant. But over the past 100 years, as the climate has warmed, sea level rise has accelerated, rising by about 7 inches, or 17 centimeters. And scientists predict it will only increase. Their models show that over the next 100 years, the seas could rise anywhere from 7 inches to more than 3 feet (18 centimeters to more than a meter) with potentially disastrous social and economic impacts.
Dr. BENJAMIN P. HORTON (University of Pennsylvania): If we get rates of sea level rise greater than one meter, you're going to inundate many of the coastal areas on our planet, causing health problems, socioeconomic problems, biological problems, even political instability.
THOMPSON: Dr. Ben Horton, at the Sea Level Research laboratory at the University of Pennsylvania, says the impacts of rising sea levels are already being felt. Many island nations genuinely worry that their countries are at risk of disappearing altogether. To dramatize the problem, the Maldives government even held a cabinet meeting underwater. In the United States, coastal communities are also worried, with many of its largest cities sitting right at waters edge. Boston, New York City, Washington, DC, Miami, New Orleans, and Los Angeles are only some of the places that face the threat of greater storm surges, flooding, and coastal erosion.
Dr. HORTON: We're trying to look at the globe and say, well, where on our planet shall we be most worried about? Is it the Mississippi Delta? Is it the Nile Delta? Is it going to be Bangladesh with its huge areas of coastal lowlands with high population there? Is it some of the deltas around China?
THOMPSON: Scientists cite two main causes for rising sea levels: a warming climate that is heating the ocean and causing the volume of water to expand, and melting land-based ice sheets and glaciers that are adding to the total amount of water in the oceans.
Dr. DAVID HOLLAND (New York University): Sea level is rising; and of the sea level that we look at today, one third of that comes from warming of the ocean. The other two thirds come from adding water to the ocean.
THOMPSON: Scientists have long known that the warming atmosphere is causing ice sheets and glaciers to melt and flow toward the ocean. But recently, they have discovered that some ice sheets don't just melt from the top.
Dr. David Holland, at New York University's Center for Atmosphere Ocean Science, studies marine ice sheets in Greenland and Antarctica. Marine ice sheets rest on the ocean floor and can melt from both above and below sea level.
Dr. HOLLAND: You can melt ice two ways. You can melt it from the top using the atmosphere or, turns out and more importantly for quick change, you can melt it from the bottom by ocean waters. We have warm waters that are near those ice sheets, and if those warm waters actually touch the marine ice sheets, the marine ice sheets melt, and you have big changes in sea level.
THOMPSON: As the marine ice sheets melt, the land-based ice behind them moves more quickly toward the sea, and this poses the greatest threat for rapid sea level rise. To understand how and why warm ocean water is circulating to Antarctica, Holland devised a rotating water model. He uses ice and cold water for the polar region and warmer water to represent tropical waters, and adds blue and red dyes to represent cold and warm water.
Dr. HOLLAND: What we are really trying to understand is these warm ocean currents, will they actually touch the ice sheets more in the future or less? That-- that's the issue.
THOMPSON: NASA satellites have shown that since 1993, global sea levels are rising at an average of nearly 3 millimeters, or about 1.2 inches, per year. That doesn't sound like much. But when you add in other factors such as local gravity and ocean currents, sea level rise can vary, greatly influenced by the geology of the region.
Dr. HORTON: When we're thinking about sea level rise, we must also consider the land. And the land level changes will differ in relationship to ice age processes, sediment compaction, consolidation, groundwater withdrawal, et cetera.
THOMPSON: Horton and his team take sediment cores from the salt marshes along the U.S. eastern shoreline to study historical sea levels. By analyzing the sediment and microscopic flora and fauna found in the cores, they can determine when sea levels changed dramatically.
Dr. HORTON: And if you look along the core, you've got changes in color that reflect changes in organic content. Each one of these changes marks a change in sea level.
THOMPSON: Horton uses the sediment cores to create a timeline that goes back thousands of years, long before sea levels were recorded by instruments, to gain an idea of how sea levels and land levels have changed.
Dr. HORTON: If we go back through our geological record, the coastline systems have always evolved. As a society, we have to learn to adapt to this dynamic nature of our coastlines. We cannot just say we're going to hold a line.
THOMPSON: Using the past to help people meet the challenges of the future, so we can plan and prepare for the changes in our planet.
Learning Check Point
After watching the video, please take a few minutes to think about what you just learned, and answer the questions below.
As we discussed in Module 1, many coastal cities and smaller communities are increasingly vulnerable to coastal flooding, and sea level rise is a major concern for residents, businesses, and planners. The video mentioned multiple types of issues faced in a future with increasingly higher sea levels, including health problems and political unrest. In this module, we will explore the science behind the causes and effects of sea level change through Earth’s history and examine the recent sea level trends in the context of challenges facing coastal human communities, landscapes, and ecosystems at present.
The following is a NASA video (1:58) showing animation of sea level anomaly data. The data visualization introduced in the video demonstrates that in some areas sea level has risen, while in others it has fallen. Overall, the trend is a global increase in mean sea level, with an increase in the rate of sea level rise.
The current average rate of sea level rise of close to 3 mm per year does not sound like a lot, but it represents an approximate tripling of sea level rise rates since the beginning of the 20th Century. (1900 rate was approximately 1.4 mm/ year on average, now it is more than 3.4 mm/ year on average).
Video: 22 Years of Sea Level Rise Measured From Space(1:58)
This visualization shows total sea level change between 1992 and 2014, based on data collected from the TOPEX/Poseidon, Jason-1 and Jason-2 satellites. Blue regions are where sea level has gone down, and orange/red regions are where sea level has gone up. Since 1992, seas around the world have risen an average of nearly 3 inches.
Hi! I'm Josh Willis, the project scientist for the Jason-3 missions to measure sea level rise from space.
In some ways, sea level rise is really simple. As water heats up, it takes up more room. This drives sea level rise and, in addition, as glaciers and ice sheets are melted, extra water is added to the ocean, just like when you turn on your faucet in the bathtub.
Over 90 percent of the heat trapped by greenhouse gases is being absorbed by the oceans. When that happens, seawater expands, and this helps drive sea level rise.
Hundreds of millions of people around the world live on coastlines that can be threatened by rising seas. This animation shows how sea levels have changed over the last 23 years. Globally, sea levels have gone up by about 6 centimeters during that time, but it doesn't happen all at the same speed everywhere. Some places are rising faster than others, and some places are even falling.
Orange and red colors mean that sea levels have gone up in these locations, and blue and white means sea levels stayed the same or actually fallen. We can see that most places in the ocean are orange, meaning sea levels risen over the last 23 years. In a few places, you can see blue where sea level has actually dropped. Here, we see the Gulf Stream. The red and blue indicate that this massive current has shifted slightly in the last 23 years off the west coast of the United States. We've seen sea levels actually drop. This is because waters there have been cooling because of something called the Pacific decadal oscillation. In the western Pacific, sea levels have been rising very rapidly. This is because of heat being pushed from east to west across the Pacific. Sea level rise is going to be a major impact of human-caused climate change and, here at NASA, we're doing everything we can to try and better understand it.
Credit: VideoFromSpace
Goals and Objectives
Goals and Objectives- Students will develop fundamental geospatial skills and concepts needed to assess coastal processes that produce sea level change.
- Students will be able to explain what sea level is and differentiate the mechanisms that interact to produce changes in sea level over short-term and long-term time periods.
- Students will characterize trends in sea level over geologic time and conceptualize how changes in sea level can result in various spatial scales of coastline change.
- Students will use real tidal gauge data from diverse regions to identify recent trends in sea level change, and will use these trends and NOAA Sea Level Rise Viewer data to formulate projections for future sea level positions.
Learning Objectives
By the end of this module, students should be able to:
- describe the changes in sea level change in the Earth’s geological history, to gain a perspective of modern sea level rise;
- distinguish among methods used to determine sea level changes taking place in the past, present, and future;
- identify factors (intrinsic, extrinsic, and anthropogenic) that contribute to sea level change;
- discriminate among causes of local, regional, and global sea level change and associated impacts on coastal morphology and human communities;
- locate and use key datasets and data visualizing tools to analyze sea level dynamics at different temporal scales, and their impact on coastal landforms.
Module 4 Roadmap
| Activity Type | Assignment |
|---|---|
| To Read | In addition to reading all of the required materials here on the course website, before you begin working through this module, please read the following required readings to make sure you are familiar with the content so you can complete the assignments.
Extra readings are clearly noted throughout the module and can be pursued as your time and interest allow. |
| To Do |
|
Questions?
If you have any questions, please use the Canvas email tool to contact the instructor.
What is Sea Level and How is it Measured? An Introduction
What is Sea Level and How is it Measured? An IntroductionThe following pages look at what sea level change is, and what mechanisms drive sea level change on a planetary scale.
Before we investigate these mechanisms further, let’s ask a couple of fundamental questions: What is sea level anyway? How is it measured...and why has it fluctuated during the course of geologic time? And why is it not even across the globe? As you watch the following quick video, make a list of forces mentioned that influence sea level. The video clip (3:25) was published on Nov. 25, 2013, by MinutePhysics.
Video: What is Sea Level? (3:25)
What is Sea Level?
Sea level seems like a pretty easy concept, right? You just measure the average level of the oceans and that's that. But what about parts of the Earth where there aren't oceans? For example, when we say that Mt. Everest is 8850m above sea level, how do we know what sea level would be beneath Mt. Everest, since there's no sea for hundreds of kilometers? If the Earth were flat, then things would be easy - we'd just draw a straight line through the average height of the oceans and be done with it. But the Earth isn't flat.
If the Earth were spherical, it would be easy, too, because we could just measure the average distance from the center of the Earth to the surface of the ocean. But the Earth isn't spherical - it's spinning, so bits closer to the equator are "thrown out" by centrifugal effects, and the poles get squashed in a bit.
In fact, the Earth is so non-spherical that it's 42km farther across at the equator than from pole to pole. That means if you thought Earth were a sphere and defined sea level by standing on the sea ice at the North Pole, then the surface of the ocean at the equator would be 21km above sea level. This bulging is also why the Chimborazo volcano in Ecuador, and not Mount Everest, is the peak that's actually farthest from the center of the Earth.
So, how do we know what sea level is? Well, water is held on Earth by gravity, so we could model the Earth as a flattened & stretched spinning sphere and then calculate what height the oceans would settle to when pulled by gravity onto the surface of that ellipsoid. Except, the interior of the Earth doesn't have the same density everywhere, which means gravity is slightly stronger or weaker at different points around the globe, and the oceans tend to "puddle" nearer to the dense spots. These aren't small changes, either - the level of the sea can vary by up to 100m from a uniform ellipsoid depending on the density of the Earth beneath it.
And on top of that, literally, there are those pesky things called continents moving around on the Earth's surface. These dense lumps of rock bump out from the ellipsoid and their mass gravitationally attracts oceans, while valleys in the ocean floor have less mass and the oceans flow away, shallower.
And this is the real conundrum, because the very presence of a mountain (& continent on which it sits) changes the level of the sea: the gravitational attraction of land pulls more water nearby, raising the sea around it. So, to determine the height of a mountain above sea level, should we use the height the sea would be if the mountain weren't there at all? Or the height the sea would be if the mountain weren't there but its gravity were?
The people who worry about such things, called geodetic scientists or geodesists, decided that we should indeed define sea level using the strength of gravity, so they went about creating an incredibly detailed model of the Earth's gravitational field, called, creatively, the Earth Gravitational Model. It's incorporated into modern GPS receivers so they won't tell you you're 100m below sea level when you're in fact sitting on the beach in Sri Lanka which has weak gravity, and the model has allowed geodesists themselves to correctly predict the average level of the ocean to within a meter everywhere on Earth. Which is why we also use it to define what sea level would be underneath mountains... if they weren't there... but their gravity were.
The Minute Physics video introduces a few key concepts that make measuring sea level pretty complex:
- The Earth is not perfectly spherical, but an ellipsoid, due to its spin. This means that the Earth is “fatter” at the equator and slightly flattened at the poles, so that: “if you thought Earth was a sphere and defined sea level by standing on the sea ice at the North Pole, then the surface of the ocean at the equator would be 21km above sea level”.
- Differential density of the interior of the Earth so that “gravity is slightly stronger or weaker at different points around the globe, and the oceans tend to "puddle" nearer to the dense spots”.
- The mass of the continental plates creates a greater gravitational pull on ocean water than the ocean basin so that “mass gravitationally attracts oceans, while valleys in the ocean floor have less mass and the oceans flow away, shallower”.
These phenomena mean that there are peaks and valleys in the surface of the ocean – the ocean level is not uniform across the planet. These are important concepts to keep in mind as you read on.
We will also meet several other phenomena that drive sea level changes around the planet later in the module.
Sea Level Definitions
Sea Level DefinitionsIn a perfect, non-moving, homogeneous sphere, the elevation of the Earth's liquid shell would be distributed equally about the center of gravity, and sea levels would be the same everywhere. However, the Earth is a heterogeneous, oblate spheroid that rotates on an axis and experiences gravitational influences from other planets and the sun. These factors, together with geographic variations of continents and submerged terrains, climate systems, water volume, tectonics, etc., the surface of the ocean, and hence sea level, change on various time scales, ranging from minutes to millennia. Therefore, it is a challenge to determine the exact sea level of the Earth, but it is done.
As a result of these complications when referring to sea level, geoscientists have to be a little bit more specific when they discuss "sea level." Hence, there are a number of different definitions for "sea level" that need to be understood.
- Global Sea Level - the average height of the Earth's oceans combined (relative to the Earth's center). Influenced primarily by the factors that influence the volume of seawater, and size of ocean basins, etc. Often referred to as "Eustatic Sea Level"
- Local (or regional) Sea Level - the height of seawater relative to a fixed point on land that is used as a continuous reference. Influenced by meteorological factors, tidal range, ocean currents, rates of subsidence/uplift. Also referred to a "Relative Sea Level"
- Mean Sea Level (MSL) - the average height of seawater relative to a fixed datum established by a statistical average of water heights over a period of time. This is the most functional definition for sea level because it helps establish the elevation of all points on Earth (topographic elevation, and bathymetric elevation). In the U.S., MSL is often reported relative to the 1983-2001 NTDE (National Tidal Datum Epoch). Tidal datums need to be updated every couple of decades because sea level is not stable, and a new datum is likely to be announced.
Measuring Sea Level
Measuring Sea LevelMeasuring Sea Level Using Tide Gauges
Measuring sea level using gauges has a 200-year history. Today, the technology has changed, but the principles are the same as before, and some gauges provide very long and reliable records of water levels that can be used to observe sea level change trends. For example, the Fort Point tide gauge in San Francisco has more than 100 years of record that we will access later.
Sea level is often measured locally by tide gauges (and averaged over tidal cycles) that detect high and low points in a given period of time. Local tide gauges are especially useful for people who work or recreate in coastal areas and need to know what the water level ranges will be. These data points are also important for detecting water levels during storms and other events, as well as in the long-term investigation of relative water level change (rise or fall). Tide levels are also measured by floating buoys, which may also be used to detect tsunami waves. We will use tide gauge data to investigate sea level changes in different locations in the Module 4 Lab.
Measuring Sea Level Using Satellite Altimetry
With the advent of satellite altimetry in the 1960s, measurements of the sea surface took on a whole new level of accuracy. Between 1996 and 2006, altimetry took off with multiple satellites orbiting the Earth, providing much better coverage and data resolution. These measurements utilize multibeam methods that are very precise and can measure changes in elevation on the Earth's surface to great precision in the range of centimeters. These methods have shown that water bodies are not flat, but are incredibly dynamic and have high and low spots due to factors such as gravitational variability described above. Data such as ocean circulation, sea level rise, and wave heights can be measured. These measurements have provided insight into the links between the ocean and the atmosphere and how the connections drive climate. Satellite altimetry data collection began in earnest with the launch in 1992 of the TOPEX/Poseidon joint satellite mission between NASA and CNES, the French space agency. TOPEX/Poseidon proved data previously impossible to obtain. The next generation of satellites to collect these data was the NASA Jason satellites. They have been collecting data since Jason 1 was launched in 2001. Jason 2 was launched in 2008, while Jason 3 is presently collecting altimetry data. Each mission lasts about 5 years. Meanwhile, the European Space Agency’s Sentinel 3 satellite is collecting similar data, as shown below.

How Satellite Altimetry Works
As the figure illustrates, satellite altimetry measurements are obtained by a system of instruments carried on a satellite orbiting the Earth. The instruments include an altimeter and antenna, which measure sea surface height; a radiometer, which measures atmospheric disturbances, and a GPS system for precisely determining the satellite’s location. The altimeter transmits rapid (1700/second) pulses of microwave energy towards the Earth, which reflect back to the satellite. The average round-trip time of these pulses is accurately measured to determine the exact distance between the satellite and the sea surface (range). Water vapor measurements are also made as the level of water vapor affects the rate of transmission of the pulses, and a correction must be made to obtain the final range, which is accurate to 2 cm. This range must be referenced to the reference ellipsoid, which is an approximation of the Earth’s surface (the sphere flattened at the poles discussed above). The GPS receiver onboard and ground-based radio receivers track the satellite’s exact location. Using these data, sea surface height can be accurately measured. In addition, the ocean surface topography (the highs and lows depicted on the images) are obtained through calculations. This information is key to understanding the ocean’s surface as a dynamic and complex terrain and to determining changes over time.
The Jason satellites have revealed critically important information that was not available prior to the mid-1990s. As technology develops and more data are added to the database, our understanding of the changing ocean increases. Among the many scientific goals of the Jason and other altimetry satellite systems currently in use, are to extend the time series of ocean topography measurements begun in 1992 and to monitor the changes in global mean sea level and its relationship to global climate change. Since the mid-1990s, there has been explosive growth in ocean and climate studies, and multiple altimetry satellites have provided longer and more accurate measurements and have led to better spatial and temporal coverage and resolution. These accurate and detailed measurements, in turn, inform predictive science on sea level change.
In addition, important information on ocean circulation and the relationships between heat transport and other variables such as nutrients and salt content are obtained, as well as measurements of wave height. These data can be used in modeling that informs our understanding of tides, weather, and other dynamic phenomena at work on our planet. This technology continues to add knowledge and understanding of our ocean.
Recommended Reading
More detail on the Jason mission can be found at Jason-3 NASA Sea Level Change Portal.
The uneven nature of the surface of the ocean is expressed in the maps below. These images were compiled from satellite altimetry data to show anomalies in sea levels and temperature. These types of data are used in sea level predictions. The complex science involved in tracking sea levels is evolving rapidly as it answers a pressing need to provide accurate predictions in a rapidly changing world.

Sea Level Change: What are Anomalies and Why are They Used in Climate Change Analysis?
Sea Level Change: What are Anomalies and Why are They Used in Climate Change Analysis?If you are interested in understanding climate change, and you pay attention to in-depth news stories on the topic, you have no doubt frequently heard or read references to sea level and temperature anomalies. Anomaly data are being shared with greater regularity in the media these days, so it is important to understand what we mean by terms like sea surface temperature anomalies and sea surface height anomalies. An anomaly is an inconsistency or deviation from the norm, so images are created to show where change is taking place in the ocean in either a positive or negative trend when comparing to previous data. This is sometimes referred to as Sea Surface Height Deviation data or SSHD. Sea surface height anomalies are calculated using data from satellite altimeters. Many years’ worth of thousands of measurements provide a historical mean sea surface height, and the difference between the historical mean and the sea surface measurement for a particular date is called the sea surface height deviation. This can be calculated for points over the ocean surface, providing the data for the incredible maps we are seeing that show color-coded variations in sea surface across the globe and the changes in these measurements over time and space.
In the figure below, the data show the sea surface height differences compared to the 1961 – 1990 average over the entire planet. By comparing sea surface height measurements for a particular time period with the average measured over a previous time period, the changes can be shown spatially. In the figure below, the warm colors are sea surface heights that are significantly greater than past measurements, while the cool colors are those areas showing significantly lower elevation in the sea surface. This is how sea level rise trends can be identified in different parts of the globe using satellite data.
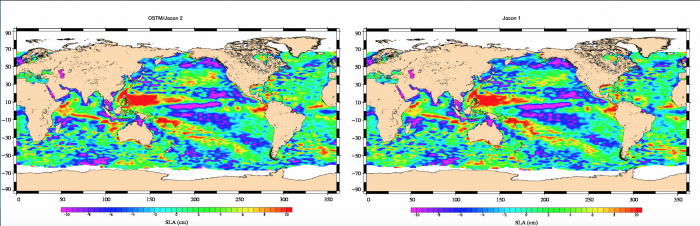
Revisit the NASA animation "22 Years of Sea Level Rise Measured from Space" from the Module 4 Overview that shows a 22-year period of sea level change using anomaly data. It is an excellent quick visualization of these phenomena.
Putting Sea Level Change in Context of the Earth’s History
Putting Sea Level Change in Context of the Earth’s HistoryThinking in the Long Term: Sea Level Change in Geologic Time
The instrumental data we explored above gives a small window of time in Earth’s recent history. To put the recent changes into context, we need to also consider long term changes in sea level.
Humans typically have difficulty thinking about time beyond a human lifespan. Geologists may be the exception to this rule, but you may belong in the category of those who find it difficult to visualize the long distant past and the long distant future and to think in terms of millions or billions of years (or even thousands of years). But understanding the changes to atmospheric and ocean changes in the geologic history of the Earth is important if we are to understand what is going on with our climate and sea levels today.
Thinking REALLY long term: Below is a graph plotting sea level over the past 540 million years - since the Cambrian era. For reference, zero on the Y-axis is where the current sea level is. We don’t need to go into a lot of detail, but you can easily appreciate that sea levels have been much higher than today for much of this period of the Earth's history. Scientists have correlated these fluctuations with changes in atmospheric carbon dioxide and ocean and atmospheric temperatures, using methods described in the next few pages.

We also must acknowledge here that some people may argue that sea levels have always fluctuated, so why is sea level rise today a big deal? Hopefully, we can shed some light on this question by looking at the changes in sea level through the history of the Earth, while considering the causes for these changes. But, perhaps the simple fact that seas are rising faster than ever before in human history is enough to facilitate action and adaptation. You also may ask, “What can we do about it?” This question will be addressed in later modules.
For a rapid and fun overview of the history of the Earth’s climate changes, watch the following fascinating monolog video. It summarizes most of the concepts to be discussed in more detail in the materials that follow.
Video: A History of Earth's Climate (11:19)
A History of Earth's Climate
We sometimes forget that this planet had a climate long before we showed up and started noticing it and then eventually affecting it, but let's be clear. The climate of this planet has always been pretty not so -- ice ages, completely iceless ages, volcanic winters, crazy methane, and ammonia atmospheres -- you name it. Our climate is influenced by a whole series of cycles, some incredibly long, some lasting only a few thousand years. These cycles have been churning along for hundreds of millions of years, and in most cases, they'll continue long after we are gone.
A look at the history of climate change on Earth can give us some much-needed perspective on our current climate dilemma because the surprising truth is what we're experiencing now is different than anything this planet has encountered before. So, let's take a stroll down Earth's climate history lane and see if we can find some answers to a question that's been bugging me a lot lately -- just how much hot water are we in, exactly?
Over the past 540 million years or so, Earth's environment has experienced a few large fluctuations between two very different states: greenhouse and icehouse climates. During greenhouse periods, there's a lot more liquid water on the planet and very little, if any, ice at the poles. During icehouse conditions, the global climate is cold enough to support large sheets of ice at both the poles. The most recent transition between these phases occurred about 55 million years ago when Earth reached thermal maximum, the peak of its last greenhouse state. Back then, there were turtles and palm trees at the poles, and the equator, we can assume, was pretty inhospitable. Then a long process of cooling started, ultimately resulting in an ice age that we are currently experiencing at this very moment. But, of course, Earth's climate doesn't just change for no reason, so what happened?
Well, one theory is that the Arctic Ocean was subject to a huge bloom of freshwater fern called Izola, which eventually died and sank to the seafloor, taking with it a massive load of carbon, which is, of course, coming from carbon dioxide, a greenhouse gas. So, with less carbon dioxide in the atmosphere, the earth began to cool until we landed in a great big ice house. That fern is a good example of how living things can influence the climate over long periods because, over time, there's been a big give-and-take between oxygen, which is manufactured by plants and consumed by animals, and carbon dioxide, which is spewed out by animals and used by plants. The relative abundance of these gases has a lot to do with what the climate is like at any given time. When there's a lot of greenhouse gases like carbon dioxide and methane in the atmosphere, they trap heat to create a greenhouse effect; when there's less CO2 and other greenhouse gases in the atmosphere, the planet cools down. But, of course, when it comes to the really long-term cycles, we have to talk about that all-important climate influencer which you could probably guess at: the Sun, which can affect climate in a bunch of ways.
For starters, the Sun hasn't always been as bright as it is now. When the earth was young, the Sun itself was just a baby -- less than a billion years old and about 70% dimmer than it is today. Nowadays, the Sun has some serious stability, but it still varies a bit. Fluctuations in the sun's energy export run in 11-year sunspot cycles. During periods of maximum solar activity, the Sun emits about 0.1% more energy than during Sun SPOT minimums, so not a lot. The sunspot cycle has at best a subtle impact on earth temperatures. But, on top of that, variations in the Earth's orbit and inclination toward the Sun also cause temperature fluctuations. Over millions of years, the shape of the Earth's orbit around the Sun varies from nearly circular to elliptical. This causes the distance from the earth to the Sun to vary during its orbit and with it the amount of solar energy we receive. This phenomenon is called orbital eccentricity, and it occurs in cycles of about a hundred thousand years. Right now, scientists think we're probably somewhere near the minimum of this cycle with the distance from the Sun only changing slightly in a single orbit enough to create about a six percent difference in solar radiation throughout our orbit. But, when the earth is at the peak of this cycle, the amount of the sun's energy we receive can change as much as 30 percent in a year, which means crazy big fluctuations in climate. While orbit changes, so does the tilt of the Earth's axis as it spins through space. The earth wobbles a bit changing its angle with respect to the Sun and cycles that run about 42,000 years. So, right at this moment, the earth tilts at a twenty-three point four-degree angle, but, over the eons, that can change from as small as 22 point one degree to as much as 24 point five degrees. The steeper the angle, the more the poles are directed toward the Sun, which makes for far greater extremes as the seasons change, with the poles being way warmer in the summer and much, much colder in the winter.
A lot of the changes in prehistoric climate seem to coincide with these cycles, particularly the changes in Earth's orbit, and while nothing is completely certain at this point, many experts think that these orbital cycles have had huge influences on the cycles of climate change that we find in the record of recent geologic history. So, while these are the most general climate influencers that we know about today, it wasn't like this at first. Between 4.5 and 3.8 billion years ago, when the earth was just a baby, there was no climate to speak of. The surface was just molten lava, and it was real hot up in here. After the atmosphere eventually cooled enough for it to rain, oceans formed and land masses appeared. At that point the Sun was way cooler, but the Earth's atmosphere, which consisted mostly of ammonia and the greenhouse gas methane, kept the planet nice and toasty. Between 2.5 billion and 500 million years ago, oxygen levels rose dramatically. much of the life that had managed to take hold by then was anaerobic or lived without oxygen, but thanks to the evolution and hard work of kajillions of photosynthetic algae called cyanobacteria, which started pumping out oxygen like nobody's business, the composition of the atmosphere changed to the point where a whole lot of anaerobic life couldn't deal. This oxygen boom resulted in the great oxygen catastrophe, one of the most significant extinction events in Earth's history. Well, it was a catastrophe for the anaerobic bacteria in the archaea, but a nice bit of luck for us, who wouldn't happen along for another couple billion years or so. I guess it's all about perspective.
There was probably a big cooling around this time too, partly because of the rise in oxygen and most of the methane being removed from the atmosphere at the peak of this cooling period. It's thought that the average temperatures at the equator were about what they are in modern-day Antarctica. Some scientists think that the entire globe essentially froze, resulting in what they call a snowball earth. Between 500 and 250 million years ago, the planet's core cooled down to the temperature it is today, so volcanic eruptions became rare. It's during this time that we see the Cambrian explosion, where multicellular life evolved like crazy in the oceans. Photosynthetic organisms on land turned out oxygen, but there weren't yet enough aerobic organisms to breathe it in and pump the CO2 back out, so earth stayed pretty chilly.
250 to 65 million years ago, all that changed. By then, there were lots of critters on land exhaling all that CO2. Pangaea, the huge honkin supercontinent, was also starting to break up, so more land was coming into contact with the oceans' increasing humidity and helping drive the climate into a warming period. This culminated at a time when temperatures were about 10 degrees Celsius higher than they are today and pretty uniform all over the globe. Then another climate change driver intervened.
The reigning theory is that 65 million years ago, a 200 kilometer-wide asteroid smashed into what is now Mexico; sprang up nine hundred quadrillion kilograms of flaming rock into the atmosphere. This probably caused an impact winter that was likely enough to kill off all the large dinosaurs and allow mammals to kind of take over. Just ten million years later, we began the run-up to that thermal maximum I mentioned earlier. About 55 million years ago, the planet experienced sudden warming, which sent global temperatures up five to eight degrees Celsius in just 20,000 years. It didn't last very long, and what exactly caused it is a matter of debate, but the geological record shows that there was a huge infusion of carbon into the environment.
One of the most popular hypotheses is that it came from methane being released from sudden melting of methane containing ice under the seafloor and at the poles something happened, say undersea volcanic activity or a peak and one of the solar cycles we talked about, to melt this methane ice. And once it was unleashed into the atmosphere, we were all in greenhouse city. Because of this little escapade, the earth went completely ice-free. The opposite of snowball earth, sometimes called greenhouse earth or hothouse earth, and in addition to creating an ideal climate for warm-blooded creatures like us mammals, this also allowed for the proliferation of more plant life, including that huge bloom of Izola freshwater fern, so levels of greenhouse gases started to tank yet again.
But when the next cooling trend began, this time it was different. About 35 million years ago, glaciers started to form in Antarctica for the first time, in part because there was no Antarctica before. See, while all the cycles that we've been talking about kept churning, the continents were also sliding around on the Earth's surface until land masses appeared at the South Pole that allowed glaciation to take place. Meanwhile, other formations that didn't exist before, like the Himalayas and the Atlantic Ocean, had taken shape, which helped to amplify and circulate the cooling and thus began a major Ice House climate. When people talk about the ice age, this is usually what they mean, and because there's still permanent ice to be found, we're technically still in it.
But this cooling hasn't been consistent within this ice age. There have been small warming events interspersed with even cooler events, where average temperatures were about five degrees Celsius cooler than today. In fact, in the past 2.5 million years there have probably been around 25 glaciations or cold periods, sometimes called little ice ages, interspersed with interglacials which are warmer periods. You might notice that that comes out to about one climate swing every 100,000 years, which coincides with that orbital pattern we talked about and that brings us up to now, or, you know, within about 12,000 years of now, which is yesterday in geologic time.
So, you've heard of the hockey stick, right? This is the graph depicting the average global temperatures over the last two thousand years or so based on what can be gathered from historical data -- tree rings, corals and ice cores -- you'll notice that average temperatures increased dramatically during the 20th century, which is when we started relying heavily on fossil fuels to power our everything. This graph came out in 1999 using data collected by Penn State climate scientist Michael Mann, who has taken an incredible amount of heat for this research over the past 15 years.
But new research reconstructs global temperatures further back than Mann did -- eleven thousand three hundred years back, using fossilized plankton dug up by oceanographers from 70 sites worldwide. On one hand, it shows that temperatures for about 20 percent of this historical period were actually higher than they are today, but it also shows that right now temperatures are increasing faster than they ever have. In the past 100 years, temperatures have risen so dramatically that they have canceled out all of the cooling that took place over the past 6,000 years. And probably more important, the study shows that in addition to being in the middle of a long-term ice age, we should now be entering the bottom of a several-thousand-year-long cooling period even if it were just natural factors, but it's not.
So, this new evidence pretty much corroborates what's already known. That we're making a mess. But one thing's for sure, our planet's climate has dealt with a lot and it'll probably survive humans. But what the cost will be for us? We're going to need some more data on that.
Thanks for watching this episode of SciShow. If you have any questions, comments, or suggestions for us, you can find us on Facebook and Twitter or down in the comments, and if you want to keep getting smarter with us here at SciShow, you can go to youtube.com/scishow and subscribe.
Measuring Sea Level Changes in Earth’s Past
Measuring Sea Level Changes in Earth’s PastSea levels change over different spatial and temporal scales. The images produced by altimetry illustrate well the spatial variations, and also provide important data on relatively recent temporal changes. We can examine sea level changes over the short term and long term. Examination of tide gauge data gives us a detailed look at sea level change over a short period of history. These are valuable, but do not show us the whole picture.
If we want to look back at the planet’s ocean levels before people began making measurements, we must use proxy, or indirect measurement. This is the basis of the science of paleoclimatology. Before looking at more information on paleoclimate, we need to understand how these data are obtained.
Paleoclimatology
How do we know what the climate was like 500 million years ago? To reconstruct and understand the fluctuations in climate that have taken place on Earth, scientists use proxy, or indirect data, including data obtained in ice cores, coral, tree rings, and ocean and lake sediment cores.
Paleoclimatologists use various forms of environmental evidence to understand the Earth’s past climate. Earth’s past climate conditions are preserved in tree rings, skeletons of tropical coral reefs, sediment layers in lakes and the ocean, and in the ice of glaciers and ice caps. Using these records, paleoclimatologists can reconstruct climate conditions going back hundreds of millions of years to create graphs such as the one in Figure 4.4 on the previous page.
It was the examination and analysis of ice cores and their trapped molecular contents that revealed the connection between Earth’s atmospheric CO2 and temperature. In order to unlock the information contained in the ice, scientists collect cores and analyze them in slices representing small increments of time, using very precise methods. This way patterns that identify changes in the atmosphere's composition and temperature can be revealed.
For example, the ratio of oxygen isotopes present in the cores ("light" oxygen-16 to "heavy" oxygen-18) can tell the story of global temperatures when the ice formed. Colder temperatures are needed to produce precipitation when water vapor in the atmosphere contains higher levels of oxygen 16.
The paleorecord shows that the Earth’s climate is always changing and that in the distant past (such as the Cretaceous – think end of the dinosaurs’ reign - from 145.5 to 65.5 million years ago), the climate on Earth was much warmer than today and sea levels would have been significantly higher. See Figure 4.4 on the previous page.
The paleoclimate record also shows that in relatively recent geologic time (within the last 2 million years), the Earth underwent a series of glacial periods, which locked much of the Earth’s water in ice which covered the Northern Hemisphere landmasses. This caused the sea level to drop much lower than today (more than 400 ft. below current levels). We are currently in an “interglacial” period during which the Earth has warmed, and the sea level has risen.
Paleoclimate records can also help to shed light on the more recent changes and provide evidence for the anthropomorphic effects on climate and sea level, correlating an unprecedented rapid rise in sea level with increased carbon dioxide in the atmosphere. More on that later.
Required Reading
Please read the article on how scientists use ice cores to reconstruct past climates, "Climate at the core: how scientists study ice cores to reveal Earth’s climate history".
Sea Level in the Past 200,000 Years
Sea Level in the Past 200,000 YearsLet’s look at how sea levels have changed over the past 200,000 years of Earth’s history, based on evidence provided by paleoclimatology.
Probably, the factor that influences sea levels on the planet more than any other is the proportion of the Earth’s water that is in the form of ice at any point in time.
The figure below illustrates this very well. Take a look at the curve on the graph, obtained by analyzing oxygen isotopes in ice cores. It represents the fluctuations in sea level from 200,000 years ago to the present (going from right to left on the x-axis). Approximately 125,000 years ago, the sea level was approximately 8 meters higher than it is today. This was during the Sangamonian Interglacial, the last time the north polar ice cap completely melted. After this peak in sea level, ice returned to the planet. And the Wisconsinan Glacial period followed between 80,000 and 20,000 years ago when a glacial maximum, and sea level low stand (more than 130 m lower than today) took place. This is what most people mean when they refer to the "ice age". Glaciers covered much of North America. Following the glacial maximum, we see sea levels rising rapidly - the curve is about as steep as the one leading up to the Sangamonian Interglacial. It began to level off about 5,000 years ago, leading to fairly slow sea level rise in recent geologic time and the sea level human society has been accustomed to.


The figure above (Hearty) illustrates the CO2 fluctuations over 400,000 years and the rapid rise to the recently reached 400 ppm level (Keeling curve). These levels are unprecedented during the past 800,000 years. During the Sangamonian interglacial period mentioned above, at about 130,000 years ago, levels reached 300 ppm, but sea level was much higher than today. A CO2 level of 400 ppm occurred in the Pliocene 3 million years ago, when sea level is estimated to have been 10 to 40 m higher than it is now. The concern is that, based on evidence provided by paleoclimate studies such as those illustrated in the two figures above, this rapid increase in CO2 levels can be correlated with the melting of ice sheets leading to an ice-free planet. This melting is currently being watched closely. If all of Greenland’s ice were to melt, an increase of 5-7 m in sea level would be experienced. This is predicted to lead (as well as flooding of all coastal cities on the globe) to the disruption of the circulation of ocean currents (due to the rapid addition of huge volumes of freshwater to the ocean) that currently dictate the climate patterns as we know them in Earth. Of course, the implications of this scenario are huge. Stay tuned, and pay attention when you hear of news related to this phenomenon.
We will return to the ideas presented in these graphs after considering the complex cause and effect mechanisms that control sea levels on the planet.
Learning Check Point
Learning Check PointThere are several takeaways from studying the two graphs on the previous page. Look closely at the data presented and answer the questions below.
Learning Check Point
Causes of Sea Level Fluctuations Through Time
Causes of Sea Level Fluctuations Through TimeWhat were the causes of the changes in sea levels on the Earth over time? There are multiple causes that can be divided into two groups: intrinsic, or internal drivers, originating within the Earth’s system, and extrinsic drivers, which originate outside the Earth’s system. Some of these operate over the timeframe of the Earth’s history, and others operate over shorter timeframes. Some influences are global in scale, while others are more regional or localized. The following pages are part of a partial list of these influences. These drivers are also interconnected, with one influencing another in many cases.
Intrinsic Causes of Sea Level Change
Intrinsic Causes of Sea Level ChangeThe Earth is a dynamic, self-regulating system, and forever changing. The changes that take place in each of the spheres of the Earth impact the other, connected spheres. There are complex feedback mechanisms that work to maintain the balanced functions of the planet. As we explore the topic of sea level change, the importance of these feedback mechanisms become clear. It is hard to isolate a single cause of sea level rise or fall, as all are connected and may be occurring simultaneously. It is worth remembering some principles you may have learned in your pre-college days, such as the water cycle, rock cycle, plate tectonics, and how heating and cooling affect matter.
Global or eustatic sea level can oscillate due to changes in the volume of water present within the ocean basins relative to storage of that water on land. Short-term sea level change can be driven by sudden tectonic events (e.g., earthquake-induced subsidence/uplift), and tidal processes, but sea level change on the scale of decades to 1000s of years is primarily driven by changes in the Earth's climate system that can be influenced by both intrinsic and extrinsic phenomena.
The Water Cycle
The Water CycleAs you probably know, the water on the planet is constantly being cycled through various states, such as water vapor in the atmosphere, liquid water in oceans, rivers, and groundwater, and ice in ice sheets and glaciers. This cycling happens at different rates, from rapidly (measured in days) to very slowly (measured in thousands of years or more).
Whether due to climate factors, or plate tectonic factors, water evaporated from the oceans can become locked up on land and prevented from cycling back to the ocean. The USGS estimates that some 8,500,000 cubic miles of water is trapped on land either as ice or as freshwater. When and if this water makes its way back to the ocean (and if it is not replaced on land), sea levels can rise significantly. The Greenland Ice sheet, if melted, is estimated by Byrd Polar Research Center and other scientists to produce a rise of between 6 and 7.4 meters to global sea level if it is not restored on land.
Rift lakes or large intra-continental seaways can trap liquid water that is temporarily removed from the global ocean (an excellent example is Lake Bonneville - the ancestral Great Salt Lake of the western U.S.). If precipitation of ocean-derived water is high on land, and this water is not able to return to the ocean, ocean water levels can drop over time.

Continental aquifers will often hold volumes of water in the subsurface. As these aquifers are de-watered (pumped), the water is released back into the hydrologic system and can be returned to the ocean. Some areas in large desert regions (e.g., in Arizona, Nevada, California, etc.) have withdrawn substantial amounts of water from aquifers. This water is not replaced, ground subsidence occurs, and the aquifer becomes compacted. The withdrawn water is eventually lost to evaporation and ends up back in the ocean.
Glaciers also trap and hold water in solid form. When ocean-derived moisture freezes and is held on land from year to year, they stockpile large volumes of water, and ocean levels can drop.

Two main types of glaciers include alpine and continental glaciers.
- Continental glaciers or ice sheets similar to those on Greenland, Iceland, or Antarctica have been more widespread at times in Earth's history and trapped large volumes of water on land, so much so that continental areas subsided under the great thicknesses of ice built on top of them.
- Large numbers of alpine glaciers at high altitudes (e.g., Andes, Alps, Himalaya, Cascades, Rockies, etc.) collectively contain significant volumes of water that can also be released back to the global ocean if melted.
Isostatic Changes – Glacial Isostatic Adjustment
Isostatic Changes – Glacial Isostatic AdjustmentTo understand isostatic changes, you need to consider the fact that huge amounts of water can be stored as ice during colder periods in Earth’s history (many times more than today). When the planet warms and ice melts, this water is returned to the ocean basins (causing a rise in sea level). When ice sheets and glaciers covered the land during the ice ages of the Pleistocene, the weight of the ice depressed the elevation of the land. Over the 20,000 years since the last glacial maximum, the land masses, relieved of their burden of ice, have gradually rebounded. This rebound is called Glacial Isostatic Adjustment or GIA. The level of the land relative to the sea level increases. This can cause a regional sea level change effect and is still impacting parts of Alaska and other northern coasts. These are the emergent coasts we met in Module 2.
This short, but silent video animation illustrates how changes in sea and land level take place in response to the onset and departure of glacial conditions, and the melting of polar ice as the planet warms. It also documents the erosion of sediment from the land and deposition in the ocean basin at each sea level stand. This erosion leaves a signature of each sea level (the erosional notch shown), which is evidence of these changes.
Video: From Glaciation to Global Warming - A Story of Sea Level Change (1:40)
From Glaciation to Global Warming - A Story of Sea Level Change
Sea level changes over time. Video shows how water level changes compare to land.
Before the last ice age (more than 30,000 years ago): erosion notch one forms.
During the last ice age: sea level drops, ice forms on land. The Ice is 1 mile thick and erosion notch 2 forms below notch 1 and a new sediment layer forms.
The weight of the ice pushes down on the land: forming erosion notch 3 between notch 1 and 2 and a new sediment layer forms.
As the ice melts: the sea level rises forming erosion notch 4 above notch 1 and a new sediment layer forms.
With no ice to hold it down, the land begins to rise again (rebound)…and it’s still rising very slowly: Erosion notch 5 forms between notch 1 and 4 and a new sediment layer forms.
Polar ice caps melt: sea level rises as a result of melting ice. Erosion notch six forms above all other notches. New sediment layer forms.
Albedo Feedback Mechanism
Albedo is a measure of the reflectivity of the Earth's surface. Ice-albedo feedback is a strong positive feedback in the climate system. Warmer temperatures melt persistent ice masses in high elevations and upper latitudes. Ice reflects some of the solar energy back to space because it is highly reflective. If an equivalent area of ice is replaced by water or land, the lower albedo value reflects less and absorbs more energy, resulting in a warmer Earth. This effect is currently taking place - for example, as the Greenland ice sheet melts there is less bright white, reflective ice and more, darker less reflective water and land surfaces. This decreases the albedo effect and increases warming. Conversely, cooling tends to increase ice cover and hence the albedo, reducing the amount of solar energy absorbed and leading to more cooling.
Thermosteric Sea Level Change - Thermal Expansion and Sea Level Rise
Thermosteric Sea Level Change - Thermal Expansion and Sea Level RiseAnother substantial mechanism for changing sea level is related to thermal expansion/contraction properties of water molecules themselves. In our high school science classes, we all learned that as the temperature of different substances increases, the molecules within those substances become more "excited". These excited molecules that bump into each other more frequently take up more space, so the warmer substance will expand in volume and will have a lower density. The behavior of water molecules follows this same pattern. When liquid saltwater warms up, its density (mass per unit volume) decreases as the volume increases. As temperatures of the ocean increases, the volume of seawater increases and can produce a higher sea level. Conversely, as seawater cools down, the density increases as the volume decreases. This produces lower sea levels.

Geoscientists and physical oceanographers are developing mathematical models to explain and predict the impact of even small changes in ocean temperature on sea level. In the image above, you will notice that different ocean layers contribute to rise at different rates. Some scientists believe that the deep ocean layers, as thick and deep as they are, will volumetrically produce even higher sea levels if they warm in the absence of polar glaciers. Better empirical modeling will continue to be refined so that we will have a better sense of the impact that this phenomenon has on overall sea level change.
Seemingly small temperature changes (even as small as 0.1 degrees Celsius), when extrapolated over the entire globe, can produce a significant sea level rise effect when considered over time. On an annual basis, the impact might not seem like a lot (just a few mm./yr. on average), but over a decade or two, this adds up to a substantial change. As such, most scientists believe that recent sea level change may be strongly tied to increased warming of the atmosphere, which in turn warms the ocean. Given this fact, many scientists are alarmed by the additive impact of melting of glaciers, which ultimately act as the cooling mechanism for the deep sea. If glaciers are not present, the ocean's ability to overturn will be impaired and, it is argued, this can cause more rapid hyper-warming of the ocean's waters leading to even higher sea levels. This is an example of a positive feedback mechanism.
Plate Tectonics and Sea Level Change
Plate Tectonics and Sea Level ChangeToday, the Earth’s ocean is made up of the large Pacific, Atlantic, Indian, and Arctic Oceans. These bodies of water were not always in their current shape and configuration. As a result, you can imagine the large-scale changes in sea level that would have accompanied their assembly since the last super-continent (Pangea) began to break up some 250 million years ago. These changes would have been very slow but significant, operating on time scales beyond those experienced by human beings.
Long-Term Sea Level Change (hundreds of thousands to millions of years) is influenced by factors that modify the size and shape of ocean basins. Global or eustatic sea level can change as the result of changes in the number, size, and shape of ocean basins. Throughout Earth's history, the global ocean has been modified by plate tectonics. Often, large continents assembled from smaller ones produced more expansive oceans between them. These expansive ocean bodies were subsequently dissected when super-continents rifted and formed smaller oceans out of the formerly vast oceans. For visualization purposes, please watch the quick paleogeographic animation below.
Video: Earth 100 Million Years From Now (3:18) No Audio.
Earth 100 Million Years From Now
100 million years from now.
Earth. Its landmasses were not always what they are today. [The earth spins, showing the various plates: the South American Plate, the African Plate, etc.]
Continents. Formed as Earth’s crustal plates shifted and collided over long periods of time.
This is how today’s continent are though to have evolved… and will evolve in the future. [A flattened map of the earth transitions through the eras.]
600 million years ago – Pre-Cambrian Era
540 million years ago – Cambrian Era
470 million years ago – Ordovician Era
400 million years ago – Devonian Era
280 million years ago – Permian Era
240 million years ago – Triassic Era
200 million years ago – Jurassic Era
120 million years ago – Cretaceous Era
50 million years ago – Eocene Era
20 million years ago – Miocene Era
1.8 million years ago – Pleistocene Era
Earth Today
100 million years from now [The map transitions through and focuses on the changes in each of the following land masses: The Americas, Africa, Eurasia, Asia.]
Paleographic views of Earth’s history provided by Ron Blakey, Professor of Geology Northern Arizona University. www2.nau.edu/rcb7
The tectonic processes at work on the Earth influence the size of ocean basins and, therefore, sea level in many, complex ways. The following list gives an idea of some of these processes and their interactions and feedback mechanisms:
- rifting of tectonic plates at divergent plate boundaries;
- assembly of microcontinents, volcanic terrains, continents — especially supercontinents like Rodinia, Pangea, etc.;
- subduction of tectonic plates at ocean trenches at convergent plate boundaries;
- eruption and formation of large igneous provinces that originate from massive extrusions of lava, oceanic plateaus, hotspot volcanic island chains, etc.;
- high rates of volcanism on the seafloor volumetrically displace water out of the ocean basin, producing higher sea levels (called transgression of sea level);
- low rates of volcanism allow water to return to the ocean basin and sea levels drop (called regression of sea level);
- when rocks cool from a molten state, they contract in volume; this allows subsidence to occur, especially along the mid-ocean ridges, and sea levels fall;
- when rates of volcanism are low, rocks tend to cool faster and sea levels drop as subsidence occurs.
- conversely, when rates of volcanism are high, it takes longer for the rocks to cool, and sea level remains higher for longer periods of time after the rate of volcanism subsides.
For more information
Take a look at There Are Four Main Causes of Sea Level Rise. Here is more explanation of this concept.
Atmospheric Changes
Atmospheric ChangesWe have already considered the influence of changes in the composition of the Earth’s atmosphere, specifically the carbon dioxide and oxygen levels, as drivers for fluctuations in atmospheric temperatures, which can, in turn, influence the temperature and level of the ocean. The anthropogenically driven increase in CO2 and other greenhouse gases in the atmosphere explains the current rapid warming of the Earth’s atmosphere (more on this later). The concept of the greenhouse effect and “greenhouse gases” has been widely discussed, but bears a reminder here, so we can connect these changes with those that have taken place through the history of the planet. Of course, there are many other drivers for changes in the chemical composition of the atmosphere, including rates of volcanic activity.
Extrinsic Drivers of Sea Level Change
Extrinsic Drivers of Sea Level ChangeEarth Orbit, Solar Insolation Variability & Sea Level Change
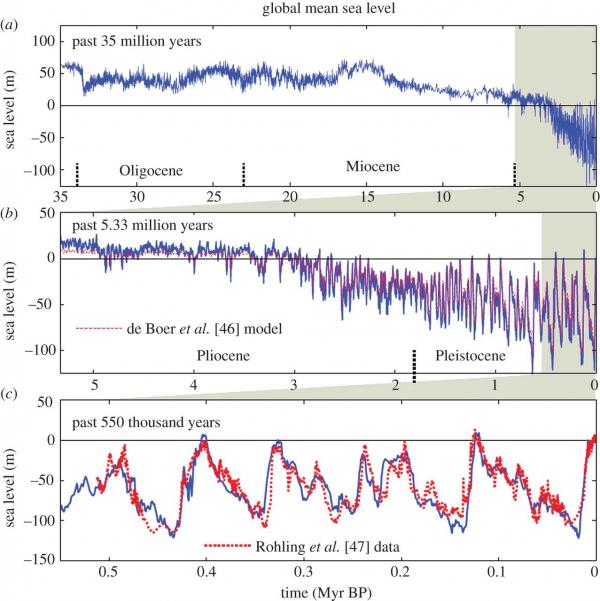
Take look at the graphs showing changes in sea level through the history of the Earth. The top figure covers 35 million years, the middle one covers a little more than 5 million years, and the bottom one zooms in to the past 500,000 years. What do you notice? Is there a regularity in the pattern of sea level ups and downs?
Through Earth’s history, there appears to have been a regular spacing of glacial maximum events, at roughly 120 thousand years (ky). When variations in Earth's orbit produce repetitive changes in climate and sea level, the observed cycles are often referred to as Milankovitch Cycles. Many sedimentary rock sequences have been shown to have stacking patterns that reflect these time scales, as do ice core data.

Milankovitch Cycles
Mathematician Milutin Milankovitch proposed an explanation for the changes in the way the Earth orbits the sun. These changes define the sequence of ice ages and warm periods.
- The Earth’s orbit changes from being nearly circular to slightly elliptical (eccentricity). This cycle is affected by other planets in the solar system and has a period of around 100,000 years.
- The angle of tilt of the Earth’s axis changes from 22.1° to 24.5° (obliquity). This cycle has a period of 41,000 years.
- The direction of the tilt of the axis changes (precession) on a cycle of 26,000 years.
- These changes influence the length of the seasons and the amount of solar radiation received by the Earth.
Optional Video
Please watch Milankovitch Cycles in 5 Minutes (5:00), if you are not already familiar.
[Music]
The Sun is the Earth's main energy source. In fact, it provides 99.96 percent of all the energy that drives the Earth's climate. Some of the energy produced by nuclear fusion in the sun's interior will eventually strike the top of the Earth's atmosphere. The amount of energy that does strike the atmosphere depends on two main factors: the total amount of energy produced and transmitted by the Sun, and the orbital cycles of the Earth with respect to the Sun. The energy transmitted by the Sun is in a constant state of flux depending on solar activities such as sunspots, solar flares, coronal loops, and coronal mass ejections. The relationship between the Earth's orbital cycles and climate change was proposed by Milutin Milankovitch.
Milankovitch was a Serbian engineer, and during the 1930s, he proposed that the changes in the intensity of solar irradiation received on the Earth were affected by three fundamental factors: precession, obliquity, and eccentricity. These factors are now collectively known as the Milankovitch cycles. The Milankovitch cycles are widely accepted by climate change scientists and are well documented by, for example, the IPCC. A more detailed description of the cycles is available by clicking on the tab above, but the remainder of this video will provide an excellent overview.
The Earth rotates on its axis every 24 hours. Around once in 27 days, the Sun also rotates on its axis. Its average distance from the Earth is approximately 150 million kilometers (93 million miles). It is an average distance because this Earth's orbit around the Sun is not fixed. Its orbit cycles from being almost a circle to that of an ellipse to almost a circle again. The cycle takes place over a period of around 100,000 years. The rotation of the Earth is at an angle to the vertical, and this angle changes over time. It moves from 22.1 degrees to 24.5 degrees and back again. This is over a time span of approximately 41,000 years. The Earth also goes through a cyclic wobble. It moves from its current position of the north pointing to the star Polaris to where the North points to the star Vega and returns to pointing at Polaris. The full cycle takes place between 19 to 26 thousand years. The combined effects caused the seasons to gradually cycle relative to the perihelion and aphelion, this over a time span of about 21 thousand years.
[Music]
How do these variations in Earth’s orbit affect climate and sea level? Collectively, variations in Earth's orbit (eccentricity, obliquity, and precession) can either reinforce signatures of cooling or warming, or they can work to counteract each other and produce less severe or ameliorated climate change. When the multiple variables reinforce each other, the amount of climate change and, as a result, sea level change can be significant.
Sea Level in the Past 20,000 Years
Sea Level in the Past 20,000 YearsIn order for us to connect sea level with our discussion on intrinsic and extrinsic controls and feedback mechanisms, etc., let's see another dataset that links climate history and sea level. The image below shows warm and cool periods for the last 900,000 years and has an expanded inset for the last 140,000 years.

In the inset, you will notice the long-term decline in sea levels from the last interglacial warm period, which occurred about 130 ky before the present. It is labeled stage 5e on the graphic. Sea levels declined to the lowest levels during stage 2 that occurred between 13,000 and 20,000 years ago. During this time, despite some minor short-term rise/fall events, sea levels fell from near modern sea levels to some 120 meters below present. The long-term rate of sea level fall calculation shows that sea levels fell 120 meters in approximately 100,000 years, or 0.12 m / 100 years. That is, sea levels fell by some 12 cm per 100 years, or through a simple unit conversion, the rate can be stated as 1.2 mm/year.
In the same graph, sea level rise appears to have been occurring at least for the last 18,000 years. Modern sea levels (relatively similar to highs 120,000 years ago) were achieved quite rapidly, relative to the rate of fall. Based on these numbers, 120 meters of sea level rise appears to have occurred in 18,000 years. This represents a rate of almost 6 mm/year for a rise rate.
This asymmetrical pattern of sea level rise/fall rates is repeated again and again for many of the earlier glacial-interglacial episodes. Thus, there is evidence that shows sea level fall (and building of ice sheets) is a long, drawn-out process where cooling and various positive feedback loops help to reinforce the cooling. The end result is an extended period of sea level fall (i.e., iteratively more albedo, and less and less insolation delivery, more cooling, etc.).
Conversely, once the factors that initiate warming begin to turn on, warming and associated sea level rise apparently can proceed at a much faster rate until a maximum sea level is reached, and factors that influence cooling initiate and bring sea levels down again.
Prior to the last few centuries, the system was controlled primarily by extrinsic and intrinsic variables. However, human impacts on landscapes, oceans, and climate (i.e., deforestation, greenhouse gas concentrations, nutrient runoff, aerosol pollution, and cloud development, etc.) have added variables that weren't present at any previous time (more on this later).
Now, let's look at a couple of more composite analyses that help us understand signals and signatures from the last few 1000 years. In the graphic below, a number of different datasets from Australia, South America, the Caribbean, the western Pacific, and other areas have been plotted to show sea level positions. Most of these datasets are derived from investigations of coral reefs that have drowned as sea level has risen.

From what is observed in the figure above, sea level rise rates appear to have been relatively low during the initiation of rise (i.e., from 20,000 to approximately 15,000 years ago), at which point a significant increase in sea level rise rates (Meltwater Pulse 1A), and several others ensued. Three rapid increases in rise rates ("pulses") are noted here so that the majority of the 100 meters of sea level rise occurred from 14,000 to approximately 8,000 years ago, or 90 meters in roughly 6,000 years. This yields a sea level rise rate of 0.015 meters per year or 1.5 centimeters per year or 15 mm per year.
This is an incredibly fast rate that is tied to the decay of large ice sheets, including both the Eurasian and Laurentide Ice Sheets. The Laurentide Ice Sheet on North America had mostly retreated from North America by 6,000 years ago, leaving behind only the alpine ice sheets. Check out the video below showing the retreat.
Video: Laurentide Ice Sheet (00:32) No audio.
Laurentide Ice Sheet
The Deglaciation of North America 21,400-1,000 years ago.
After Arthur S. Dyke, “An Outline of North American Deglaciation…” 2004. With additions from, “The Last Great Ice Sheets”, Denton & Huges, ed., 1981. Coastlines estimated using Barbados sea level curve after Bard et al., 1990. Great Basin Lakes from Curry, Atwood, and Mabey, “Map 73: Major Levels… Lake Bonneville” 1984.
[Animated map of North America shows the Laurentide Ice Sheet dramatically receding toward the northeast from 21,400 years ago, to 1,000 years ago.]
For more information
Check out Vignettes: Key Concepts in Geomorphology, for more info on Laurentide Ice sheet decay.
As these large ice sheets and their albedo potential were removed, the rate of absorbance of incoming solar radiation was likely to have contributed to further warming and increased temperatures of seawater. Thus, geoscientists are increasingly confident in the two primary factors that have contributed to the sea level rise rate prior to human influences. The primary cause is thought to be tied to thermal expansion of seawater, as we discussed previously. The second is the role of melting glaciers and increased volumes of land-ice being moved to the oceans.
Sea Level Change in the Holocene Epoch
Sea Level Change in the Holocene EpochIn the figure on the previous page, we observe that approximately 6,000 years ago, the rate of sea level rise slowed significantly. This left significant ice sheets on Greenland, Iceland, and Antarctica. Why didn't the rate of ice-sheet decay continue? That's a very good question. This time frame happens to coincide with decreasing incoming solar radiation values from Milankovitch forcing models.
Although it isn't yet clear, this relationship is a hypothesis that is being tested. Did the slowdown in the rate of sea level rise to a near still stand correlate to decreasing insolation in the Northern Hemisphere? Despite a level of greenhouse gas concentrations of ~265 parts per million, the rate of rise could not be sustained because the vast ice sheets were already melted and decreased insolation values per unit area in the Northern Hemisphere may have contributed to the development of stability in sea levels. In other words, greenhouse effects may have acted to continue to keep sea levels rising despite decreased insolation. Thus, sea levels achieved a much more stable condition.
For the period from roughly 6,000 years ago to the last century, the amount of rise is estimated to have been just a few meters. Hence, rise rates fell almost to zero (~0.7 mm/year), a far cry from the 15 mm/year rise rates estimated for the immediately preceding interval.
Under these relatively stable conditions, many of the coastal features observed today developed and expanded. Coral reefs that were able to keep up with earlier rates of sea level rise began to expand laterally, building large reef systems including the Great Barrier Reef and others in the Pacific Ocean, and the barrier reef systems common off south Florida and in the Caribbean. Likewise, deltas were built from sediments deposited by large river systems around the globe, including the Mississippi River delta. Numerous barrier islands were formed along the eastern seaboard and the Gulf of Mexico. They migrated slowly landward, up the continental shelf as sea level rose.

Recent Sea Level Rise and Anthropomorphic Impacts
Recent Sea Level Rise and Anthropomorphic ImpactsIn the human timeline, the change from higher rates of sea level to lower rates of sea level rise coincided with the onset of the Neolithic interval ~4,000 years ago. Although human beings began to influence Earth in interesting ways within the last few millennia, (think Roman Empire, which began to expand about 2,000 years ago), anthropogenic impacts on sea levels likely occurred more recently. Feedback loops often have significant lag times.
As human populations grew and the demand for freshwater for agriculture and other industries increased, and as forests were deforested, significant volumes of water re-entered the ocean-climate system and contribute to sea level rise. Some calculations suggest that perhaps as much as 5 percent of the sea level rise observed in the last few decades may be from these sources.
Recommended Reading
This National Geographic News article "Groundwater Depletion Accelerates Sea-Level Rise" is related to this topic.
In 2016, the Earth’s atmospheric carbon dioxide concentration reached the 400 parts per million threshold level. This was highly significant to climate scientists and all people concerned about the effects of climate change on the planet. The amount of CO2 in the atmosphere has increased from about 280 ppm since 1750 AD at the beginning of the Industrial Revolution to its current level of 420 ppm. This is significant because of the observed effect that these increased levels of, a powerful greenhouse gas, have on the warming of the atmosphere and in turn the ocean.
Climate scientists agree that this steady increase in carbon dioxide levels (as well as other greenhouse gases – water, methane, nitrous oxide) is the cause of the warming of the planet. The burning of fossil fuels by humans over the past few centuries has “unleashed vast reservoirs of fossil carbon stored in the Earth for hundreds of millions of years.” (Hearty). When the concentration of these compounds increases in the atmosphere, so to do global temperatures, as greenhouse gases limit the escape of long-wave radiation (thermal energy). These interactions result in a warmer climate, which means more glacial ice is being melted. When combined with more water released into the ocean, warmer ocean waters also expand in volume and result in higher sea levels.
If we look at the Earth’s history, it is extremely rare for Earth to have 400 ppm of carbon dioxide in its atmosphere. Paleoclimate research using ice core data shows that about 3 million years ago the atmosphere contained 400 ppm carbon dioxide. Then the sea levels were 10 – 40 m higher than today. In more recent Earth history, 800,000 years ago, during an interglacial period, there was 300 ppm CO2. As we discussed above, ice core data show that fluctuations in the Earth’s sea levels parallel atmospheric CO2 levels.
All this is evidence for the argument that as we continue to pour more CO2 into the atmosphere with continued fossil fuel energy reliance, we can expect sea temperatures and sea levels to continue to rise in tandem with the CO2 concentration. There are many other implications that go along with this scenario. We must remember the positive feedback mechanisms, such as that in which the melting of Arctic ice reduces the albedo effect – or the reflective nature of the white snow and ice. These types of mechanisms have the effect of accelerating warming and therefore increasing the melting of ice and, in turn, increasing sea levels.
Let’s look at the data from tide gauge records, graphed over the entire 20th century and into the 21st Century. The graph below represents a composite of 23 tide gauge records from around the globe for the last century (1880 to 2000), and altimetry data superimposed since 2000 (red line).

Each individual record shows the volatility (ups/downs) in water levels attributed to seasonal sea level changes that we have also previously discussed. To reduce this volatility, scientists employ a statistical averaging technique that calculates the average sea level of each successive three-year interval for all sites and then plots the average point on the graph. In this case, the moving average line is represented by the thick black line. Although it is still "wiggly," it is much smoother than the highly wiggly lines from which it is derived. This technique helps to "see the forest through the trees," so to speak.
Although a clear trend is visible in the 12 decades of data, the smoothed record helps to identify longer-term trends that are obscured by the highly variable local datasets. In this case, you will notice that there are essentially two modes in the longer-term trend. The first mode lasts roughly from 1880 through 1920, with a fairly stable sea level. In fact, the average sea level for this interval is used as the datum for this graph.
By 1920, the rate of sea level rise accelerates, and water levels begin to rise at a relatively constant rate through 2000 when satellite altimetry methods and data (red line) become available and help to substantiate tidal gauge methods.
These data show that sea level has risen an average of 20 cm (200 mm) over the last 80 years. This equates to a sea level rise rate of about 2.5 mm/year for the 80-year interval. If we take another look, including data collected since 2000, NOAA scientists show that the rate is accelerating again and a rate of 3.2 mm/yr. Has been established as the most current estimate.
The International Panel on Climate Change (IPCC) has set an estimated projected sea level rise at between 0.5 and 1.5 m by 2100. Many scientists argue that this is a too conservative estimate.
These estimates are based largely on the thermal expansion of seawater as the ocean surface heats up. However, the possibility of a significant contribution from the melting of ice sheets in Greenland and East and West Antarctic is not currently an important factor in IPCC predictions. Stay current as this research develops and estimates are adjusted accordingly.
Measuring Changes in the Arctic and Antarctic Ice Caps
Measuring Changes in the Arctic and Antarctic Ice CapsOne of the biggest uncertainties that has caused scientists to tend towards conservative estimates of sea level changes in recent years (and result in the frequent announcements of increased projections in the past few years) is the rate at which the Earth’s polar ice sheets are melting. In the 2007 IPCC report, the sea level rise projection agreed upon was a conservative 60 cm (~ 2 ft.). This number did not account for the possibility of rapid ice flow from Greenland or the Antarctic into the sea. These two ice sheets alone hold enough water to raise sea levels by 65 meters compared to 0.4 meters from all the world’s mountain glaciers. But, at that time, researchers felt that there was insufficient understanding of the ice sheets to be certain, so the IPCC resisted putting a number on it.
The most recent IPCC report (2013) increased this estimate to 98 cm or almost 1 meter.
This number has been bumped up further since 2014 with the most recent projections ranging from 0.2 to 2.0 meters (See NOAA Sea Level Rise viewer information in Module 4 Lab for more on these ranges).
Eliminating the uncertainty around quantifying the contribution of ice sheet melt-water to sea level increases is attributed to observations from NASA/German Aerospace Center’s twin Gravity Recovery and Climate Experiment (GRACE) satellites. These data indicate that between 2002 and 2016, Antarctica shed approximately 125 gigatons of ice per year, causing global sea level to rise by 0.35 millimeters per year.
In 2002, NASA launched the GRACE satellites, which track both ocean and ice mass by measuring changes in the Earth's gravitational field. The paired satellites orbit the Earth together and are spaced roughly 200 kilometers apart. Ice and water moving around the Earth exert different gravitational forces on the GRACE satellites. The satellites can sense the minuscule changes in the distance between one another caused by the change in gravitation force, which they measure and used to track water and ice mass change. It's thanks to GRACE that we know where the water flowing into the ocean came from. According to GRACE, melting of ice in Greenland increased sea level by 0.74 mm/year and melting in Antarctica by 0.25 mm/year since 2002. (Source: Smithsonian)
Recommended Resources
The science involved in understanding the behavior of ice sheets is growing rapidly. More data will no doubt be revealed in the upcoming years, which will help to increase the accuracy of sea level rise projections. Other work to measure the rate of change in the Antarctic is described in these NASA articles:
Modeling Sea Level Changes
Modeling Sea Level ChangesHow do the IPCC and other agencies arrive at these numbers: Current rate of sea level rise: 3.2 mm/ year (Source: NASA: Global Climate Change); Sea Level rise predictions: 0.2 – 2.0 meters rise by 2100 (NOAA)? The numbers, which are frequently adjusted and may vary according to the source, are achieved using modeling methods of different kinds.
Earth System Models integrate the interactions of atmosphere, ocean, land, ice, and biosphere to estimate the state of regional and global climate under a wide variety of conditions. They numerically model the atmosphere, oceans, land, and sea ice, and have biogeochemical components (for example, dynamic global vegetation models) to study the carbon cycle.
Earth System Models of Intermediate Complexity (EMICs)
Models of intermediate complexity bridge the gap between conceptual models with many simplifying assumptions, and extremely complex, three-dimensional models that attempt to include as many known processes as possible. (Source: NASA: Sea Level Change)
The data gathering by the many satellite missions described above is producing datasets that are used to populate the models. Modeling ocean and sea surface height is responsible for the creation of the incredible simulations seen in this module.
Although models can help tremendously in understanding complex interactions among components of Earth systems and their outcomes, they are never perfect, and all are given ranges of confidence due to uncertainty. They must be compared to observations to iron out their inherent errors. The challenges involved in modeling the contributions of the ice sheets to sea level rise have reduced the ability to provide a full picture of what is happening in the oceans. This area is a growing field, and we are likely to hear about breakthroughs in modeling these aspects of climate change in the near future. The figure below shows sea level curves based on the IPCC AR4 report, which estimates a sea level rise of 0.8 meters by 2100.
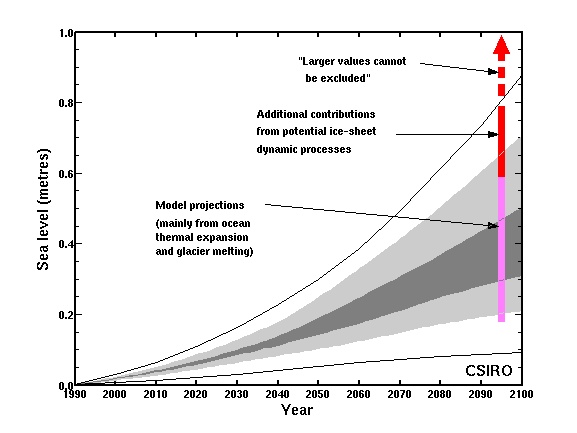
The figure above illustrates the levels of uncertainty that exist in the current data when using models to project future sea level rise. The AR4 IPCC data here show projected sea level curves through the year 2100. At 2095 the magenta bar shows a range of model projections (90% confidence limits), and the red bar shows the upper range extended to allow for the potential but poorly quantified additional contribution from a dynamic response of the Greenland and Antarctic ice sheets. Because there is a great deal of uncertainty surrounding the rates at which these ice sheets will melt in the future, a wide range of potential sea level rise scenarios are plotted. As the understanding of the mechanisms at work causing the melting of the ice sheets, the uncertainties shown here will most likely become more resolved in the future.
Summary and Final Tasks
Summary and Final TasksThe overall takeaways from the detailed discussions of sea level in this module are:
- sea levels are not uniform across the planet, so when we talk about mean sea level rise, these averaged numbers used tend to gloss over the fact that some places are experiencing greater or lesser effects, depending on many variables;
- the drivers of sea level changes over the history of the Earth are complex (including intrinsic and extrinsic factors) and feedback loops work to create cycles of sea level rise and fall, while maintaining an overall equilibrium;
- mean global (eustatic) sea level has been rising steadily during the 20th and early 21st Centuries;
- relative sea level rise causes large local differences in rates of sea level rise. Subsidence of the land can exaggerate sea level rise, while geologic uplift can cancel out some of the effects;
- the current rate of global sea level rise is quantified at 3.2 mm/ yr., a number which has increased in recent years, based on strong evidence that the rate of sea level rise is increasing;
- the chief driver for the acceleration in sea level rise in the past one hundred to two hundred years appears to be anthropomorphic in origin and caused by rapidly increasing atmospheric carbon dioxide levels due to fossil fuel combustion;
- paleoclimate research has established that sea levels have been much higher than today for much of the Earth’s history, with many factors at play, but atmospheric carbon dioxide levels appearing to be a chief driver in climate changes;
- glacial and interglacial periods during the past 500,000 years have been responsible for periods of rapid sea level rise, followed by periods of slower sea level fall as climate cools, glaciers form, and water is once again locked up in ice;
- the exact rates of increasing sea level depend on factors, such as rates of ice melt from polar ice caps, that are currently not understood well enough to give accurate projections;
- the Earth system science models are being refined continually, using more exact data from satellites, and will improve the ability of scientists to predict future sea levels;
- current projections for the end of the 21st Century are between 1 and 2 meters of sea level rise;
- a worst-case scenario suggests that if all the ice in Antarctica and the Arctic were to melt, there would result in a rise in sea level of 65 meters!
The implications of sea level rise – even the conservative projections – are huge for the millions of people around the world living in coastal communities. In Modules 5 and 6, we will consider how coastal catastrophes impact societies and how these societies are responding.
Reminder - Complete all of the Module 4 tasks!
You have reached the end of Module 4! Double-check the Module 4 Roadmap to make sure you have completed all of the activities listed there before you begin Module 5.
References and Further Reading
The following links are meant to provide suggestions for further investigation into the ever-changing landscape of sea level rise.
- Wikipedia: Sea level rise
- Smithsonian National Museum of Natural History: Sea Level Rise
- NASA: Understanding Sea Level - Causes
- NOAA - Climate Change: Global Sea Level
- NOAA National Centers for Environmental Information: What is Paleoclimatology?
- Climate Central: New Antarctic Research Ups Sea Level Rise Estimates
- NASA: NASA links port-city sea levels to regional ice melt
Module 4 Lab
Module 4 LabIntroduction
In this Lab, you will:
- Use the PSMSL website and Google Earth to explore historical records from tide gauges around the U.S. that provide reliable long-term data sets, to gain an understanding of different rates of sea level change on the Pacific, Atlantic, and Gulf coasts.
- Use NOAA's Sea Level Rise Viewer to make observations and compare sea level change predictions in locations around the U.S.
Lab Overview
There are two parts to this Lab.
- Part I is Analyzing Sea Level Change Using Tide Gauge Data. Download the tide gauge Google Earth KMZ data file from the PSMSL site. Use the tide gauge data to answer questions 1-14.
- Part II is the NOAA Sea Level Rise Viewer. After exploring and figuring out how to manipulate the viewer to give you the information for projected sea levels at the location of interest for different years, use the viewer to answer questions 9-15.
Part I: Analyzing Sea Level Change Using Tide Gauge Data
In Part I of this Lab, you will use data obtained from the Permanent Service for Mean Sea Level (PSMSL) in conjunction with Google Earth. A KML file is provided by PSMSL to open in Google Earth, making data access seamless. The sea level data are monthly and annual means referenced to a common benchmark and are referred to as a Revised Local Reference (RLR). This data is used to create accurate time series to observe trends. We are choosing four tide gauges with long time series. The longer the time series (more data), the more reliable the data are for looking at trends. You will notice short-term variability in the data – more in some locations than others. As you work through the lab, consider the difference between short-term and long-term time-series data and the reasons for the short-term variability that makes the data “noisy."
PART II: NOAA Sea Level Rise Viewer
Sea-level rise is expected to accelerate in the immediate future. However, even using the annual rates you calculated from the tide gauge data from the 20th Century and early 21st Century, a steady rise would be expected.
In Part II of this Lab, you will use the NOAA Sea Level Rise Viewer to help you visualize what these levels would look like in particular locations around the U.S.
You will keep your calculated rates in mind for each place from Part I, as you work with the viewer and consider the factors that influence the future projections of increased sea level rise.
NOAA built the viewer based on data that calculates a projected Global Mean Sea Level (GMSL) for 2100 to be between 0.3 m and 2.5 m. The model uses five GMSL rise scenarios: Intermediate-Low, Intermediate, Intermediate-High, High, and Extreme, which correspond to GMSL rise by 2100 of 0.5 m, 1.0 m, 1.5 m, 2.0 m, and 2.5 m, respectively (NOAA). For more detail on the science behind the Sea Level Rise Viewer, please take the time to read at least the Executive Summary and Introduction of NOAA Technical Report NOS CO-OPS 083 “Global and Regional Sea Level Rise Scenarios for the United States” listed in Resources.
Downloads/Resources
- Module 4 Lab Worksheet
- Tide Gauge KML File (see downloading directions below)
- Global and Regional Sea Level Rise Scenarios for the United States (Executive Summary and Introduction)
- NOAA Sea Level Rise Viewer Note: The viewer functions better if you use Google Chrome.
Directions for downloading tide gauge data using the PSMSL site and Google Earth
- Go to: PSMSL Tide Gauges.
- Follow the directions to download the tide gauge KML file and open it on Google Earth.
- The PSMSL RLR Catalogue folder will appear in your Temporary Places on Google Earth. Click on this folder to open, and select the Last Reported Year of 2018 or after (or the most recent available). This will reveal the tide gauges around the world with the most current data. These are the gauges we are interested in. We are also interested in those that have long and continuous datasets. We have chosen three with good data available, going back to early in the 20th Century. These are: Boston, MA, San Francisco, CA, and Grand Isle, LA. They also provide us with U.S. northeast coast, west coast, and Gulf Coast locations.
Statement of Use of AI on Exams, Quizzes, and Labs
Instructions
Before you begin the Lab, download the Lab worksheet and tide gauge data. We advise you to either print or download/save the Lab worksheet, as it contains the steps you need to take to complete the Lab in Google Earth. In addition, it has prompts for questions that you should take note of (by writing down or typing in) as you work through the Lab.
Once you have worked through all of the steps and completed the measurements, you will go to Module 4 Lab (Quiz) to complete the Lab by answering multiple-choice questions. The answers to questions on this Lab worksheet will match the choices in the multiple-choice questions. Submit the quiz for credit.
Capstone Project: Stage 2 Instructions and Examples
Capstone Project: Stage 2 Instructions and ExamplesIn Module 1, you downloaded the CVAT Coastal City Audit PowerPoint file. You will use this file to build your final Capstone Project. In this module, you will work on Capstone Stage 2.
Directions
- Complete Stage 2 of the CVAT Coastal City Audit PowerPoint: Physical System Assessment: Setting and Coastal Hazards (Blue Section). Include slides relevant to this stage for your City Slide presentation in indicated spaces.
- Make sure you insert references for your information sources as you go along.
- Submit your updated CVAT PowerPoint here by the due date. Please employ the following naming convention: Last Name_First Name Stage2.pptx
- After you have submitted Capstone Stage 2 with the City Slides and have received feedback from your instructor, you may make revisions to your City Slide figures. Remember they will be included in your end-of-semester presentation.
 Statement on Use of AI in Capstone Research
AI is a powerful tool for doing research and learning when used correctly. We allow the use of AI to research your Capstone city with the following strict conditions:
- You can use AI for research, but you cannot under any circumstances copy out of AI directly into the CVAT. You must rewrite everything in your own words. We can and will check all entries with a ChatGPT checker, which detects AI-generated text with 96% accuracy. There is no credit given for grammar, so please write everything from scratch and do not use Grammarly, as these can trip the AI checkers. Any direct copying will result in a ZERO for the assignment. You must cite all references that AI gives you.
- You will also include slides for your City Slides presentation relevant to Stage 2 for feedback. You cannot use AI for these under any circumstances for the City Slides, you can search for images using Google Images or any other search engine. Copying images or presentations out of AI is easily detected because and will receive a strict penalty.
Rubric
| Capstone Stage | Activity | Criteria | Points |
|---|---|---|---|
| CVAT Stage 2: Physical System Assessment: Setting and Coastal Hazards | Complete CVAT Stage 2: Physical System Assessment: Setting and Coastal Hazards and submit by the due date. The instructor will grade your work and provide feedback where needed to help you improve your project. | Accurate characterization of each of the sections related to the physical setting and coastal hazards in the student’s chosen coastal city. Provides details and examples and uses terms from class materials (10 points); Describes the physical setting and coastal hazards, but some important information is inaccurate/missing, or a section is missing. (6 points); Description of physical setting and regional and local coastal hazards contains significant inaccuracy/ missing information and little detail (4 points); Poor attempt to describe the physical setting and coastal hazards. Lacks most information. (2 points); No information provided on these topics (0 points). | 10 |
Examples
We included a couple of examples below to help you get going. We stress that there are no correct answers, and these examples are for guidance, to help you with questions about the amount of detail we expect in various components of the Capstone project. Also these were taken from a previous version of the CVAT which was more detailed. Every city is different, and there may be more information in one area or another for a specific city. For example, there is often more information, particularly in the engineering and policy areas, for U.S., European, and some Asian cities than there is for some cities in Africa. Again, please use these examples for guidance, along with the detailed directions for each stage, and let us know if you have any questions.
Capstone Project Stage 2 Example: San Francisco
Click on the expansion arrows  at the bottom right of the slide show to view full-size images.
Capstone Project Stage 2 Example: Shenzhen, China
Click on the expansion arrows at the bottom right of the slide show to view full-size images.
Module 5: Hurricane Formation and Evolution
Module 5: Hurricane Formation and EvolutionIntroduction
Without a doubt, coastal storms are among the most devastating natural hazards to impact human societies. Even seemingly small hurricanes and nor’easters have the capacity to do significant damage in very short periods of time. Each year, these catastrophes result in numerous injuries, the loss of life and property, and are detrimental to the economic vitality of coastal regions around the world. Coastal storms, whether tropical or extratropical, result in significant erosion from high winds, high water levels and coastal flooding, and large turbulent waves. The list of damaging storms in recent years is extensive, in part because storms of one type or another can be generated throughout the year. In the U.S., hurricane season lasts from early summer through early winter, and when hurricane season is over, extra-tropical storms (nor’easters) become more frequent. In Module 5 we will learn about how these storms form and evolve and how they can be forecasted. In Module 6 we will examine the lessons dealt from recent storms.
Goals and Objectives
Goals and Objectives- Students will continue to develop the fundamental geospatial skills and concepts needed to assess cyclones and their formation.
- Students will develop an understanding of the relationships between the atmosphere and hydrosphere that result in the development of cyclones.
Learning Objectives
By the end of this module, students should be able to:
- describe the atmospheric conditions that are required for the formation of tropical and extra-tropical cyclones;
- analyze case studies of how coastal systems are impacted by cyclones;
- investigate geomorphological changes that result from coastal hazards.
Module 5 Roadmap
| Activity Type | Assignment |
|---|---|
| To Read | In addition to reading all of the required materials here on the course website, before you begin working through this module, please read the following required readings to build some required background knowledge on storm surge: Extra readings are clearly noted throughout the module and can be pursued as your time and interest allow. |
| To Do |
|
Questions?
If you have any questions, please use the Canvas email tool to contact the instructor.
Hurricane Formation
Hurricane FormationTropical cyclones are storms that are born in tropical oceans and depend on warm water for their source of energy. They originate between 4° and 22° S of the equator, and between 4° and 35° N of the equator. During the northern hemisphere’s summer (July-September), most of the energy is delivered to the sub-tropical region of the northern hemisphere. The result is the development of large cyclonic (counterclockwise rotating) cells that are termed hurricanes if they form near North America and typhoons if they are formed in the western Pacific. Tropical cyclones do not, however, occur in the equatorial zone. More than two-thirds of tropical cyclones occur in the northern hemisphere and occur between May and November, when the ocean is at its warmest, with a peak in August and September. In the southern hemisphere, they occur between December and April, with peaks in January and February, where they are typically called cyclones.
We generally associate tropical cyclones with the damage they do when they come in contact with land, but they spend most of their “life” out in the ocean and are a phenomenon best explained in terms of heat transfer between the atmosphere and the ocean.
The Birth of a Cyclone
The generation of a tropical cyclone is dependent upon the transfer of thermal energy from the ocean to the atmosphere. When significant volumes of warm water vapor move upwards, low-pressure cells develop at the Earth's surface and large storms are generated. In the process, water vapor evaporated into the atmosphere will cool and condense. This is ultimately how storm clouds are produced. As the water begins to fall back to the surface, large scale convective cells are generated, and the air mass is forced to spin in response to the Coriolis Effect. This causes deflection of air masses to the right in the northern hemisphere and deflection to the left in the southern. For storms to sustain themselves, the upward movement of warm water vapor needs to be constantly resupplied or the storm will weaken and eventually fall apart. The video beelow explain how a hurricane forms and outlines its anatomy:
Video: Hurricanes 101 | National Geographic (2:57)
Hurricanes 101
(heavy winds blowing) - [Narrator] Cyclone, typhoon, hurricane. All of these names are used around the world to describe the most powerful storm known to man. Hurricanes are unpredictable but scientists have a thorough understanding of how hurricanes form and sustain their power.
In the Atlantic Ocean, hurricane season peaks during the late summer months when tropical waters are the warmest. Hurricanes form from a cluster of thunderstorms that suck up the warm, moist air and move it high into Earth’s atmosphere. The warm air is then converted into energy that powers the hurricane’s circular winds. These winds spin around a low-pressure center called the eye, which can provide a 20 to 30 mile radius of eerie calm. Encircling it is the eye wall, a towering ring of clouds with some of the fastest wind-speeds of the hurricane. Surrounding the eye wall are curved bands of clouds, the rainbands, often tens of miles wide, releasing sheets of rain and sometimes tornadoes.
When a tropical storm’s winds reach at least 74 miles per hour, it becomes a hurricane. The hurricane then receives the category ranking of one to five on the Saffir-Simpson Scale based on its wind speed and potential damage. But wind speed isn’t always the most dangerous component when hurricanes come near land. It’s storm surge. Storm surge is caused when winds from an approaching hurricane push water towards the shoreline up to 20 feet above sea level and can extend 100 miles. 90% of all hurricane deaths are the result of storm surge.
While hurricanes can cause mass devastation, just like other natural disasters, they serve a higher purpose within the global ecosystem. Hurricanes help regulate our climate by moving heat energy from the equator to the poles, keeping the Earth’s temperature stable. Over time, science has helped us to better understand hurricanes and predict their paths, saving lives through early warning systems and helping us build better infrastructure to protect our cities. The more we study these complex storms, the better we can prepare for them and minimize their impact on human lives.
How a hurricane develops: Hurricane Facts
For a tropical cyclone to generate, the temperature of the upper 60 meters (~200 ft.) of the ocean water must be greater than 26°C (~79°F). In addition, certain atmospheric conditions are needed to drive the formation of convection cell described above. Horizontal shear winds prevent formation; conversely, in conditions with low wind shear, heat and moisture are retained to allow continued development. The building of the tall cumulonimbus clouds associated with a tropical cyclone depends on the deep convection currents extending into the troposphere. The initial anomaly is called a tropical wave, and then with progressive intensification, it is called a disturbance, an investigation (where it is given a number), then a depression, tropical storm, then a hurricane. This is explained in the following video:
Video: The Basics of Hurricanes and Tropical Weather Forecasting (8:07)
Alan Sealls: I’m chief meteorologist Alan Sealls and let’s talk about hurricanes and hurricane season. It comes around every year, starting on June first, ending on November 30th. And the peak of hurricane season is basically late August into September. Now, these are averages. Hurricane seasons typically start pretty quietly in the Atlantic Ocean, but then as the ocean heats up, that’s when you see more activity — whether it’s a tropical depression, a tropical storm, or all these other things. So you have to know your hurricane vocabulary. I think most people know the hurricane. That’s the big storm. That’s the one you don’t want. A tropical depression tends to be the weaker storm, but it could be a big slow rainstorm, but beneath that, you have all these other things. For example, tropical waves, tropical disturbances, and invest or investigations. It turns out the stuff on the top, that’s less frequent. You typically get no more than half a dozen hurricanes in the Atlantic each year, but that’s also a higher threat, so small number big threat. Down at the bottom, a larger number but smaller threat.
So, take it one by one. A tropical wave — it’s a region of low pressure in the tropics that moves from east to west. It’s just low pressure. But within a tropical wave, if you have thunderstorms that travel as a group, as a cluster, and they hold together, it’s called a tropical disturbance. Now, if that disturbance looks like it may form into something, it’s known as an invest. In other words, it’s being investigated to see if it will develop any further. It will have a number, but that number is not the same as the number a tropical depression or a tropical storm would get. So we show you a lot on TV, you’ll see it on social media, these lines representing computer models. They’re known as spaghetti plots. It’s the nickname, but they do look like strands of spaghetti. Doesn’t matter if it’s a tropical storm, or a hurricane, or even a tropical depression, those model plots show where the center of that storm could be in the future. But it’s actually the basis for creating the forecast cone.
Here’s how it works. You start with the system that’s moving to the west and in time, if you look at where most of those spaghetti plots are, you draw a circle. That is your forecast area, and it’s relatively small to start because you’re pretty certain it’s going to move in the same direction. However, in time, as the model spreads apart, your circle gets bigger. In other words, you are less certain. The farther out in time you go, the less certainty you have. So you take all those forecast circles, and you connect the edges of them and that’s what creates the forecast cone. But there are a couple of things about the cone people don’t realize. The forecast cone is only for the center of the storm. It’s not to say, if it’s a hurricane, for example, that the hurricane stays in here, it means the center could track along the northern edge of it, or the southern edge, or right through the middle. But even if it does that, the impact could still be well outside the cone. Another really important thing to know — the cone, as it’s a forecast, it’s not certain, it’s not definite, and statistically, one-third of the time the center of the storm will go outside the cone. It may come back into the cone, but it’s not perfect. It is only a projection. So again, it’s based on, mostly spaghetti plots from multiple models, indicating where a storm could be. But they don’t indicate the strength of the storm, they only indicate the path.
Take a computer model. You’ll see dozens of these online now. They use math and physics, calculus, to compute and project what’s going to happen. And if you think about watching an animated movie, when you watch animated figures, they’re never truly perfect like humans. Same thing with computer models. They are never perfect, but they start with the basics of temperature, pressure, humidity, and wind at multiple levels in the atmosphere, and over a thousand, tens of thousands of square miles. They also account for water temperature and some account for how salty the water is because that will control the rate of evaporation. That also controls whether the warm water will stay at the top or whether it may overturn and sink. So these are just some of the variables that go into computer models.
So you take all that and the problem is, getting it is difficult. When a storm is out to sea, the only thing we have is a satellite to let us know that something is out there. There are ships that will pass storms, but they purposely go away from them. But ships can give us data, buoys can give us data, but there aren’t that many buoys in the Gulf, in the Atlantic, in the Caribbean. And when it gets near shore, we can use radar. Don’t forget weather balloons, those go up into the air, but you have to launch them basically from land. But there are multiple aircraft that fly out into the ocean and drop instruments into the ocean, into the clouds, into the storm, to take measurements. C-130 aircraft, p3 Orion, a Gulfstream 4 jet, and that one on the top that’s an unmanned UAV, unmanned aerial vehicle, also known as a drone. NASA uses it. And those things, it’s known as the Global Hawk, they go out into the ocean stay out there for a long time, dropping instruments for weather information.
So, you take all that stuff, what does it take to get a hurricane? It actually takes a lot more than you might think. It’s not just warm water. First of all, you have to have air that is fairly unstable. You’ve got to have clouds, which tells you that the air is cooling as it goes up, the relative humidity hits 100 percent, you get the clouds forming. But you’ll also have air that’s going up and down, up and down, which we call convection, and that’s what we get daily in the summer onshore. Thunderstorms, they’re due to convection. If you have a convection oven, you know the air is going up and down, in all different directions. Along with that, about 3 miles above the surface of the ocean, you need relatively moist air and that’s what will help those thunderstorms last and persist. But one thing you can’t have is too much wind shear. In other words, if the winds are light near the surface of the ocean, and you go up a few miles, and they’re too strong, the clouds will fall over they’ll get shredded apart. So you won’t start to get development. You need light wind shear to get tropical systems to develop. And of course, warm water, everyone knows that part. And yes, the Gulf, the Caribbean, the Atlantic, they get really hot in the middle of the summer. The Sun beats down on them constantly, the oceans heat up, you take that heat, you take the light wind shear, you take a tropical wave, you take a tropical disturbance, and if you can get a circulation, if you can get the wind circulating less than say 39 miles per hour, it would become a tropical depression. Now, at that point, it gets a number. Once the winds exceed 39 miles an hour, it would be classified as a tropical storm and given a name. You could have a tropical storm with 40 miles an hour, or 70 mile an hour winds, and even though those winds are not as strong as what you would see in a hurricane, which are basically 75 miles and up, still it could be a bad system in terms of rainfall and in terms of what it could spawn for tornadoes. So when you look at hurricanes with winds over 74 miles an hour, and the strongest hurricanes winds over 150, it’s the forward right quadrant that’s the worst. So if this is moving north, it would be that forward right quadrant that would have the most impact. And those bands feeding into that quadrant, that’s where you would be most likely to find tornadoes, at least on the northern Gulf Coast.
So what about the names of these systems? They’re alphabetical A through Z, except you don’t use the letters Q, X, Y, and Z because there aren’t that many names that start with those letters. The lists are already designated and they recycle every six years. They’re not created by the US government, they’re created by the World Meteorological Organization, simply because tropical weather impacts multiple countries, multiple nationalities, and languages, so we can’t just use names that we would be used to in the United States. To be fair, the names do alternate male and female. So that’s just a little primer on hurricanes and the tropical season. But it’s all about being prepared. Even early in the season, you can have a system, even outside of the season, you can have a system. I’m chief meteorologist Alan Sealls.
Anatomy of a Hurricane
There are distinct stages of formation that vary greatly from storm to storm. As the pressure drops in the center of the storm, the winds that rotate around the center increase. Narrow cloud bands form, spiraling inwards. The center of the storm, or the eye, is where the lowest pressure is found. The eye wall at the edge of the eye has some of the strongest winds and intense thunderstorms, but the eye itself is characterized by calm. The hurricane-force winds may extend out from the eye for 300 km (~186 miles). The strongest winds occur towards the right-hand side of the center in the direction of the cyclone’s path, so a storm moving north will have the strongest winds in the northeastern quadrant.


Hurricane Tracks and Forecasting
Hurricane movement is guided by surface winds. As we will see in the examples given, the Atlantic hurricanes travel west or northwest across the Atlantic and then recurve to the north and then northeast. This curvature is dictated by the Coriolis effect, which is caused by the Earth’s rotation. This pattern also occurs in the northern Pacific. Although these are predictable patterns, each storm has a unique path and there is great variation depending upon the atmospheric conditions near the storm, which act as steering forces. As we will see later wind movements are a function of atmospheric pressure, with storms basically moving around high pressure systems and towards low pressure systems.
Nevertheless, the patterns made by the historic tracks seen in the animation below show how the storms generally follow certain rules. This predictability aids in forecasting the paths using satellite data and numerical modeling.
Hurricane Tracks Animation and Cumulative Map (0:14) (Video is not narrated)
The cyclone’s interaction with the ocean’s surface has an effect of reducing the surface temperatures of the ocean. Once the storm approaches land, it encounters shallower water and begins interacting with coastal features. Friction and loss of the warm water “fuel” remove energy from the system, and it will dissipate once over land. It is at the ocean-land interface that the storm surge, which builds with the storm in the ocean, creates a tremendous hazard for those living on the coast.
Summarizing Warm Core Storms
Summarizing Warm Core StormsUnderstanding the impact of storm systems as they come ashore is not straightforward. Although storm systems may have similar size, strength, and movement speeds, differences in their trajectories relative to the shoreline, together with geomorphic features present along the shoreline (i.e., reefs, mangroves, barrier islands, constructed shorelines, etc.), water depth, and timing of tides all have profound impacts on the intensity of damage individual storms produce. As will be seen in the case studies in Module 6, passive continental margins like the Atlantic seaboard, although they have limited risk from tectonic movement, are subject to extreme impacts from tropical storms. It is, therefore, incredibly important for communities located in such settings to not only understand the risks, but also to work to limit and minimize storm impacts on the human landscape as much as is possible while limiting the cost of doing so. Future modules will explore these factors in more detail.
Learning Check Point
Learning Check PointQuick Review
Watch the following two videos for review and answer the Learning Check Point questions to be sure you have understood the material provided.
The following video provides an animation of the 2005 hurricane season, with an excellent review of the conditions required for active hurricane formation.
Video: Hurricanes Explained: How 2005 Was the Perfect Storm (4:56)
This NASA video explains the mechanism of tropical cyclone formation in terms of heat transfer.
Video: Hurricane Heat Engine (2:05)
Take a few minutes to answer the questions below.
Storm Surge
Storm SurgeStorm surge is the high water generated by the storm’s winds while at sea. The surge is the height of the water over and above the predicted astronomical tide. This is distinguished from “storm tide,” which combines surge and tide. When the storm approaches land, it pushes this elevated water onto the land, with energy levels that cause tremendous damage to human structures and rearrange natural coastal features. It is the most dangerous storm aspect, responsible for perhaps 75% of the deaths associated with tropical cyclones. A large storm surge can penetrate miles inland, destroying property, moving large amounts of sediment, and wiping the landscape clean of vegetation.
For more information about Storm Surge
- To appreciate storm surge impacts, check out the surge example at NOAA Storm Surge. Note the animation is in shockwave format, so some tablets/iPads may not be able to play it directly, although Safari, Explorer, or similar browsers on other computers should be able to.
- The National Hurricane Center - Storm Surge Unit: Introduction to Storm Surge document illustrates many important key points related to storm surge.
Historic Storm Surge Records
Historic Storm Surge RecordsAs we mentioned above, coastal settings with embayments are particularly prone to high waters from storm surges, which get magnified when they enter a bay or river mouth. Rocky shorelines are less susceptible because these shorelines are often configured with relatively deep offshore bathymetric approaches that do not support the development of significantly high volumes of water in the nearshore region. In the U.S., the largest storm surge ever recorded occurred during Hurricane Katrina in the area of Pass Christian, Mississippi, where the level was increased as it entered several bays, including Bay St. Louis. Combined with wave heights, the storm surge at Biloxi, Mississippi created a high watermark in excess of 30 feet.
Based on modeling using NOAA’s SLOSH (Sea Lake and Overland Surge from Hurricanes) program, geoscientists have predicted the highest theoretical storm surges, and all occur on either the Gulf Coast or the East Coast in areas that are heavily populated and developed. Go to: U.S. Storm Surge Records to read about how first-hand evidence, such as high watermarks, and modeling such as the SLOSH models, can help us understand the potential of storm surge.
Globally, the highest storm surge ever is reported in northern Australia in 1899 during a cyclone. Although the exact height is still uncertain, it is reported to have been in excess of 40 feet. For details, see World Storm Surge Records. In the Indian Ocean, a cyclone produced a surge measured at just over 10 meters (~34 feet) in Bangladesh in 1970. This event produced the largest number of casualties on record for all storms globally, see The 35 Deadliest Tropical Cyclones in World History.
You can use the NOAA Historical Hurricane Tracks server to search for specific storms. See the link below the image in the figure below.

Measuring the Strength of Tropical Cyclones
Measuring the Strength of Tropical CyclonesBefore looking at examples of catastrophic storms, let’s review the ways they are quantified in terms of strength. The Saffir-Simpson Scale was developed in 1971 by civil engineer Herbert Saffir and meteorologist Robert Simpson, who at the time was director of the U.S. National Hurricane Center (NHC).
The scale uses the wind speeds and pressure of a storm to determine its strength. It did not originally take into account storm surge. The modified version of the Saffir-Simpson Scale on HurricaneZone.net attempts to rectify this by assigning storm surge ranges to the scale. Please visit this site to learn about the classification of tropical cyclones (Categories of hurricanes and typhoons).
An abbreviated summary of this modified Saffir-Simpson scale is shown below.
|
Category |
Wind speeds/ surge |
Types of Damage |
|---|---|---|
|
Category 1 hurricane |
74-95 mph (64-82 knots; 119-153 km/hr); surge 4-5 ft (1.2 – 1.7 m) |
“Minimal”: Minimal damage to buildings, boats, trees, etc. Main threat is from heavy rainfall. |
|
Category 2 hurricane |
96-110 mph (83-95 knots; 154-177 km/hr); surge 6-8 ft (1.8 -2.6 m) |
“Moderate”: Roof and window damage to buildings; severe damage to mobile homes. Some damage from storm surge. |
|
Category 3 hurricane |
111-130 mph (96-113 knots; 178-209 km/hr); surge 9-12 ft. (2.7 – 3.9 m); |
“Extensive”: Structural damage to buildings; complete destruction of mobile homes. Storm surge destroys some buildings and causes shoreline erosion. |
|
Category 4 hurricane |
131-155 mph (114-135 knots; 210-249 km/hr); surge 13-18 ft (4 -5.5 m) |
“Extreme”: Structural failure of some buildings. Severe coastal erosion. Hurricane force move winds far inland. |
|
Category 5 hurricane; Super typhoon |
Greater than 155 mph (135 knots; 249 km/hr) surge >18 ft (5.5 m). |
“Catastrophic”: Catastrophic storm surge damage; Many buildings destroyed beyond repair. |
Because storm surge is not well integrated into the Saffir Simpson Scale, it is often under-appreciated for the risk it poses when a hurricane comes ashore. It is the most dangerous part of any coastal hurricane impact and has been responsible for the majority of the deaths that have been recorded as a result of U.S. hurricanes. A good example is found in Hurricane Katrina. Although classified as category 3 upon landfall, Katrina was category 5 while in the Gulf of Mexico. Therefore, the storm surge, at more than 20 ft. fit the category 5 surge classification according to this modified scale.
Factors Determining the Size of the Storm Surge
Factors Determining the Size of the Storm SurgeYou may wonder why a storm like Katrina, which made landfall as a category 3 storm, had such a huge storm surge compared to say, Harvey, which came ashore as a category 4 storm. When a hurricane is approaching a shoreline, the communities in its path need good information about what to expect. But surge predictions are tricky.
Refer back to the Saffir-Simpson Scale. These are estimates that are not 100% reliable because there are many factors determining the height of a surge. They include:
- the size, intensity, speed, and angle of approach of the storm itself;
- the width and slope of the offshore shelf and the slope of the shoreline itself;
- the shape of the shoreline and coastal features present.
The intensity (wind speed) of a storm is directly related to the storm surge – with the relationship shown in the Saffir-Simpson Scale. The speed of a storm has an impact on the size of the surge, but it is not a simple relationship. A fast-moving storm can generate a higher surge, but when a slow-moving storm pushes a surge into a coastal bay or other enclosed water body, it can cause the surge height to magnify. A large storm (in terms of diameter) can produce a larger surge than a smaller storm because the winds affect a larger area of the ocean. The communities along the Gulf Coast are keenly aware of another feature of hurricane storm surges: The greatest surge occurs in the northeast quadrant of the storm, to the east of the eye of a northward moving hurricane. Hence, Bay St. Louis, Mississippi received a greater storm surge than New Orleans in Katrina.
If the offshore continental shelf is wide and gently sloping, the storm surge will be greater than if the shelf is narrow and steeper. If the land also has a very gentle gradient, then there will be little to stop the storm surge from flooding far inland. This is the case on the Louisiana coast as well as other locations along the Gulf coast. This topic will be revisited in Module 8. Narrow inlets along a coastline will tend to magnify a storm surge as the water is funneled into the opening and “piles up”. This was evident on the Mississippi coast when Katrina’s storm surge came ashore in 2005. See the SLOSH model animation below. Here, the surge pushed into Bay St. Louis with an almost 30 ft storm surge. Conversely, features such as offshore barrier islands can act to reduce the surge height before it comes ashore, although these features take the brunt of the energy of the surge, resulting in massive amounts of erosion.
For more information
The Sea, Lake, and Overland Surge from Hurricanes (SLOSH) Model of Katrina’s storm surge, found at Historical SLOSH Simulations, shows a time series reconstructing the storm surge height as the storm came ashore, pushing the storm surge into the bays and estuaries. It helps to play it at a slower speed and repeat the loop several times to appreciate how the water behaved.
More on Hurricane Prediction
More on Hurricane PredictionHurricane Tracks and Forecasting
As we will see in the examples given, the Atlantic hurricanes travel west or northwest across the Atlantic and then recurve to the north and then northeast. This curvature is dictated by the Coriolis effect, which is caused by the Earth’s rotation. This pattern also occurs in the northern Pacific. Although these are predictable patterns, each storm has a unique path and there is great variation depending upon the atmospheric conditions near the storm, which act as steering forces.
Nevertheless, the patterns made by the historic tracks seen in the animation below show how the storms generally follow certain rules. This predictability aids in forecasting the paths using satellite data and numerical modeling.
Hurricane Tracks Animation and Cumulative Map (0:14) (Video is not narrated)
The cyclone’s interaction with the ocean’s surface has the effect of reducing the surface temperatures of the ocean. Once the storm approaches land, it encounters shallower water and begins interacting with coastal features. Friction and loss of the warm water “fuel” remove energy from the system, and it will dissipate once over land. It is at the ocean-land interface that the storm surge, which builds with the storm in the ocean, creates a tremendous hazard for those living on the coast.
Predicting the path and intensification of hurricanes can be very difficult. As we have learned earlier, there are many factors that control how a hurricane moves, and determining whether and by how much it will intensify is also complex. These variables include sea surface temperature, steering winds, atmospheric pressure, and several others. Because of this complexity, forecasting is now always done with atmospheric models that have become far more capable and accurate in recent years. There are dozens of models that are used in forecasting, and they don’t always agree. That is why hurricane forecasts have a cone of uncertainty. Moreover, different factors impact the storm path and whether it intensifies. The National Hurricane Center in the US compiles these model forecasts, and collectively they are called Spaghetti Diagrams because of the long, closely parallel paths of the different models. The models are used to build a cone of uncertainty that shows the range of the possible storm forecasts.
Try This!
You are strongly encouraged to visit Hurricanes: Science and Society for an explanation of the processes that steer hurricanes. Then, use the information on this site to answer the following questions. These will help you master the lab activity.
- Why do disturbances move westward across the tropical Atlantic?
- What is the role of wind shear in the evolution of a hurricane?
- Do high-pressure systems such as the Bermuda high attract storms towards them or steer storms away from them?
- What is the name of the critical high-pressure system in the Atlantic that guides hurricane paths?
- Why do hurricanes gradually drift northward?
- What is the overall impact of wind shear on a storm?
- What is the impact of cooling water temperatures on the strength of a storm?
So in summary, hurricanes' paths are steered by winds which are a function of atmospheric pressure systems. Intensification is impacted by wind shear as well as ocean temperature. Satellite images of a hurricane help determine whether the storm is intensifying or weakening.
Extratropical Storms
Extratropical StormsIn Module 2 we briefly discussed extratropical storms (Northeasters and fronts) and their destructive power. Here we learned an important distinction: Although extra-tropical storms are typically smaller and less powerful than tropical cyclones, they are much more frequent, so their cumulative impact on a coastline can be more significant. We will now take a closer look at these types of storms, also referred to as “Cold Core” storms.
Extratropical storms, otherwise thought of as “cold core” storms, are generally produced outside of tropical regions. In contrast to tropical storms produced by an uplift of warm moist air masses fueled primarily by evaporation of warm waters, extratropical storms are formed when cold air masses interact with warm air masses on land or at sea. As these bodies of cold air collide with warm air bodies, discontinuities (that is, weather fronts) form. As the fronts mature and strengthen, the denser, drier cold air masses move underneath the more buoyant warm air masses and help force the warm air to rise. As a result of this rising air leaving the surface, low-pressure systems, called cyclones, develop and draw air (i.e., wind) into the low-pressure center. In the Northern Hemisphere, the winds of these cyclonic systems deflect to the right as a result of the Coriolis Effect. The opposite is true in the Southern Hemisphere. As a result, cyclones have a counterclockwise rotation in the Northern Hemisphere and clockwise rotation in the Southern Hemisphere. As the warm air rises in the atmosphere, it cools and releases its potential energy as sensible heat, thereby raising the temperature, making the air more buoyant, and consequently fueling a more intense upward movement of air, which further lowers the pressure at the surface, intensifying the storm. At the same time, the water vapor in the rising air condenses, turning into cloud droplets, and they subsequently become precipitation. Through these positive feedbacks, temperature, pressure, and humidity (moisture) gradients between lower and upper-level layers of the atmosphere help fuel the continued development of high winds and extreme types and volumes of precipitation. Most extratropical storm systems are neither large nor intense and produce modest winds and precipitation totals, but when conditions are right, they become quite powerful and extraordinary in their scale and impact. Blizzards, nor’easters, and thunderstorms formed along frontal boundaries are examples of powerful extratropical storm systems.
Arctic Cold Fronts, Gulf Stream, & Nor'easters
Arctic Cold Fronts, Gulf Stream, & Nor'eastersThe storms discussed above occurred on the West Coast of the U.S., but what about similar storms that form on the East Coast? When similar storms form along the eastern seaboard, they can often grow into monster storm systems that have wide-ranging impacts. When they do develop, they are termed nor’easters. In most storm formation scenarios, warm moist air masses originating from the Gulf of Mexico move north and east. They then collide with cold fronts originating from Arctic Canada that push south. In many cases, the warm air masses form ridges of high pressure that form on either side of a cold air trough. When the air masses collide, low pressure develops as the warm air mass on the leading side of the trough is forced upward.
Like tropical cyclones, these storms can actually intensify when they are fueled by warm water. In the case of nor’easters, when the low-pressure system moves over the mid-Atlantic coast, they often intersect air masses fueled by the warm Gulf Stream. This warm water produces moisture-laden air that rises rapidly when displaced by the denser cold air and helps to strengthen the convective uplift. By pumping additional warm, moist air into the atmosphere, these storm systems can become stronger, often with gale-force winds, and intensive precipitation. As most of these storms occur in the winter, they often result in significant snowfall inland and have intensive coastal impacts with high waves and intensive erosion. Each year, nor’easters can be relatively minor or can be very severe.
Video: What is a Nor'Easter? (2:30)
This video helps explain how these types of storms form.
What is a Nor'Easter?
Hi, I'm meteorologist Rob Koch with you on weather nation covering an in-depth look – more at the Northeast storms, Nor'easters as they're known by. And, of course, we're dealing with one moving across areas of New England and parts of the Mid-Atlantic. Well, we're going to talk about how these systems form, by definition. We're also going to talk about, historically, how many we see each year. And the number may actually surprise you.
It is astonishing, but in the works we've got the cool air coming into this low-pressure trough. We've got the warm conveyor belt of air along the jet stream riding right over the top of the Gulf Stream, which is that warm puddle or pool of air that circulates through the Atlantic Ocean. So, by definition, a nor'easter is officially, it's a mid-latitude or extra-tropical cyclone that tracks along the US east coast or the Atlantic seaboard. The name of it comes from the fact that the wind direction in those coastal communities impacted by the storm is from the Northeast, thus the term nor'easter. No other reason why it picked up that name besides that.
Typically, we'll see these occur between the months of September and April. It can start as late as October, but will always go to, typically around April. And they usually do develop over the Gulf Stream, originating around Georgia and up towards the New Jersey coast. Now, in an average year, in an average year, there can be as many as 20 to 40 Nor'easters in a year. That's an extremely high number. But of those, only about two to three actually become significantly severe. So that number, thankfully, is quite low.
So, here's usually the ingredients that need to come together. You need to have the cold air coming out of parts of eastern Canada. You also need to have the Labrador Current coming in from the north. Then you have the Gulf Stream meeting up. Cold air, warm air. Recipe is in the water. Well, that cold air - warm air starts to develop a low-pressure system, just like our latest system forms off the Carolina coast and then makes its way to the Northeast very quickly. And on its left side, we see very heavy rainfall. Sometimes, if the air is cold enough, it'll be snow, very windy conditions. The worst weather tends to be on the west side of the storm and within about a 150 to 300 mile to the west of that track.
So again, this latest system moving on through is certainly going to be having an impact in the Northeast. That Gulf Stream, still with water temperatures easily above 70 degrees, well offshore from the US East Coast.
I'm Rob Koch.
Video: Satellite View of February Nor'easter (0:45)(No Narration)
In this silent animation produced by NASA’s Goddard Space Flight Center using NOAA’s GOES satellite, you can see how a nor’ easter formed in February 2013 when New England and much of the U.S. Northeast was impacted by heavy snowfall, ice, and high winds.
By carefully watching this video, you can follow water vapor that originates in the Gulf of Mexico and a series of cold fronts that move east from the central U.S. As this water vapor moves off the mid-Atlantic, the air masses collide and intensify into a well-organized counter-clockwise rotating low-pressure cell that brings much of the moisture at high altitude back over land from the northeast. As the center of circulation is located along the New Jersey coast, the rotation brings intensive winds out of the northeast to the New England coastline.
Module 5 Lab
Module 5 LabThis short lab will help you hone your skills for predicting whether a hurricane is likely to develop or not, and where it might go. As we have learned, there are many factors that control whether a storm develops and its ultimate path, but here we will focus on sea surface temperature (SSTs), wind shear, and pressure. Here are the basics: for a storm to develop you need some type of disturbance, SSTs above 79oF (26oC), and for it to gain momentum you need low wind shear. Storms are steered by winds, this essentially being “deflected” or moving around areas of high pressure including the Bermuda high and towards troughs of low pressure. As we’ve said, it's more complex than that, but these are the nuts and bolts.
To hone your skills, we have set up a few practice questions. Go to Module 5 Lab (Practice). You can take this practice quiz as many times as you like and ask us questions if you don’t understand something. When you are ready, go to Module 5 Lab (Graded) to answer questions for credit. You will only get one chance at them. Again, this is a fairly short and simple exercise, but we truly hope it will help you predict the next storm!
Statement of Use of AI on Exams, Quizzes, and Labs
Summary and Final Tasks
Summary and Final TasksWe hope you have learned more about how storms form and the forces that control their movement. And why they can be so difficult to forecast. In addition, we hope you understand the elements of storms that cause damage in addition to wind: massive amounts of rain and storm surge. You'll be learning about some incredible storms and the damage they caused in the next module. We hope from now on, you'll stay tuned in the summer months to the National Hurricane Center.
They also have a great free app you can access on your phone through the App Store.
Reminder - Complete all of the Module 5 tasks!
You have reached the end of Module 5! Double-check the Module 5 Roadmap to make sure you have completed all of the activities listed there before you begin Module 6.
References and Further Reading
The following links are meant to provide suggestions for further investigation into some of the topics covered in Module 5 (some of these are from the module).
Module 6: Hurricane Stories
Module 6: Hurricane StoriesIntroduction
The 2005 hurricane season, in which Hurricanes Katrina and Rita devastated much of the northern Gulf coasts of Louisiana, Mississippi, Alabama, and parts of Florida, went down in history as the most destructive and expensive hurricane season in US history. After a 12-year period of relative calm, punctuated by Hurricanes Sandy (NY/NJ), Ike (Texas), and Gustav and Isaac (Louisiana), along came the 2017 hurricane season, in which Harvey, Irma, Maria, and Nate devastated many Caribbean islands, the coasts of Florida and Texas, and damaged other areas along the Gulf coast. The combined effects of the 2017 storms dwarfed even the 2005 storms, which at the time seemed like an unbelievable nightmare to those affected. And then came the monster Dorian in 2019 which dwarfed them all!
These catastrophic storms leave indelible marks on the communities they impact. People measure time relative to the storm – hence the common pre-Katrina and Post-Katrina references in New Orleans. They shape the way people live, build their homes, schools, businesses, and infrastructure.
Although Katrina is now more than a decade ago, it is still considered a landmark event that re-shaped the way our society thinks about natural disasters. Since Katrina have come Hurricanes Sandy, Isaac, Irma, Maria, Harvey, and many other catastrophes in the U.S. and around the world. Each of these disasters has provided lessons in resilience. Repeated disaster has an effect of putting stress on the resources designed to help communities recover.
These catastrophes have also shaped policies that are informed by these experiences. However, these policies are not perfect. Millions of people are still living in harm’s way, and local memories fade with time. Gradually, the wisdom gained gives way to reckless building practices, among other things. Billions of dollars are spent on protective engineering structures to protect the most valuable infrastructure and population centers. But some communities inevitably remain unprotected.
In Module 6 we will look at these events from the perspective of the communities affected; looking at case studies provided by New Orleans and the Gulf Coast, New York and New Jersey, Miami, Houston, Puerto Rico, and other Caribbean islands. We will ask – are we learning to live with increasing storm impacts by building more resilient cities? Or are we repeating old mistakes again and again? We hope, in this module, you will learn about the science of coastal catastrophes, but also gain an appreciation for how hazards like hurricanes and tsunamis have the capacity to do so much damage and take so many lives. Likewise, we hope that you will be able to, throughout the remaining modules, understand the societal consequences and some possible ways forward that reduce our risk and improve our resiliency to coastal hazards.

Goals and Objectives
Goals and Objectives- Students will continue to develop the fundamental geospatial skills and concepts needed to assess the coastal processes and hazards discussed in this course.
- Students will develop an understanding of the relationships between the atmosphere and hydrosphere that result in the development of cyclones.
- Students will consider current shoreline processes in the context of cyclones and past and present evolution of coastline morphology.
Learning Objectives
By the end of this module, students should be able to:
- describe the atmospheric conditions that are required for the formation of tropical and extra-tropical cyclones;
- analyze case studies of how coastal systems are impacted by geologic and climatic hazards such as cyclones;
- investigate geomorphological changes that result from cyclones.
Module 6 Roadmap
| Activity Type | Assignment |
|---|---|
| To Read | In addition to reading all of the required materials here on the course website, before you begin working through this module, please read the following required reading to build some required background knowledge on historic storms:
Extra readings are clearly noted throughout the module and can be perused as your time and interest allow. |
| To Do |
|
Questions?
If you have any questions, please use the Canvas email tool to contact the instructor.
Instructors’ Personal Hurricane Stories
Instructors’ Personal Hurricane StoriesHurricanes are very personal for us. Dinah lived through the calamitous Hurricane Katrina in New Orleans in 2005 and Tim was literally a first responder after Hurricane Andrew struck Miami in 1992 and lived through the much less severe Hurricane Fran that hit North Carolina in 1996. We start this module with these personal stories before moving to describe several of the most significant recent storms in detail. Each storm has lessons to tell about how our society deals with national disasters, what storms will be like in the future, and what we need to do to prepare for them.
Dinah’s Experiences
Years of evacuation preceded Hurricane Katrina in New Orleans. These included Hurricane Georges, Hurricane Ivan, and others for which New Orleanians packed up their cars and headed to wherever they had a safe haven. If you did not have relatives and friends in places within driving distance that were safe, or you didn’t have a reliable car, you stayed. I had packed up my daughter and dogs and headed with friends to places like Lafayette for a three-day trip and then returned to an unscathed city on several occasions. Hurricanes on track to impact New Orleans had a habit of making a northerly turn as they approached the Mississippi River delta and hitting the Mississippi coast instead of Louisiana. We were all armchair hurricane experts by the time Katrina entered the Gulf. At the University of New Orleans, I worked with a network of coastal scientists, some of whom were actual hurricane experts, including my boss, the late Dr. Shea Penland, who was a renowned coastal geomorphologist and director of the UNO Pontchartrain Institute for Environmental Sciences. He had made a fateful prediction in the Scientific American Magazine the year before that it was just a matter of time before a storm surge would overwhelm the flood protection system and devastate New Orleans. I clearly remember our staff meeting on Friday, August 26, 2005, in which we discussed the storm entering the Gulf, and the need to retrieve boats and other equipment from coastal locations. It is hard to fathom now, but three days later, on Monday, August 29, Hurricane Katrina made landfall in Louisiana. The adrenaline-driven scramble to prepare for the impending storm is now a blur, punctuated by flashes of memories of moving computer equipment away from windows, moveable objects from yards, and conferring with elderly neighbors about their plans for leaving. After several days of exhausting preparation, during which I observed a general lack of urgency in New Orleans, I was ready to evacuate. I had noticed less boarding up than for Hurricane Ivan in 2004, and many acquaintances seemed almost blasé – I so clearly remember a rowdy crowd spilling from a daiquiri bar onto the street as I made my way home on Saturday night. There was a certain amount of bravado in not leaving. But then there were so many people who did not have any good choices, being without reliable transportation or no place to go to or being too frail or sick to choose for themselves. Neighbors and extended family formed support networks, but these efforts could not avoid the coming specter of tens of thousands of people seeking shelter in the Superdome and Convention Center after the storm flooded the city. The city neglected to plan a mass evacuation by bus prior to the storm.
I evacuated with my two dogs and a few belongings on Sunday, August 28th at around 4:30 am. I heard the Mayor of New Orleans announce the MANDATORY evacuation on the radio as I drove. This was way too late. Residents would have to at least have made their plans and be packing up to leave by then. Many already had, because we were so well trained to do so, but many were too cynical or had no choice but to stay put. Others did not want to leave their property unoccupied. But we were not uninformed. I took back roads to avoid the crush on the interstate. People reported taking four hours to reach Baton Rouge, a trip that usually takes a little over an hour. This was despite the use of contraflow on the interstate highways leading away from New Orleans and the Gulf Coast. I finally arrived in the small town of Walker, to the east of Baton Rouge, where my colleagues had been gathering. There, our business manager, Karen Ramsey, and her husband had a home that could accommodate quite a few people. But I arrived too late - there was no room at the inn. I traveled on to share an off-campus LSU dorm room in Baton Rouge with my daughter, literally timesharing her bed, with the dogs sleeping underneath. The complex of student housing, which amazingly still had power, quickly filled up with evacuee families. I wasn’t sure where I was going to stay for the longer term but, I had enough friends in Baton Rouge that I was soon able to find kind people with a room where I could stay with my dogs for several weeks. The population of Baton Rouge exploded with displaced New Orleanians, which caused some tension. This was happening in cities across the South as half a million people had to find somewhere to stay.
The thing to remember about New Orleans is that it is surrounded by flood protection structures including levees and floodwalls, and the draining of the wetlands upon which the city was built has resulted in significant subsidence of the land elevation so that 50% of the land area within the flood defenses sits below sea level. The other thing was that in 2005, the levees and floodwalls, designed and built after Hurricane Betsy in 1965 to protect the city from a category 3 storm surge, were now almost 4 decades old. They were worn, had subsided, and had many flaws. We had been warned repeatedly via so many information channels that this was a recipe for disaster. The disaster slowly unfolded on Monday morning, but at first, many residents in New Orleans were unaware that it was happening. The cell towers had toppled with Katrina’s winds, so only landlines still worked. I was able to call my ex-husband before my cellphone went kaput on Monday morning. He had chosen to stay and was nonchalant at that point, oblivious to the encroaching floodwaters, which had by then broken through the flood defenses in many places, and the “bowl” of the city was filling up. I remember saying I thought it was a matter of time before the waters reached his house, and that is what happened. The real misery began after the storm itself had passed and moved north. People were trapped on rooftops or were wading or floating on debris through floodwaters trying to find refuge, with children, pets, and belongings in tow. It was blazing hot. Meanwhile, I was in the safety of Baton Rouge just watching in horror and feeling helpless and suffering from survivor’s guilt. I was able to travel to deliver cash I had collected before leaving New Orleans to a friend (how do you access your New Orleans bank account when everything is broken?) and go to a hotel lobby in a small Southwest Louisiana town to use their computer to add texting to my cellphone account so my daughter could locate her father. Not many people were using texting in 2005 and with cell towers down, for some reason, texting worked but calling did not. A family I talked to at the hotel were from St. Bernard Parish, southeast of New Orleans and devastated, and they did not know if members of their family were alive or not or how to reach them. My daughter was able to locate her dad who had made it out of New Orleans with dogs and cats; and she picked them all up in Baton Rouge. Many people and pets were not so lucky. Many ended up in shelters far from home and loved ones could not locate them. Children were separated from parents and elderly grandparents were lost in the chaos. Helicopters continually plied back and forth between Baton Rouge and other locations and the city, on rescue missions.
My first trip back into the city was on September 16. I clearly remember the unforgettable, indescribable smell as we got close to the UNO campus. My colleagues and I were headed there to pick up work vehicles and equipment to bring back to Walker to set up a temporary office for the Pontchartrain Institute. We needed a special permit to enter the city at that point. Although the city had been drained of floodwaters by then (using pumps shipped in from around the world), the entire population of over 480,000 had forcibly been moved out (by 2006 only about half had returned). We stopped to check on colleagues’ houses which had flooded to the roof and the contents jumbled around inside, covered with stinking mud. Dead fish lay in the streets. There was no power, so we had to feel our way up hot, dark stairwells to our offices where mold was already growing, making breathing hazardous. The National Guard had used our offices as a triage center and the campus was a processing center where people were shipped out to shelters. It was quite surreal. I remember looking out of a third-floor window at the downtown skyline and thinking how normal it looked from there, while the city as a whole was wrecked. The UNO campus sits on slightly elevated land on the shore of Lake Pontchartrain, next to the London Avenue drainage canal in which the concrete floodwalls had been breached and Lake Pontchartrain had poured into the low lying Gentilly neighborhood. It is worth repeating that 80% of the city had gone underwater and approximately 1,000 people had died (the exact number will never be known). My old neighborhood, where I had recently sold my home of 14 years had been deeply flooded. The neighborhood where was renting an apartment was fine because it was in Carrollton, an old part of the city on the natural high ground built by the Mississippi River. But on this occasion, I was not allowed to go to my apartment. We were there strictly on official business and we loaded up the trucks and drove back to Walker.
I was very fortunate to still have a job and an intact home, and eventually, we set up a place to work for a year in Walker. Our offices on the UNO campus were closed off for that duration. The fall semester, which had been so rudely interrupted by Katrina, continued in some fashion with online classes, but mostly it was a wash. Students scattered to other institutions to try to continue their studies, only slowly trickling back as accommodation was hard to come by. Residents of the city were able to return neighborhood by neighborhood in October, about six weeks after the storm. Most had to commute from outlying areas to begin work on their wrecked homes (remember the count of flooded houses in New Orleans alone was 134,000). The traffic was bumper to bumper from Baton Rouge to New Orleans with materials for rebuilding being shipped in. Recovery had to start from scratch. At first, the power supply was spotty and the infrastructure sparse, with few services such as groceries, doctors, etc. It was very hard to imagine how the city could possibly recover. I returned in November, having exhausted accommodation options, but still had to commute 1-2 hours to Walker to go to work.
One of the tasks I had in my varied job as a research associate after Katrina was to accompany a photographer who was working on documenting the aftermath of the storm. This took us to many outlying neighborhoods in St. Bernard parish as well as all over New Orleans. Shattered neighborhoods were silent and empty. Dried mud covered everything. Cars sat atop fallen roofs and household items and children’s toys were strewn across the landscape. This was before rebuilding began in earnest, but signs of activity were here and there. Homemade yard signs and sculptures made from the debris were evidence of the enduring humor of the south Louisiana people. Later the sounds of hammering and voices of the thousands of volunteers and day laborers who poured in to help rebuild filled the eerie silence. It was to be a long and difficult road to recovery and one of the many details that we could not fathom before the impending disaster happened, despite all the warnings. Year by year, for the first decade, New Orleans slowly became a fully functioning community. The levees were rebuilt and reinforced. The scars are still clearly visible with swaths of vacant land where there were once neighborhoods and shopping centers, but lives have been rebuilt and the city has moved on.
Hurricane Katrina Damages
Tim’s Experiences
I was literally one of the first people into Miami after Hurricane Andrew roared ashore on August 24th, 1992. I was on my way down to South Florida to fly to Cuba for fieldwork when I heard about the storm approaching. I had a seat on a charter flight, very difficult to obtain so there was no backing out or changes possible. The storm accelerated in the couple of days before slamming into southern Dade county leaving folks little time to prepare. I had lived in South Florida in the late 1980s and grew used to the days-long wait as storms approached, store shelves emptied out, windows were boarded up, only to see the storm veer off or weaken at the last minute. So it was easy to see how everyone was a little complacent in 1992.
Andrew formed over the Atlantic on August 16th, 1992 but very rapidly gained strength on August 23rd over the Bahamas. The storm made landfall in the early morning hours of August 24th near Homestead FL as a category 5 storm with sustained winds of 165 mph making it one of the strongest storms ever to make landfall. Gusts were over 175 and there were reports of gauges on boats recording 195 mph. The fact that the storm intensified so fast as it approached also increased the shock of the damage.
I packed my truck full of coolers, water, camping gas canisters, canned goods, and tarps, left Chapel Hill in the early afternoon of the 24th, and arrived in Miami in the early morning hours of the 25th. One good thing about a hurricane is the cops let you speed, I made 862 miles in just over 10 hours! The morning brought into focus the extent of the damage, but also how most of the heavily populated central and northern part of Miami had minimal damage and had really dodged a bullet. If the storm had gone just 10 miles further north the cost would have been far, far higher. But that was of no consolation to the communities that got hit, and hit very hard. In Kendall and South Miami, where I used to live, and in the Homestead, Cutler Ridge and Perrine areas the damage was unlike anything I had ever seen. It was like Andrew had mowed down the whole landscape, houses included. Almost every home had extensive roof damage, windows had blown out, and houses and pools were full of debris and sand. Some areas were worse than others with whole parts of homes completely destroyed. But the very worst areas were cordoned off by police and inaccessible. Almost every palm tree had lost all of its leaves and palm fronds were everywhere. Roofs of gas stations were now mangled metal and road signs and billboards were flattened. The sun was out and blazing, but power was out everywhere. People were in a daze and told harrowing stories of nights spent in bathtubs covered by mattresses only to emerge to see their homes almost gone. My supplies were happily accepted. I spent much of the next few days nailing tarps to roofs in the blazing sun before leaving for Cuba. It was amazing to leave powerless South Florida and arrive in the relative comforts of the communist country. My Andrew experience left an indelible mark on me, it made me in awe of the force of nature and fascinated by hurricanes and the threat they cause to coastal communities. From then on I became an avid storm watcher, glued to the Weather Channel when a storm was active and to the National Hurricane Center’s website. I’ve seen how sophisticated prediction has become, but, even then, there is still a lot of uncertainty which makes living in a coastal community very challenging in the summertime.
I experienced a hurricane up close, Hurricane Fran in Chapel Hill, North Carolina in 1996, although the storm was very minor compared to Andrew and Katrina. The storm was just turning seaward when I went to bed and the TV forecaster said “looks like we are out of the woods, folks” then the power went out. Imagine the shock then when a 150-foot red oak fell on our tin roof at 2 AM! The noise was deafening and woke me out of a deep sleep. Outside the wind was incredible and all I could hear was the snapping of trees then the boom as they hit the ground, tcshick-thud, tcshick-thud, tcshick-thud, tcshick-thud. They were snapping like matches! It was pitch dark and impossible to see anything and I was terrified (living through a storm is much worse at night believe me!). As I wandered around the house everything looked OK………until water started pouring through the light fixtures and terrified squirrels who came down with the tree and into the house came out of their dazes! Luckily we didn’t have to wait long to see the damage in the daylight, the huge oak tree had cut our roof in two, but fortunately hit the edge of the house so much of it was spared. It could have easily hit me when I was sleeping. Neighbors didn’t fare as well, whole pieces of houses were lifted out of their foundations by giant trees, people were trapped in their bedrooms, and cars were cut in half. Turns out the damage was done by microburst tornadoes spun off by the storm. Sustained winds in our neighborhood were about 60 mph but the tornadoes were over 100 mph.
After the storm came weeks-long rebuilding effort, eight hot days with no power, the constant buzz of chainsaws through the daylight hours, nights of curfew, haggling with the insurance companies. Within months things were back to normal, but the psychological scars were there for years, sleepless nights when thunderstorms came, worrying about which trees could fall and what direction they would fall in. The worrying would increase in summer as storms approached. But my Fran experience was nothing like what people who have lived through category 4 and 5 storms have gone through. And specifically what Dinah went through during and after Katrina.
Hurricane Andrew Damages
Hurricane Andrew: August 1992
Hurricane Andrew: August 1992Hurricane Andrew was a wake-up call for the US. Hurricane Hugo in 1989 had caused a massive amount of damage in Charleston, SC as a result of wind and a massive storm surge up to 6 meters (20 feet). But Andrew was the first major hurricane to hit a major metropolitan area in a long time, and it exposed glaring weaknesses in preparedness, especially building codes. The storm narrowly missed downtown Miami and Miami Beach, which would have led to truly catastrophic damage and many more fatalities. However, the areas that took direct hit including South Miami, Perrine, Cutler Ridge, and Kendall had seen rampant development over the preceding ten years so the damage was still devastating.
Hurricane Andrew
Andrew came ashore in the early morning of August 24, 1992, near Homestead with sustained winds of 165 mph, gusts of 177 mph and a storm surge up to 5 meters (17 feet). Fortunately, the storm had a very rapid forward motion of 16 mph so the maximum impact didn’t last that long, and the storm was quite compact, however, Andrew’s winds still wrecked a narrow trail of havoc. In 1992 development in South Florida was booming. Much of the western part of the Miami metro area is land that has been reclaimed from the Everglades over the past half-century, one of the most extensive and radical reclamation projects in the world. The Everglades is the largest subtropical wetlands in the world, aptly called “a sea of grass” by the famous naturalist Marjorie Stoneman Douglas. The wetlands naturally drain to the south, but this was changed in the 1950s to 1970s when drainage canals were constructed, supposedly to control flooding from hurricanes, and diverted the water to the west and east. The resulting changes to the natural landscape were nothing short of disastrous. Rapid urbanization has covered large areas of the former Everglades with concrete leading to flash flooding in storms, which undoubtedly made damage from Andrew more intense. As devastating storms like Andrew and sea level rise (Module 3) threaten coastal parts of South Florida, we are constantly reminded that the Everglades were not meant to be urbanized.
The other lesson from Andrew had to do with building codes. I remember from my time living in Miami in the late 1980s numerous sprawling developments with large, wooden framed and wood and plaster sided homes packed close to one another on meandering streets with pools, clubhouses, and other amenities. Country Walk was one of them, a particularly massive development of wood-framed houses, which now lives in Andrew infamy. Construction in Country Walk by the company Arvida was particularly shoddy and houses fell like match-sticks in Andrew. The damage was just catastrophic. Residents told harrowing stories of windows and doors exploding, walls toppling over and popcorn ceilings, and whole second stories collapsing. Many people sheltered in interior bathrooms only to have the roofs collapse on them. Almost no homes were left with roofs after the storm. 95% of the 1700 homes in Country Walk were completely destroyed. The difference between Country Walk and neighboring developments with more solid construction was stark. Most residents of Country Walk collected their insurance money and moved away, often out of state.
Investigations of Country Walk found gables that were not braced or connected to roofs, plus poorly connected trusses, sheathing, strapping, and tie beams. Pre-construction plans on models were not checked by structural engineers and inspectors were found to have cut corners because of heavy workloads and many were just doing drive-bys instead of inspecting homes closely.
Video: Hurricane Andrew - Tamiami Airport/Country Walk (19:37) (Video is not narrated.)
This video shows the devastation of Country Walk.
Country Walk was not the only development with severe damage from Andrew. The storm basically exposed all poor construction. In light of this damage and with a view towards the stronger storms of the future, South Florida counties instituted very strict building codes. Code in the so-called “high-velocity hurricane zone” where “basic wind speed” (a measure of the recurrence of strong storms) is over 180 mph, including Miami-Dade and Broward counties, requires new construction to be a wind-resistant design, including windows, doors, and eaves. Hurricane shutters are mandatory in all parts of the state where the basic wind speed is over 120 mph. The performance and installation of shutters are very strict. However, regulations other than shutters vary from area to area and are constantly under attack from the construction industry, so who knows what the future will bring. One last aspect of living in a hurricane-prone area is crazy expensive insurance. Rates for insurance depends on the number of hurricane improvements a home has but can be up to $8,000 a year for a home valued at $150,000!

Video: Hurricane Andrew - Miami-Dade County, Florida - August 23-24, 1992 (8:18) (Video includes people talking, but is not narrated.)
This video summarized the power of Andrew.
Video: Then and Now: Scenes from Hurricane Andrew (11:39)
This video provides a more personal glimpse of the impact of the storm.
Then and Now: Scenes from Hurricane Andrew
[MUSIC PLAYING] C.M. GUERRERO: Hurricane eve, August 24th, and it's like around 3:00 morning. And it's getting louder and louder and flying projectiles all over the roof. And it's getting louder. And the next thing you know, sounds like it's a train, a locomotive above, and machine guns, bombs going off. That's what it seemed like anyway.
It was so noisy. It was so scary. It was absolute devastation. Pure destruction.
Rounded the corner off US1 and Palm Avenue, there was a trailer park there completely gone. And out comes this guy out of the woodwork from all this broken trees and branches. And I kind of focused on him. But this man was purely dazed and confused in his underwear and ankle-deep water. Nobody knew what hit us, including myself. It was quite a horrifying experience.
CARL JUSTE: After Hurricane Andrew, Harris Fields turned into a relief camp. With US soldiers sliding down the embankment of the tents as they scurry to build a little mini city for those who are devastated by the storm. Children gathering, playing, and do what children do. They wait to rebuild their lives.
That made me question, are those the same feelings that refugees feel when they come to this new city? I think back and ask the question, now, do these Americans understand? Do they understand the urgency for normalcy? Do they understand the value of cold and clean water? Do they understand that their life has changed?
I understand. And I think Hurricane Andrew has taught us people to be more understanding. And it's clear that for a brief moment Miamians became tent people. For a brief moment, Miamians understood what it is to be a tent person, to be displaced. I understand.
PETER ANDREW BOSCH: I was headed down south, dodging telephone poles, downed wires, downed trees. And I was headed down south of Country Walk. And I came across a trailer park that, well, it was a trailer park. By the time I got there, it was nothing but debris flying and gone.
And I got out of my car, started walking through all this rubble and everything. And there was a little girl, probably about seven, eight years old with her mother running down the street holding this little cat. And she was just crying. And they both had just looks of despair in their face.
And they had left the park along with everybody else, but they couldn't find their cat. So they had returned. And luckily, they had found the cat. And it was still alive. Could not believe the devastation. It was just like God put his arm down and just wiped it all out.
MARICE COHN BAND: We were riding around in the back of a pickup truck that was delivering water and supplies to people who had been without electricity and water for over a week. And at this point in time, the trucks were being stormed by the neighborhood people. As soon as they'd hear we were there, they would surround the truck. And it was so unmanageable that the people felt like they had to carry weapons with them just to keep the crowds controlled.
They were living in rubble, basically. The majority of the houses were reduced to matchsticks. And they were beginning to put together the tent city where they were living. And I think that they felt more desperate than the rest of Miami.
C.W. GRIFFIN: I met Marjorie Conklin at the Gold Coast Mobile Home and RV Park in Florida City a few days after Hurricane Andrew had impacted South Florida. I returned later that afternoon to photograph her, only to find her taking a heavenly reprieve from the unrelenting heat. She was soaking in a tub of cool water.
Weary from an individual near her demolished double wide mobile home, she spoke for most survivors saying, we're alive and well. The rest is just stuff that can be replaced.
CHARLES TRAINOR JR: My assignment for The Miami Herald was to go to Nassau and meet Hurricane Andrew there. Not much happened. Went back to the hotel room in Nassau and turned on the TV. And right there on CNN, South Florida was just leveled. So we turned back and immediately went to work covering South Dade.
And the first day driving back from South Dade back to the Herald, Old Cutler, about 180th Street, I drove by this canal. And I noticed this research vessel on the banks of the canal behind this house. And it was spoke to the power of the storm to be able to pick this vessel up and put it there.
PATRICK FARRELL: It was scary. It was pitch black. There was no lighting in the intersections.
And we happened upon this family living outside their family-owned Days Inn. And these kids were sound asleep, probably just because they were so exhausted. And it was kind of still a very eerie situation down there and scary.
Folks were worried about looters and were armed. And Donnelly and I were even a little worried about approaching people at that time of night because they couldn't see you approach. And we didn't want people to think we were looters.
So anyway, I had made this photograph 20 years ago. And I went back to visit the Days Inn just recently. And I walked in. And I talked to the guy at the front desk. And he says, oh, Izzy Hatem just sold this three months ago.
So they had actually persevered and raised their kids in Homestead. And the kids are, of course, you know, probably in their late 20s, early 30s. They're out of the house. But they persevered and stayed there and rebuilt. Up until three months ago, they were still there.
TIM CHAPMAN: When I flew over Country Walk to photograph the damage we'd heard about, I was expecting something, but it was much worse than I even imagined. All the roofs were gone. Trusses were exposed. There was no bracing.
The design flaws of flat surfaces, no hip roofs, it was just a prime example of the intense building in the '70s and '80s without proper inspection. And it showed a lack of will on the population of South Florida to build strong. And although we've improved our building codes tremendously, if we slack off on inspecting those and having the will to build strong structures, it'll happen again.
CHUCK FADELY: Cauley Square was a collection of antique shops and tea rooms. And they had this beautiful canopy of trees over it, little historic wooden cottages. And after the hurricane, the trees were all bare. The buildings were torn up. And this woman was walking down the street, bent over, feeling the full weight of the storm, and what had it done to the little shops.
AL DIAZ: I arrived at Loren Roberts' apartment. There's I don't know, several hundred, 1,000 people there. And then this food truck pulls up from with donations from the Florida Jaycees. And you know, all hell starts to break loose. And people start scrambling to get in line.
And the Florida Guardsmen had to contain order and keeping everyone in an orderly fashion lining up for the food. So it was pretty chaotic. And you could see it in people's eyes how desperate they were.
I mean, three days without food, you know? Whatever you got in the fridge, if you're living in a trailer, there's no trailer to go to. There's no place to go.
MARSHA HALPER: 15 days after Hurricane Andrew, I was driving slowly around Florida City still on marked streets. I was surprised to find one shop open for business.
Juan Dominguez's Florida City barbershop, which he had bought the year before, was open, despite no windows and no electricity. The backdrop was desolate. And here he was actually doing a business.
His customers included locals and some military folks who were in South Dade County, then known as Dade County, to help in the cleanup efforts. Dominguez charged $6 a haircut. And he said that he vowed to bring his business back to how it was before the storm.
Today, if you go there, you see a beautiful five-chair shop. The Royal Poinciana tree outside is fully grown back and blossoming beautifully. And Dominguez charges $10 a haircut and says he still has customers from even before Hurricane Andrew.
At the back of Juan Dominguez's shop near the chair he uses for customers is a small framed yellowed newspaper clipping. It shows the photograph that I took in 1992 of his shop after Hurricane Andrew. And Dominguez said he vows to keep that up until he closes up shop.
[MUSIC PLAYING]
There is no doubt that South Florida is much better prepared than it was in 1992. And there is also no doubt it will need to be.
Hurricane Katrina: August 2005
Hurricane Katrina: August 2005
Hurricane Katrina’s historic impacts on New Orleans and Gulf Coast communities in Louisiana, Mississippi, and Alabama in 2005 serve as an important reminder of the destructive forces of hurricanes, most notably from storm surge. Katrina’s storm surge was so destructive that most gauges broke during the storm, making it difficult to get actual measurements. High-water marks in eastern Louisiana and western Mississippi indicate that the maximum surge was close to 9 meters (30 ft.).
In New Orleans, the failed levee systems allowed billions of gallons of seawater to flood 80% of the city, as well as some suburban areas. The mayor called for a mandatory evacuation approximately 24 hours before landfall. This was not enough time for many people to make necessary plans, and a large portion of the population of New Orleans was living in poverty and had no means of transportation, while others did not heed the evacuation order for a variety of other reasons. After the initial partial evacuation prior to the storm, the entire population eventually was evacuated from the city following the flooding. For many families, the evacuation dragged into a long-term or permanent situation because they had no home or jobs to come back to. Tragically, families were dispersed, or family members lost. Meanwhile, outside the levee system, there were areas that were completely destroyed, especially to the east of New Orleans and the Mississippi Gulf Coast communities from Bay St. Louis to Biloxi. Katrina will have lasting effects on these communities for decades to come. So, how is it that this storm became one of the most significant global storms in a century?
Scientists from NASA's Goddard Space Flight Center produced an excellent short video (3:03), "Katrina Retrospective: 5 Years Later," that explains many details of the storm’s development and path. Data from numerous weather satellites were compiled to produce these magnificent 3D animations that illustrate exactly what happened before, during, and after the storm. In the video, you will notice the role of warm surface waters in the Gulf of Mexico as they contributed to increased rates of atmospheric uplift, which resulted in strengthening the storm. You will also see how the bands of precipitation moved across the region and the distinct wind patterns that moved the storm over Florida, out into the Gulf and eventually steering it right toward the eastern tip of the boot of Louisiana, and southern Mississippi.
Video: Katrina Retrospective: 5 Years Later (3:04)
Katrina Retrospective: 5 Years Later
Required Reading
Please read from NOAA – A short summary of the meteorological impacts of Katrina: "Extremely Powerful Hurricane Katrina Leaves a Historic Mark on the Northern Gulf Coast - A Killer Hurricane Our Country Will Never Forget".
The Times-Picayune newspaper produced an excellent interactive map-based time-series animation of the impact of Hurricane Katrina as it came ashore. Anatomy of a flood: How New Orleans flooded during Hurricane Katrina tracks the flooding from levee and floodwall failures as they happened. Each scene includes pop-up dialogue boxes that will guide you through the storm. As you work through the scenes, play special attention to the areas that became flooded (shaded in blue) and the areas where levees were compromised and breached, either due to poor construction and failure or surge levels that overtopped them. Note that the water flowed into the portions of the city that lie below sea level and filled the shallow “bowl” with up to 15 feet of water. In the end, the only areas that sustained little, or no flood damage were located on the natural levees of the Mississippi River or the artificially-created higher ground near Lake Pontchartrain (location of the University of New Orleans).
The storm made its second landfall at Buras, Louisiana (it had already made landfall in Florida before entering the Gulf and strengthening). After crossing the Mississippi River bird’s-foot delta and entering the shallow bays including Lake Borgne in Louisiana and Mississippi Sound near the state line with Mississippi, it made its final landfall near the state line and delivered its historic storm surge to the coastal areas of both states. Water was pushed into the shallow bays, including Lake Pontchartrain and Bay St. Louis, with disastrous consequences. The storm left a trail of destruction, the magnitude of which is hard to imagine without seeing it for yourself.
New Orleans and the low-lying communities to the east that took the brunt of Katrina’s storm surge were essentially crippled for months. It took weeks to pump the water out of New Orleans, as all the pumps that usually drain the city were damaged by the flooding. Pumps were brought in from around the world to drain the city. All that remained of some communities were concrete slabs and pilings. The cities, including the entire city of New Orleans, were without basic services such as power, water, and sewage treatment. Without these utilities, the residents could not return to their homes. Many stories are still told of survival and heroic rescue efforts, as well as people managing to survive by camping out in their wrecked properties during the sweltering September heat following the storm.

Superstorm Sandy: October 2012
Superstorm Sandy: October 2012Sandy, technically Superstorm Sandy because it merged with another low-pressure system before making landfall in the US, was the largest hurricane ever reported with a diameter of 1400 kilometers (1000 miles)! The storm is known for the damage it inflicted on the New York City region, costing a total of $65 billion. It was notable for two main reasons in addition to its size: first, because it was such a late storm, making landfall on October 29th, 2012, and second because it traveled so far north of typical hurricane country before hitting land.
While a hurricane, Sandy inflicted massive damage in Jamaica, Haiti, the Dominican Republic, and Cuba. In Haiti, the storm was especially destructive and responsible for at least 50 deaths. Sandy had a northerly path and after crossing Cuba and the Bahamas, the storm went out over open waters for several days before taking that dramatic left turn due to its interaction with the low pressure and slamming into the New Jersey coast near Atlantic City.


Coastal communities had plenty of time to prepare. New Jersey forced mass evacuations in low-lying areas, and New York City closed bridges and tunnels and covered subway openings. Sandy’s winds at landfall were 80 mph with gusts up to 90 mph, but most of the damage was done by the storm surge, which measured up to 3 meters (9 feet) in New Jersey and 4 meters (14 feet) in Lower Manhattan. Some areas received a foot of rain. The surge flooded city streets and the subway, including traffic tunnels under the river. Raw sewage was also released into city streets and tunnels. Most of New York City lost power for days. Flooding also occurred along the waterfront on the New Jersey side, with devastating flooding in Jersey City and Bayonne. The New Jersey shore bore the brunt of the damage, with whole towns ravaged by the storm. Close to 350,000 homes were damaged and 22,000 permanently destroyed. This destruction was largely flooding, with wind damage at the shore. Significant beach erosion occurred with on average 9 to 12 meters (30 to 40 feet) of shoreline removed by the storm and Sandy carved new temporary inlets along the shore. Up to a meter (4 feet) of sand was dumped on barrier island streets. Piers collapsed into the ocean. The damage was so extensive in some locations that residents were not allowed back for months. In all, 24 states were impacted by Sandy and there were 71 deaths in nine states. A total of six million people were without power right after the storm. At the time it was the second-costliest hurricane (after Katrina) but has now been surpassed by Harvey and Maria.
Hurricane Sandy
These videos show the damage after Sandy
Video: Hurricane Sandy: As It Happened (7:40)
Hurricane Sandy: As It Happened
Text on the screen: Week One Thursday, Oct. 25. Will Hurricane Sandy Become a Halloween Franekstorm?
Eric Holthaus, WSJ Contributing Meteorologist, Viroqua, Wis. via Skype: This is actually the storm that's gonna be merging with Hurricane Sandy to form the frankenstorm.
Text on the screen: Friday, Oct. 26
Male reporting: Hurricane Sandy hammered the Bahamas early Friday after leaving 21 dead across the Caribbean.
Text on the screen: Hurrican Sandy Kills At Least 20 in Carribbean; On Path For U.S. East Coast
Male reporting: Some are calling it a superstorm, what is that all about?
Eric Holthaus: As this storm moves farther north it will expand. It's just really moving into a question of where.
Text on the screen: Saturday, Oct. 27
Governor Christie: This morning I formally declared a state of emergency in anticipation of Hurricane Sandy. We should not underestimate the impact of the storm and we should not assume the predictions will be wrong.
Mayor Bloomberg: The MTA has announced that they will start shutting down service, the subways starting at 7:00 tonight, buses at 9:00 tonight.
Adam Marcus, Long Island resident: This guy at the beach was saying that all this is all for nothing. Guy says, in 40 years I've lived here nothing has happened. And this could be the one time.
President Obama: Look at it as a serious and big storm.
Governor Christie: If something looks like it's stupid to do, it is stupid. Staying on the barrier islands for 36 hours of hurricane-force winds of 75 miles an hour or more sustained, not gusting, is stupid.
Text on the screen: East Coast Braces for Hurrican Sandy.
Wendy Bounds, Wall Street Journal News Editor: Tens of thousands of people were ordered to evacuate coastal areas on Sunday from Maryland through Connecticut, as hurricane Sandy prepared to make landfall Monday or early Tuesday.
Text on screen: Monday, Oct. 29
Man reporting: There's a shot of Atlantic City, New Jersey this morning as Hurricane Sandy is on her way. Stock and options markets are closed today. Thousands of flights have been canceled. Earnings reports are being delayed and, like I said, Sandy isn't even here yet.
Woman reporting: The East Coast grinding to a halt as Hurricane Sandy prepares to make landfall. What are the major steps you should be doing to protect your home and the belongings from damage from flooding?
Woman responding: Well, everybody should have a go kit and everybody should have a plan as to where they're going to evacuate to and let relatives or friends know where it is that you're going.
Text on screen: Keeping Pets Safe in Hurricane Sandy
Alison Jimenez, ASPCA Senior Media Manager: Just like people were doing, we wanted them to make their preparations early. Start thinking about putting aside some of their pets food, some clean water for their pets for drinking, their pet's medications, their pet's medical records.
Man reporting: Two crew members are missing from the HMS Bounty. It was a tall ship. It has sunk.
Man reporting: Well, that is a live shot of a crane here in New York City.
Text on screen: Crane Dangles from NYC Luxury High-Rise
Man reporting: It has flopped over.
Mayor Bloomberg: This is a massive storm.
President Obama: The most important message that I have for the public right now is please listen to what your state and local officials are saying. When they tell you to evacuate you need to evacuate.
Text on screen: Tuesday, Oct. 30
Woman reporting: The East Coast wheeling this morning as it absorbs the aftermath of superstorm Sandy, where economic damages could be in the range of 10 to 20 billion and at least 30 people have been killed. In seven states, more than eight million homes are without power and in New York City the wounds are particularly severe. In the borough of Queens between 80 to 100 homes caught fire last night and were destroyed. Public transportation, meantime, continues to be closed after extensive flooding. There is no timeline on when that will change.
Governor Christie: The level of devastation at the Jersey Shore is unthinkable.
Liz Heron, WSJ Social Media Director: People did have access to information that was still going on. A lot of people were getting tweets. There's ways you can get tweets without actually having internet or being on Twitter. Because everyone has a smartphone, they're taking a lot of photos.
Woman: Everybody's a reporter now.
Liz Heron: Exactly. Um and you know, there was incredible images being shared.
What are the problems, we're trying to assess damage at this stage?
Josh Mitchell, Dow Jones Newswires Reporter: Well there's two types of damage we're talking about here. One is property damage. So how much damage is there to people's homes, to office buildings, to roads, to the subway system that gets people to work.
Text on screen: Wednesday, Oct. 31
Woman reporting: Millions are still without power as the East Coast struggles to recover from Superstorm Sandy. At least 55 lives have been claimed so far in the U.S. Here in New York, Manhattan is beginning a difficult recovery process, with paralyzed transportation services and power outages. You can just see massive paralysis coming to the city.
Man responding: Yeah certainly. I mean the city's just not set up to have everybody who needs to work here drive in.
Mayor Bloomberg: You have to have three people in the car. Bottom line is the streets can only handle so much.
Male reporting: President Obama and New Jersey Governor Chris Christie surveyed storm damage across the Garden State.
Governor Christie: When all of you look around, you see all this destruction, that's fine. But you know what? All that stuff can be replaced. You look to your right and to your left, to your husband or wife, your son or your daughter. All right, those are things that can't be replaced.
Text on Screen: Thursday, Nov. 1
Woman reporting: Day three of Superstorm Sandy recovery and the death toll has risen to at least 72, nearly half of those in New York City where fires still smolder in Queens and there are reports of looting in Brooklyn and Long Island. Meantime tens of thousands of people in the Northeast are battling traffic, gas lines, limited public transit to return to work this morning.
Simon Constable, Wall Street Journal Columnist: Superstorm Sandy likely delivered insurance companies a twenty billion dollar bill.
Mayor Bloomberg: Recovery is underway and New York is starting to build again. The inspections of the crane on West 57th Street are complete. We plan to reopen public schools for classes on Monday. The MTA really did a phenomenal job of getting subway service partially restored in just a few days.
Text on screen: Friday, Nov. 2
Woman reporting: The governor was just speaking and it looks like some relief is going to be on the way for New Yorkers and people in New Jersey.
Governor Cuomo: Look it's been, it's been a long week. It has been a long week for everyone. It's not over. There are still inconveniences but it could have been a lot, lot worse. And let's not minimize what we went through. You know sometimes we can have a short memory. After the storm we went through on Monday, everything shouldn't be back to normal by Friday. It's going to take time
Video: Most dramatic footage of Superstorm Sandy (3:15)
Most Dramatic Footage of Superstorm Sandy
President Obama: This is a serious storm and it could potentially have fatal consequences.
Governor Christie: We have reports of five feet of water in some places in Atlantic County, significant flooding in Cape May County and in Ocean County. Now everybody thinks they're smarter than we are here, and maybe they are, but not about this.
Male reporting: If you're in your home or somewhere safe where you can remain, stay there.
Woman: Uh oh. Uh oh.
Second Woman: Oh my God!
Third woman: My tree!
Man: We have major complications going up the block. We've also got five buildings, three of them collapsed.
Male Reporter: Stay indoors and certainly away from the parks, the beaches, the boardwalks piers, and sea walls.
Woman Reporter: In Midtown, a crane at the top of a luxury high-rise collapsed and dangled frighteningly in the wind.
Woman: I don't know what's going on (inaudible) What the hell is this? Something just exploded.
Woman: It looks like a doll's house, you know a multi-level dolls house that you're looking into, but it's an actual building
Woman reporting: Toppled trees all around the city, this one blocking a street near Washington Square Park.
Male reporting: For most of the people who stayed off the roads and particularly all of those who got out of Zone A. when we ordered everybody to get out, you made the right decision and we're just going to get through this the way we always do.
Woman reporting: Practically no streets left that makes this point accessible. There are fires burning in the area and for first responders to get there has been completely cut off. We are hoping there are no people still in these homes because there's not much left.
Governor Christie: I didn't expect we would see homes, you know, off of their foundations and in the middle of state highways.
Male reporting: Make no mistake about it, this was a devastating storm — maybe the worst that we have ever experienced. MTA CEO Joe Lhota has described this as the worst disaster the agency has seen in the 108 years the subways have been running. All major airports serving the metro area are closed today. Runways are flooded and there are no flights leaving or arriving.
Governor Christie: We have a long road ahead of us, but I have complete confidence we're going to come out of this better and stronger than before. The state is too tough to give in to this type of devastation. And we in the government will be here to work with you to have New Jersey completely recover.
President Obama: Our thoughts and prayers go out to all the families who've lost loved ones. Unfortunately, there have been fatalities as a consequence of Hurricane Sandy. Obviously, this is something that is heartbreaking for the entire nation. I want you to cut through red tape. I want you to cut through bureaucracy. There's no excuse for inaction at this point. I want every agency to lean forward and to make sure that we are getting the resources where they're needed as quickly as possible.
There are many lessons from Sandy. The New Jersey coast is one of the most developed shorelines in the world, with a booming real estate market. The shore has been developed since the 1940s, originally with small and simple family cottages. However, over the last 20 years or so, small homes were bought out in many areas, bulldozed, and large luxury mansions were built in their place. The shoreline contains billions of dollars of expensive homes, often built too close to the shorefront. As we discuss in Module 10, a lot of the blame for this overdevelopment rests with federal and state governments, who resisted passing sensible flood control laws numerous times. This failure resulted in development in areas that flood frequently. The lack of flood control was exacerbated by the National Flood Insurance Program that repeatedly bailed out homeowners, local governments, and the state. The program is supposed to include controls over where rebuilding can take place, but regulation has been loose. Today, NFIP covers 70-100 percent of rebuilding after hurricanes. Environmentalists and others have pushed for much stricter regulation and an end to bailing out homeowners who build in risky locations, but developers and the construction industry have won out (see more detail in Module 10). These failures resulted in homes rebuilt in harm’s way, in some cases multiple times. Environmentalists warned about the devastating impact of a Sandy event for many years, and the storm proved them right. However, once again, the government paid for everything after Sandy!
Extensive damage in New York City was also a wake-up call. Low-lying downtown Manhattan and the waterfront on the New Jersey side of the Hudson River contains some of the most coveted real estate in the world and is a global financial center. Sea-level rise over the coming decades will make the area even more vulnerable to storm surge, with potentially truly devastating financial implications. For this reason, Sandy inspired renewed discussions about a major investment in flood control that would protect Lower Manhattan and the New Jersey waterfront from storm surge in a future Sandy. There has been considerable planning into what this structure might look like with the most extreme cases involving 8 kilometers (5 miles) of concrete and steel surge “gates” extending from New Jersey all the way to Long Island across the harbor and another gate along the west of Long Island Sound. Each structure would involve miles of shore fortification at the ends of the gates. The system would cost in excess of $120 billion.

Read the latest on the proposed system here in this New York Times article: The $119 Billion Sea Wall That Could Defend New York … or Not
The final lesson from Sandy is that climate change will cause powerful hurricanes to move further north and extend the season into October. It is still debatable whether Sandy was a result of climate change, though the Atlantic waters were warm unusually late in 2012. The New York metro area and the New Jersey shore have seen their share of powerful hurricanes, and Sandy may just have been a late-season anomaly. However, it is certainly reasonable with climate change to expect earlier and later storms and for stronger storms to make landfall further north. The large northeastern “megalopolis” extending from Washington DC to Boston and including Baltimore, Philadelphia, New York City is home to some 50 million people with $3.6 trillion in economic output per year. Sandy likely foreshadowed the future and this region better prepare for the eventuality of more large storms.
Typhoon Haiyan November 2013
Typhoon Haiyan November 2013Before we start, remember a typhoon is the same as a hurricane but in the western Pacific Ocean while a hurricane is in the eastern Pacific and Atlantic. We choose to discuss Typhoon Haiyan (also called Yolanda) because it was the most devastating tropical storm of the last century in terms of damage and death toll. The storm was also one of the most powerful ever with sustained winds of 195 mph and gusts up to 235 mph when it came ashore on the eastern part of Samar Island in the central Philippines. The category 5 super typhoon had previously hit the island of Palau and would go on to impact Vietnam and China, but it was the Philippines where most of the damage occurred.
Haiyan came ashore on the eastern Samar island on 7 November 2013. Damage on the islands of Samar and Leyte was absolutely catastrophic, but other islands including Cebu and Bohol were hit very hard. On Samar and Leyte a storm surge of up to 5 meters (17 feet) and waves up to 6 meters (20 feet) were recorded and rainfall up to 0.3 meters (a foot) fell in a day. The damage was just terrible in the low-lying Tacloban City where flooding extended up to a kilometer inland and 90 percent of the city was destroyed. Many people in Tacloban drowned in rapidly rising floodwaters, cars were tossed around like match-sticks, and debris was thrown everywhere.
Typhoon Haiyan
In all, more than 7360 people died, 27,000 were injured and 6 million displaced. 1.1 million homes were swept away or destroyed. Tacloban city more than 4,000 people perished. Overall
Please check the following news reports for stunning before and after pictures of damage in Tacloban City.
In the aftermath getting aid to the millions in need was hampered by the severity of the damage. Water and food were extremely scarce. People had to dig up water pipes just to survive and getting food was even more difficult. The Philippines are used to natural disaster with frequent earthquakes and typhoons, but completely misjudged the strength of Haiyan in the leadup to the storm. Many citizens did not evacuate and remained in low lying areas. For those who did, evacuation centers situated in flood zones turned out to be death traps. Police and medics were also victims so the response was extremely slow and lawlessness ensued. Tacloban was described as a war zone after the storm. Looting was widespread. The city became so dangerous that aid workers were urged not to go. When aid arrived it was poorly distributed, often according to political affiliation. Reports surfaced that food delivered to particular areas was deliberately buried so people could not get access to it. Tens of millions of dollars in aid were sequestered in government bank accounts. Over time international aid flooded in and distribution improved. many places homes were rebuilt from materials damaged in the storm, including battered corrugated iron, old blankets, and tires. But the storm also caused massive resettlement of citizens of the impacted areas as well as relocation away from coastal areas.
Overall Haiyan will be remembered as the most devastating storm of the last century.
Video: Typhoon Haiyan Documentary (20:21)
This documentary portrays the devastation caused by Haiyan.
Typhoon Haiyan Documentary
[MUSIC PLAYING] PRESENTER 1: This is probably one of the top 12 of all storms ever seen on this planet.
PRESENTER 2: [INAUDIBLE] Typhoon Haiyan has made a direct hit on the island.
PRESENTER 3: The storm plowed through the island, leaving homes and buildings destroyed.
PRESENTER 4: This monster storm, it is so big, it's affecting two-thirds of the country.
RICHARD HEARSEY: November the 8th, 2013, marked one of the most devastating events to hit the Philippines-- a disaster so terrifying that left a trail of death and suffering in its wake, and the city changed forever.
YOLANDA STERN: Of all the flood areas that I've ever witnessed since [INAUDIBLE] other places, I think this is quite a calamity.
ANDREW SCHROEDER: The city looks badly damaged. It's clearly much worse than I had thought before I came here.
RICHARD HEARSEY: Neighborhoods were demolished and left unrecognizable. Families were separated and forced to ride out the typhoon on their own. Water rose dangerously high, and some were caught in the current.
ATTY. ESCALONA: It was so devastated to see how tremendous was the damage to my neighborhood.
[NON-ENGLISH SPEECH]
RICHARD HEARSEY: Moments after the storm made landfall, a local man was placed in a desperate situation to save his family.
PRESENTER 5: [NON-ENGLISH SPEECH]
RICHARD HEARSEY: The tide came rushing into the coastal village. Time was running out. The situation was too much for one man to handle.
PRESENTER 5: [NON-ENGLISH SPEECH]
RICHARD HEARSEY: Typhoon Haiyan's landfall destroyed not only properties, but lives as well. Yolanda Village was one of the worst affected areas. Four cargo ships smashed the coastside village without warning. Some say bodies are still trapped beneath them. Surviving individuals are still traumatized by how much they lost in the storm.
PRESENTER 6: [NON-ENGLISH SPEECH]
RICHARD HEARSEY: Typhoons are a common occurrence in the Philippines. But Typhoon Yolanda was far from ordinary. The citizens of Tacloban underestimated the oncoming storm. Clinics and medical facilities were no exception to Typhoon Haiyan's fury.
JOY ABUYABOR: [NON-ENGLISH SPEECH]
RICHARD HEARSEY: Joy and her clinic was one of the worst to be hit. Floodwaters submerged the clinic. Black and murky water smashed in, and trapped Joy inside.
JOY ABUYABOR: [NON-ENGLISH SPEECH]
RICHARD HEARSEY: Joy survived, but the events of that day will haunt her forever. The loss of electricity and diminishing supplies worsened the city's conditions. And with no sign of help, the city fell into chaos.
ATTY. ESCALONA: And my wife and I saw lots of dead bodies just littered along the highway from here in [INAUDIBLE] towards San Jose. They did not have any communication at all. So there was this scarcity of food. People were forced-- some of the people were forced to loot. And the looting was rampant that the government was totally-- where there was total breakdown of government control, the looting.
RICHARD HEARSEY: After the storm had passed came the undeniable grief and loss of Tacloban's citizens. The situation is at its darkest. Many lost their lives and loved ones.
The worst affected of all are the children, one of which is Cesar, who lost his parents and siblings to the storm. Cesar's family was one of many caught by Typhoon Haiyan, unprepared for the harsh wind and rising water. Unfortunately, not everyone was lucky enough to survive. In just one day, Cesar lost those closest to him.
PRESENTER 7: [NON-ENGLISH SPEECH]
RICHARD HEARSEY: Cesar was saved and brought to the evacuation center, along with other survivors. The typhoon destroyed Tacloban. Fallen trees and debris were scattered along the streets. And worst of all, bodies began to pile up.
Cesar's family could not be found. Unknown to Cesar, his family had been swept away by the storm. Fortunately, his grandmother had survived the ordeal and found him.
PRESENTER 7: [NON-ENGLISH SPEECH]
RICHARD HEARSEY: After the storm passed and the waters receded, there was a bitter realization. The devastation caused by Typhoon Haiyan had left many scarred and homeless. Casualties had risen to thousands, and over three million families were affected.
[BELLS RINGING]
In Palo Tacloban, large holes were quickly dug to dispose of the rotting bodies piling up on the streets. Unfortunately, the mass grave could not be completed fast enough due to the continuous rainfall. Instead, bodies had to be layered on top of one another.
PRESENTER 8: [NON-ENGLISH SPEECH]
RICHARD HEARSEY: After five days, the first help arrived. US soldiers brought fresh supplies and medical care into the city. Soon after, various relief organizations from all over the world arrived in Tacloban City, providing much-needed relief and support.
ANDREW SCHROEDER: Well, our goal is to support the medical system here throughout the entire affected area, particularly in Tacloban. So what Direct Relief does is receive medical material donations from large companies, like Pfizer, Abbott, Baxter, what have you. And make sure that people get them on the ground that are the most in need so that they can put them to use in the recovery of the health system here.
RICHARD HEARSEY: It took months. But with the efforts of many kind people, the victims of Typhoon Haiyan are finally catching a glimpse of hope on the horizon.
PRESENTER 9: [NON-ENGLISH SPEECH]
RICHARD HEARSEY: There is still a long way to go. But many are optimistic for the future.
YOLANDA STERN: I think One World Institute is here to just find out from the mayor and the government officials and medical professionals, as well as the people that have been devastated here, what they really need in order to rebuild their lives. I think not only do they need shelter, they need a livelihood. They need a way to earn a living, so they can send their children to school, put a roof over their heads and food on the table.
RICHARD HEARSEY: United, the people of Tacloban stand not as victims, but as victors.
ANDREW SCHROEDER: Just that the international community, and to the degree that we're a part of it, has been an honor to help in this situation. And it's something where it's an unprecedented disaster for the Philippines. And we will continue to help, as long as our help is needed.
PRESENTER 8: [NON-ENGLISH SPEECH]
TOM STERN: Hello. I'm Dr. Tom Stern, chairman of One World Institute. Please join us later for part two of our documentary, which shows how these survivors were reborn. I want to thank all of you for your generous donations. And see you later.
[MUSIC PLAYING]
Hurricane Maria: September 2017
Hurricane Maria: September 2017Hurricane Maria spread wreckage across the Caribbean as she sped toward the island of Puerto Rico. The damage was truly catastrophic in Dominica, where the storm basically flattened scores of homes and flooded others. The photograph below shows just how terrible the damage was there.
Hurricane Maria
Guadeloupe, Martinique, Haiti, and the Virgin Islands also suffered widespread damage. But Maria is almost all about Puerto Rico. The storm made landfall there near Yabucoa on the southeast coast at 10 AM on September 20, 2017. The island was still recovering from Hurricane Irma, which devastated the nearby Virgin Islands and passed to the north of Puerto Rico, but still caused widespread power outages. After Irma, Puerto Rico sent supplies to the Virgin Islands, including water and tarps.
At landfall, winds were clocked at 155 mph, a strong category 4 storm. After landfall winds weakened but the eyewall grew during replacement leading to a larger area of damaging winds. Rainfall caused significant damage, up to 1 meter (38 inches) of rain fell in mountainous areas and much of the eastern half of the island received over 0.4 meters (15 inches). The ground was already saturated as a result of rain from Irma and so this water had nowhere to go. In one notable incident, floodwaters released from the La Plata dam rose up to 4.5 meters (15 feet), caused extensive flooding, and trapped several thousand people. The Guayataca dam was deemed to be at risk of collapse and tens of thousands of people had to evacuate. Flash flooding, mudslides, and landslides were common in mountainous areas, cutting off whole communities. A month after the storm only 640 kilometers (400 miles) of 8000 kilometers (5000 miles) of roads were passable, making getting relief to citizens difficult. Maria destroyed a total of 70,000 homes and damaged up to 300,000 others.

Please take a look at the stunning before and after images from The Guardian, "Puerto Rico six months after Hurricane Maria: then and now" highlighting the impacts and recovery in Puerto Rico. Note that although repairs were completed, most houses pictured have only temporary fixes and blue tarps for roofs.

One of the lessons from Maria was the failure of the power grid. The Puerto Rico power grid was antiquated and extremely vulnerable to a storm like Maria. Lack of funding and years of mismanagement and failure to maintain equipment, combined with damage from previous storms left the grid extremely vulnerable. The national power company, the Puerto Rico Electrical Power Authority (PREPA) was over $7 billion in debt when it filed for bankruptcy months before Maria. Immediately after the storm, the power grid went down for the whole island, leaving 3.4 million people without electricity. Even hospital generators failed. Almost all cell and landline service was down. 90% of the island was still without power a month after the storm, and two months later 1.5 million people were without power. In some places, it took 11 months to restore power! After Maria, the federal government set aside $2 billion to fix the power system, but PREPA has been in bankruptcy negotiations for the last two years, and an earthquake in 2020 again led to widespread blackouts, so problems persist.

Video: Puerto Rico after Hurricane Maria: 'We're American, too, why don't they help?' (9:49)
This video exposes the severity of the poor response to Maria in Puerto Rico
Puerto Rico after Hurricane Maria: 'We're American, too, why don't they help?'
Woman: Everything went like slow motion, like it was like the wizard of oz movie but backwards. You are in the rainbow in oz, the twister and then black and white everything destroyed.
Woman speaking in Spanish - translation: It was like the place had been deserted because there was no way to communicate or to find help. We didn't have water electricity or medicine. It affected our physical health, our emotional wellbeing, and our economy. It has especially affected our safety.
Narrator: Among the most dramatically damaged areas in the capital was La Perla, a small balio near the sea in San Juan. Many homes there were reduced to a roofless jumble.
Man: Puerto Rico remains in a state of crisis.
Woman: Maria. It was a great equalizer. Not for the right reasons. It has made us one.
Trump: I hate to tell you Puerto Rico, but you've thrown our budget a little out of whack because we've spent a lot of money on Puerto Rico and that's fine, we've saved a lot of lives. You can be very proud of all of your people, all of our people, working together.
Narrator: Hurricane Maria hit Puerto Rico last September. It was the worst storm to hit the island in over 80 years. Thousands of homes and businesses were destroyed. And the storm left millions without electricity and water.
Woman: It's horrible to be in that situation where you can't do anything.
Woman: It's very sad. Puerto Rico is destroyed.
Narrator: Puerto Rico is a U.S. Territory. It's citizens, who are Americans, have had to step in where the government has let them down.
Man: Hell. It's just been horrible.
Narrator: More than six months on, at least 150,000 people are still without electricity. And at least 200,000 insurance claims remain open. Vincent used to run a bustling cafe in the center of his village, an hour and a half away from San Juan, the capital. But after the hurricane hit, he was forced to close it down.
Vincent (speaking in Spanish) - translation: If you look here, you can see the damage. The problem is that the electricity only arrived three weeks ago. I can't have the lights on on this side. Because of the rain, they might short circuit. I only use these other ones. We didn't have water either. That stopped us from making or selling food as there isn't adequate hygiene. Up until today, the insurers have yet to visit my business. I've given them all the information and the damage has a value of $40- $45,000 dollars. I try to keep the basics to help the communities that have been left isolated.
Narrator: Vincent is one of the thousands of Puerto Ricans still waiting for insurance payouts. Businesses and organizations are only offered loans not government aid. And the lucky few that have private insurance, like Vincent, are seeing their claims stalled. Of the roughly 45,000 small businesses in Puerto Rico, thousands remain closed following the hurricane. FEMA, the U.S. agency in charge of disaster response, has been criticized by many Puerto Ricans. They say it is failing their island. At least 60% of the 1.2 million FEMA claims have been denied, often because claimants are unable to prove they own their own home. Others say they receive letters from FEMA in English, despite Spanish being the dominant language.
Woman speaking in Spanish - translation: It's been six months since the hurricane and we haven't had any electricity. We are still waiting for it. I fille din the FEMA forms. When they visited m place they took notes of everything I said, about the door, how the water came in, how it came through the ceilings and the bed. Then they sent a later saying I didn't qualify because the damage that we suffered was not connected to the hurricane.
Woman: The mayor of hurricane-ravaged San Juan, Puerto Rico, found herself subjected to a barrage of insults from the President of the United States.
Man: The president lashed out at San Juan's mayor. "Such poor leadership ability by the Mayor of San Juan, and others in Puerto Rico, who are not able to get their workers to help.
Trump: There's a lot of love in this room.
Mayor: And it's not coming from him. There's a lot of disrespect coming from him. The President was disregarding our lives. People were dying. People are still dying. But we don't even know how many people have died from the botched effort. The presumption is that funds are here. We haven't gotten one bloody cent. Only one percent of the population has received the maximum amount of $33,000. FEMA keeps putting these numbers out. Oh, we have given San Juan...you have given San Juan shit. So it isn't that they can't do it. It's that they won't do it. Why? Because our lives don't matter to them. The biggest humanitarian crisis that Puerto Ricans have lived under, for many years, more than 500 years, it's colonialism. It is a powerful weapon of domination on every front. It kind of makes you believe that perhaps you don't deserve to be treated appropriately. We need to be the great equalizers. All of these community efforts have to be brought up to the surface, so that they are not the outliers or something that happens, but that they are the way of life in Puerto Rico.
Narrator: Six months on, the most vulnerable people on the island still feel neglected. Charities say they registered a rise in violence against women as a result of the lack of security and electricity at night, leaving women fearful to leave their homes. One of these women is Sue Hay,
Sue Hay speaking in Spanish - translation: As a transgender person, I can tell you when this happened, the problems with safety were already there, from well before the storm. When the hurricane came these issues were amplified. I was honestly feeling helpless. I did not know whether I was going to wake up alive or simply not wake up. I check the rearview mirror to make sure I am not being followed, to check there aren't any strangers. If there are any strangers and I'm on my own, I'll go for a spin and wait for that person to leave the area, and then I can get to wherever I need to go, but much calmer. And now, one ca at least do their make-up because now there are lights. I survived Hurricane Maria. Great, I am now stronger.
Narrator: In the first month, following the hurricane, the number of 911 calls about domestic violence tripled. And due to the damage caused, many of the organizations that provide front-line services to vulnerable Puerto Rican women and children were forced to close. Only five shelters remain open on the island. One of them is Casa de Lebondad, which is run by Gloria. She is now fighting to change FEMA protocols before the next hurricane season so that the agency can provide them with aid rather than loans to rebuild the shelter.
Gloria, speaking in Spanish - translation: Nothing works here, not even the fans. See, there are no lights. But at Christmas, we still sat the children around the tree and shared the moment together. What is wonderful about what we do here is when we see the happy faces of the children and their mothers. But the lack of electricity for us creates a security problem. And when I mention this now, there's still this feeling of sadness because there are so many women who really need these services. Six months after the hurricane, it's been a great sacrifice, it has cost us many tears. It has cost us a lot of work.

Drinking water was also hit hard by Maria. Up to 50% of citizens had no running water for several weeks. Sewage treatment plants were inoperable for months. Maria wiped out 80 percent of the crop value in Puerto Rico, about $780 million, destroying sugar cane and fruit trees, coffee plants, and vegetables. The storm was particularly hard on trees, ripping off leaves, and stripping bark. One farmer described losing every single one of his 14,000 plantain trees. Row upon row of crops were destroyed. The island imports about 85% of its food, leaving it very vulnerable to a devastating storm like Maria, however before the storm small farming operations were increasing as were local farmers' markets. The loss of croplands combined with the slow response left citizens without food, hungry, and rationing canned goods. After Maria hit, a Federal Emergency was declared and FEMA assistance began with daily relief flights. The Navy deployed numerous ships to help in the relief. However, the scale of the disaster was daunting, hampered by poor communication and difficulty getting assistance to people who needed it, and the government has been criticized for underestimating the severity of the crisis. All in all the storm caused $90 billion in damage.
Estimating the death toll from Maria has been difficult. Officially, 64 people died as a direct result of the storm. However, power cuts, lack of drinking water, food shortages, and the extremely slow governmental response were responsible for far more deaths, especially of people with underlying health problems. But since some of these deaths might have occurred without the storm, the only way to estimate the number is by comparison with mortality rates in previous years. Numerous universities and investigative reporters have made these comparisons, and the estimates are staggering. Up to 3,000 people are thought to have perished in the aftermath of Hurricane Maria, exceeding fatalities in Katrina. Many citizens moved to the mainland US, especially to Florida. Because Puerto Rico is a US territory and citizens pay some federal taxes including Medicare and Social Security, the federal government has been blamed for the slow response , and for not providing more immediate relief and long-term financial aid to the island. The response was so inadequate and the suffering so significant that the international relief organization Oxfam intervened and provided aid to the island. Although the storms, the location, and the nature of the damage were very different and comparisons are difficult, the response (or lack of) to Maria resembled Katrina to many. And because the majority of people impacted by both of these tragedies were minorities, African Americans in the case of Katrina and Hispanics in the case of Maria, there have been charges of environmental racism in both cases. Certainly, the responses to Harvey and Sandy were far superior. Even now, three years after the storm, blue tarps still dot rooftops all over the island, memories of Maria.
Hurricane Harvey: August 2017
Hurricane Harvey: August 2017Hurricane Harvey came ashore on August 25th near Rockport, TX, with 120 mph winds devastating the small coastal town and flooding the coastal areas with a storm surge, then made another landfall at Holiday Beach as a category 3. By that time, the storm was rapidly weakening to become a tropical depression, and it also was moving very slowly towards the sprawling metropolis of Houston. The storm basically stalled over the city for a few days, and it was rain, not wind, that would become deadly. Harvey has two primary lessons for us: (1) that the warmer atmosphere of today and the future, combined with the predicted slower movement of some storms, can be devastating “rain engines” that dump biblical amounts of precipitation on coastal communities and cause life-threatening flooding; and (2) that particular cities have a great deal more vulnerability than others because of low elevation combined with poor planning. On this note, Houston is a sprawling metropolis of 6 million people that has set itself up for catastrophe.


Tropical Storm Harvey was the wettest storm ever to hit the US. The Gulf of Mexico is an incredibly warm water mass, with a temperature of 30 deg C (86 deg F) during Harvey. As we learned in the last module, warm water holds more moisture than cold water and ocean warmth also fuels the energy for the storm. For every 1°C increase in temperature, the atmosphere can hold around 7 percent more water vapor. This may not sound like a lot, but think about this, hurricanes can form when waters exceed 26 deg C (79 deg F) in temperature, so the Gulf of Mexico atmosphere could hold almost 30 percent more moisture than other storms. And because under many conditions the warm atmosphere makes storms move slower, means that devastating rain engines like Harvey will become increasingly common in the future.
Let’s talk about the rain. The rainfall in Harvey has often been called a rain “bomb”, but the term rain bomb is generally reserved for locally intense rainfall over periods of minutes or hours at most. So for Harvey, what we saw was a nuclear rain bomb! It poured for days! Over the five-day period from August 25 to August 29, many parts of Houston received over 30 inches of rain (0.76 meters) with a maximum of 60.58 inches in Nederland, Texas. In total, the Houston region received over 24 trillion gallons of rain. That is enough water to fill every NFL and Division 1 football stadium 100 times over!


The other ingredient for the disaster in Houston was the lack of planning and smart land use. Houston has experienced growth more rapidly than almost any US city, and it has spread outwards rather than upwards. The city now covers an area as large as Chicago, Cleveland, Detroit, and Philadelphia combined! In fact, a large part of the city is built on an ancient floodplain, the Katy Prairie, which extends 30 miles west of downtown. This prairie acts like a natural sponge for water, but is largely paved over during the rapid growth of the Houston metro area. Even outside of the prairie, urbanization clearly intensified runoff and flash flooding. In fact, planning is not a strong point of development in Houston. The city has no zoning and little regulation of any sort. It’s a pro-business, small-government boom town! You drive around town, and you might see pawn shops next to schools and factories next to churches. So the floodplain is full of housing developments and apartment complexes. To make matters worse, development was permitted inside two large reservoirs, the Barker and Addicks Reservoirs which ironically were originally purchased by the Army Corps of Engineers to protect the downtown from flooding, and many of the families living in the reservoir only found out about it AFTER Harvey. Water levels in the reservoirs were controlled by dams and flood gates, but the Corps had a delicate balancing act. They had to release water slowly down the Buffalo Spillway on the east side to prevent the dam from overtopping, which would have caused a catastrophe, but they could not release so much because that would have flooded downtown. But as it turned out, properties in the reservoir flooded; a gated development called Canyon Gate at Cinco Ranch within the Barker Reservoir with over 700 homes suffered extensive flooding. Those living within the reservoirs may have been more fortunate than those living around it. The Corps released water down the Buffalo Spillway into Buffalo Bayou without warning homeowners and flooded homes in West Houston. There was extensive damage and several fatalities. Needless to say, the Corps has endured severe criticism and lawsuits.


This sequence shows how the flooding occurred around the Barker and Addicks Reservoirs: New York Times: How One Houston Suburb Ended Up in A Reservoir
Long term, there is a discussion about building structures called a berm around what is left of wetlands in the Katy Prairie to provide flood control to development in the western part of Houston. But even then the location of the city and its elevation combined with the sheer amount of concrete and lack of flood control means that storms like Harvey are almost certain to happen again, and it will take a lot more than that to avoid catastrophe in the future. Whole neighborhoods will need to be resettled, and new construction banned in certain locations. But those types of regulations will be a tough political sell in a pro-business town. In 2008, Hurricane Ike prompted a debate that was reinvigorated after Harvey about the need for better coastal protection to prevent storm surges from flooding Houston via the Houston Ship Channel and Galveston Bay, from the Gulf. And the next massive rain soaker of a storm might be on the horizon.
Hurricane Dorian: September 2019
Hurricane Dorian: September 2019The Bahamas are used to hurricanes. There is no official “hurricane alley” (like tornado alley) but if there were, the Bahamas would be smack in the middle of it. The island nation is generally under a hurricane watch and warning several times a year and has been ravaged by storms in the past. But nothing like Dorian. The storm moved through the Caribbean and took aim on the islands before rapidly strengthening as it approached. Dorian made landfall on September 1, 2019, on Grand Abaco Island with sustained winds of 185 mph and gusts over 220 mph, let me repeat that sustained winds of 185 mph and gusts over 220 mph (!), making it one of the strongest storms on record in the Atlantic and Pacific.


Dorian was an unusual storm in several ways. Remember in the last module we learned that hurricane strength is generally measured by the minimum atmospheric pressure, and Dorian’s pressure was not that low. But, the storm was enormous. Dorian was particularly deadly because the devastating winds were combined with an extremely slow forward motion of about 5 mph so that the storm ravaged the Bahamas for days. Devastating storms like Andrew and Katrina had much faster motion, but the slow speed of Dorian made the damage much, much worse. It’s hard to imagine what it would have been like for all the citizens of the Bahamas to have experienced the impacts of the storm for that long. After pummeling the Abacos, a group of islands in the northeast Bahamas, the storm went back over open water and made landfall without weakening on September 2 on Grand Bahama, the largest Bahama island, where it literally stalled for a day before weakening a little and moving back over open water. The damage to the Bahamas was truly catastrophic, as the pictures show.
The Bahamas had plenty of time to prepare for Dorian. Evacuation orders for low-lying areas were given the day before the storm and residents were urged to seek shelter on higher ground, boats picked people up from small, low-lying islands, and resorts were closed, but even so, many people ignored the warnings. At landfall on the Abacos and again on Grand Bahama, Dorian’s intense winds were accompanied by a massive storm surge of about 6-9 meters (20-25 feet) and heavy rain. In total, about a meter (3 feet) of rain fell over most of the northern Bahamas. Again, imagine experiencing these winds, rains, and storm surge for almost a whole day like folks in the Abacos and Grand Bahama did! It must have been truly terrifying on both sets of islands. There are harrowing tales of people clinging on to trees and other harrowing survival stories, but sadly many were not so fortunate. The official death toll from Dorian is 70, but is almost certainly much, much higher because there were many undocumented citizens living in shantytowns. Initially, there were over 1000 people missing, and now that number is around 300, so the death toll is likely to be 500-600. The true number may never be known.
Watch these short videos that show incredible footage of the peak of the storm and its aftermath!
Video: Hurricane Dorian batters Bahamas with severe flash floods and ferocious wind (1:48)
Hurricane Dorian batters Bahamas with severe flash floods and ferociious wind
Text on screen: Hurricane Dorian has brought chaos and disruption to the Bahamas.
Voices yelling: Swim! Swim! Swim! Swim! Keep going!
Man: Alright, we gotta move, guys. We have to jump a fence over here.
Text on screen: One of the most powerful Atlantic hurricanes on record brought ferocious wind and heavy flash floods, damaging over 13,000 homes.
Man: I'm on top of the sink right now.
Man: That's the water hitting my front room window, which is extremely high. And this is the water by my back door and glass. So this is what I'm facing at the moment.
Text on screen: The Rand Memorial Hospital in Freeport was also flooded and Freeport International Airport was 6 ft underwater. Dorian began its destructive path in the Abaco Islands where it killed at least five people and caused widespread damage. It then stalled over the Grand Bahama Island for over a day. Dorian is now crawling from the Bahamas towards the U.S.
Iram Lewis: We don't mind the properties, we just hope that lives will be saved. But as you can tell, we are going to need a lot of support after this hurricane is over.
Video: The town forgotten in the aftermath of Hurricane Dorian (4:33)
The town forgotten in the aftermath of Hurricane Dorian
Stuart Ramsay, Reporter: This disaster remains an emergency, and even now it's growing in different ways. On Grand Bahama, an oil storage facility next to pristine waters is spewing oil into the environment. The hurricane winds literally tore off the lids of these huge tanks. Oil is clearly using out of one of the stores. The land around the facility is saturated in oil. One of the tanks appears to have emptied itself. With so much damage to the island's infrastructure and so much human need, nobody's been able to deal with this yet. And the human crisis remains a serious problem. Roads and bridges linking isolated communities are still unpassable. On Abaco island, the community of Fox Town is only just getting aid. The houses here were overwhelmed by the storm surge. People here are still waiting in lines hoping to be evacuated. It's happening, but the process is long and there are so many others in need as well. While they may have made it on board, this is another family split by this storm. And thousands upon thousands of people here are homeless, and many have still not been able to get to safety. This village, once home to 2,000 people, doesn't have a name. Now it doesn't exist either, completely leveled by Dorian. But as we circled we saw signs of life - washing on clotheslines, then a glimpse of people beneath us. We landed and took them what food and water we had and to see how they were. These are the Haitian workers of a long since closed farm. They took us into what was the center of the village. How anyone survived here is quite remarkable. It has been obliterated. Most of the survivors fled in the aftermath of the storm, leaving this small group behind. They're cut off. They have no communication or vehicles. Nobody knew they were here, forgotten in the chaos.
Stuart Ramsay interviewing a survivor. So people came out of the house...
Survivor Newman Jean: Yeah.
Stuart: ...to try to get to another house and then it got blown down too.
Newman Jean: It blew down, yes, it blew down.
Stuart: But the storm lasted a long, long time.
Newman Jean: long time - he go, he come back, he go, he come back, that's it
Stuart: What happened here was horrendous. The emotional toll it's taken on the survivors is difficult to imagine. Everything for them must seem hopeless now. And however strong they appear, they're hurting. None of these survivors have been able to speak to their family since the storm. They used our satellite phones and the first contact is hard too.
The roof of Mark San Vincent's home was torn off in seconds.
Stuart interviewing Mark San Vincent: Have you put this back on?
Mark San Vincent: Yes, sir.
Stuart: So the whole roof?
Mark San Vincent: Yes, sir.
Stuart: So under the car here?
Mark San Vincent: Under the car, yeah.
Stuart: And you survived in there?
Mark San Vincent: yeah
Stuart: Holding his wife and baby, they made it outside and hid beneath the car. Incredibly they survived. What happens next, he has no idea.
Mark San Vincent: I got my wife on Nassau yesterday. I got baby to Nassau yesterday. I'm just gonna stay for a couple of weeks, but I don't know. I got no money to go to Nassau. I just sleep on the outside.
Stuart: How families have been torn apart by Hurricane Dorian, none will ever forget this. But perhaps the youngest are the most resilient.
Young boy: The storm was like wind, raining, and water.
Stuart: Were you scared?
Young boy: Yes sir.
Stuart: This battered group in this destroyed community is representative of so many thousands of people who endured the storm and are now struggling with the survival. Like the islands themselves, the people will take years to recover.
Stuart: Stuart Ramsay, Sky News in the Bahamas.
On the Abacos, 60 percent of homes were destroyed, in total thousands of homes, including most of the poor shanty town dwellings. The power grid was completely destroyed and the airport flooded. 60% of Grand Bahama island was left underwater, hundreds of homes destroyed and a hospital was badly contaminated by sewage. Dorian will certainly be remembered as one of the most devastating Atlantic storms.
Hurricane Dorian
Moving forward, the lesson from Dorian, like Harvey, is definitely that our warming climate often results in storms that move super slowly. We need to prepare for a Dorian-like storm to hit Miami or New Orleans or under the right circumstances, even Washington DC. Building codes and infrastructure need to be adapted for this eventuality. It’s just a matter of time.
Hurricane Ian: September-October 2022
Hurricane Ian: September-October 2022Hurricane Ian: Sept-Oct 2022
Now to Hurricane Ian that hit southwest Florida in September 2022. The storm was notable because of how rapidly it intensified, with wind speeds increasing from 75 mph to 155 mph in just two days. The very large storm came ashore at Cayo Costa island just to the north of Fort Myers on September 28th, 2022. Sustained wind speeds at landfall were 150 mph, likely with higher gusts. It was the fifth-strongest storm ever to hit the 50 contiguous states.
But the damage in southwest Florida was not just inflicted by the wind. Since the path of the storm closely paralleled the coast as it approached land, and because the highest surge is in the right front quadrant of the storm due to its counter-clockwise circulation, the storm surge over large areas was devastating.
The storm surge was between up to 15 feet above normal sea level along the barrier islands of Captiva, Sanibel, and Fort Myers Beach. This wall of water caused massive devastation in these areas, as observed in the photographs below.


Ian moved slowly in the northeast direction across the Florida peninsula, and this slow path caused heavy rainfall over a wide area (see photo above), with precipitation totals of up to 17 inches over a 12-24 hour period. This rainfall caused widespread flooding well inland in places such as Orlando.
One of the main stories of the storm was a prediction. The different forecast models agreed closely as the storm approached southwest Florida, but because the path was so close to parallel to the coast, a small change led to a major difference in the landfall location. Two days out the path was more northerly with the eye forecasted to make landfall near Tampa, but then a day out a minor jog in the forecast to the east shifted the forecasted landfall of the eye well south. This change led to some delays in evacuation in the Fort Myers area.
The storm caused massive damage over a widespread area with catastrophic damage to housing along the coast, especially in Fort Myers, Sanibel Captiva, and Port Charlotte. More than 2.7 million people lost power at the height of the storm, and a large number were without clean water. Overall, the storm led to 136 fatalities in Florida and a total of $50 billion in damage.
Hurricane Helene: September 2024
Hurricane Helene: September 2024
Hurricane Helene arose as a depression in the Caribbean. The storm rapidly intensified over the unusually warm Gulf of Mexico as it moved towards the Big Bend region of Florida where it made landfall on the evening of September 26, 2024, as a category 4 hurricane with sustained winds of 140 mph. The hurricane was also very large and had a high storm surge along a long area of the western Florida coastline from about 10 feet in the Big Bend to about 7 feet in the Tampa Bay region, causing extensive flooding along the whole coast.
Since the storm was moving so rapidly it maintained its strength inland and it was still a hurricane when it hit southern Georgia. Wind damage was severe well inland in both states.
Helene was still a tropical storm when it moved across northern Georgia near Atlanta, South Carolina near Greenville, and North Carolina near Asheville. In these regions, some damage was caused by wind, but most of it was done by water. A stalled frontal boundary had dumped up to 9 inches of rain over the mountains of western North Carolina before the storm arrived. The ground was therefore already saturated when the storm arrived, and this led to extensive tree damage from tropical-storm-force winds. Rainfall totals of up to 32 inches in the mountainous terrain caused many landslides and mudslides. The water rushed down the hillslopes causing rivers to rise rapidly, and overflow their banks leading to extensive flash flooding. River levels were at record levels, for example, the French Broad and Swannanoa rivers in Asheville were up to 5 feet above historic levels, breaking a record set in 1916. The results were absolutely catastrophic in Asheville and small mountain towns all over western South Carolina, North Carolina, and Tennessee. Extensive flash flooding swept away single-family homes and mobile homes, and flooded businesses.
Video: Examining Hurricane Helene's shocking impact in North Carolina (7:51)
Examining Hurricane Helene's shocking impact in North Carolina
Scott Withers, Scripps News Reporter: Joining us now, is Stephen Pruitt. He left Ashville and is now at the Dallas Fort Worth International Airport to give us a view from the ground of what is unfolding. Thank you so much for giving us some time. As we're looking on the screen, you captured some really, really telling, an awful footage of from your time on the ground there in North Carolina. What were you doing there? How bad was it? How do you get out?
Stephen Pruitt: I am from Ashville. So I live in the area and East Nashville specifically want to know area, which is the one in a river valley, got hit about the hardest to community center there a few months ago. But I don't know. The media production company here and downside photographer and videographer drone pilots. I was out documenting of course in the media agency. Yeah, I mean, definitely far the worst thing we've ever had. And we were saying it was the worst one in 100 years. But they're saying the one that was in 1916, that pretty much but actually under water was 10 feet less than this one. So, pretty bad.
Female News Reporter: So what was your expectation when you landed in North Carolina for this assignment, and compare that to just what you saw and what we're looking at here video.
Stephen Pruitt: Well, I'm actually based out of Ashville, so I didn't fly in, I'm from there. But my studio is actually in the River Arts district, which is the low point in Ashville, that was pretty much gone. But I think we were expecting something again for the 2004. I believe it was Hurricane Ivan. We were expecting somewhere around 20 feet of water, wind up getting 31 feet of water going front. And it's usually, you know, usually can handle about 5 feet before flooding. So I mean, it's once in 1000 year flood.
Scott Withers: Every time I see one of these tragedies unfold, my first thought is: People have lost everything, their homes, their business. Where do you begin? What is step one in terms of what's next and where you go from here?
Stephen Pruitt: Well, I mean, most of us hopefully have insurance. You know, still trying to navigate that and whether, you know, whatever all that stuff pays. Fema is supposed to be arriving in the area here. I believe they're supposed to be arriving in here today or they got here late yesterday. People should know that if their homeowners or thier cars are damaged, they can apply for federal aid through FEMA online. I know most people don't have service, we didn't have it. I mean, it was no pocket service anywhere. We're completely cut off from the world, you know, we're already in like the mountain, so like all the interstates and major roads were completely cut off coming in. If anyone needs to get out, I managed to get out through !20 South out the Greenville Airport. I flew out of Greenville, South Carolina. I've got family up in Montana right now that I am going to go stay with for a little bit. That's my plan.
Female News Reporter: We spoke with a professor earlier today, who I think said something really profound. She said that she always tries to imagine, you know, the devastation that others feel during natural disasters. People who deal with hurricanes in Florida and tornadoes. And she said that you will never truly know what that is like until you are standing in knee-deep water in your own home, and you're trying to grab all the important things that you can hold, and you have your neighbors who are doing the same thing. Is that something that you felt as well? When you realize you had to get out, what was that like for you to leave a place that you've called home for so many years?
Stephen Pruitt: Well, I mean, I got out my house and thankfully is ok. Where I'm at is a U shape, but basically on top of a hill with a river wrapped entirely around me. So I was lucky that my house was spared my studio, maybe not so much, but if something's going to happen it is better to be my house make it not, that. But so many of my friends lost that. And the cove adjacent to me, I had reports they're pulling bodies out of and they're still missing 1000 plus, people just in Bucking County. So, you know, I'm kind of, my nerves are completely shot. But I'm feeling pretty thankful that I didn't lose my house and my family's ok, because we're 6 generations from western North Carolina. Got a lot of family that are still completely stranded, that, you know, hopefully FEMA is able to get to. Because we're cut out by rivers and all bridges are washed out.
Scott Withers: And as someone who's from there and like you said, has deep family roots there, a business there, I mean your life is in Ashville, North Carolina. Has it sunk in yet, these images that we're watching and potentially everything and sadly, people who are gone as well. Are you able to process this or you just still kind of running on fumes, man?
Stephen Pruitt: Kind of running on fumes. I wouldn't say that I've really processed it yet. I don't know that anyone really has. I'm not really something, you know, it's like downloading new information, you never really seen it. You don't really know how to process it. I feel like it takes while for that to actually affect you for better or worse.
Female News Reporter: Do you have any idea when you will return?
Stephen Pruitt: I'm going to go back, I am supposed to be flying back on Saturday. I've got friends coming down from all over the country that are hopefully helping right now. The main thing people need is gas for generators and drinking water. You know, I had a reverse osmosis machine that I was able to filter rainwater. It does on the generator. But then I'm getting low on gas. You know, the gas situation is kind of tough. That's that's what people need the most out there.
Scott Withers: And for folks who may not know Ashville through just kind of hearing the name on the news, and seeing these images. What would you like the rest of the country to know about your hometown?
Stephen Pruitt: We're you know, our whole economy based on tourism here. You know, we are one of the biggest destinations in the country, constantly winning best outdoor city from every publication that ever existed. And you know, for better or worse people are going to, you know, want to help. But today, you know, a lot of us are on offer tourism, and so come back visit. Spend your money here. Whenever things are back open, you know, help out any way you can. You know, it's just like, you know, a few years ago, shoot down in Saint John, and in the Virgin Islands quite a bit. You know, whenever all that got decimated by the hurricane, you know, people, you know, we're wary to go back for a while. Like a we need people to come back here and visit, you know our entire economy runs off of that. So, you know, obviously give it some time, but you know, maybe if you've never been check it out. You know, it's one of the best places in the world. That's why I stayed there.
Female News Reporter: You know, everyone who I know who has visited there has said that exact thing that's why they continue to go back. They love the people they love just everything about it on. So I truly hope that that recovery process, we know it's a long road out, but get started and you guys can rebuild because I know it is truly beautiful place. Stephen, thank you so much for joining us and for your amazing work, too that we see here on the screen just really capturing the devastation in that area. For our viewers, weappreciate your time and best of luck to you.
Stephen Pruitt: Thank you, I appreciate it.
The most dire result of Helene was loss of life. The storm was the most deadly since Hurricane Katrina with over 280 dead. Over 100 of these deaths occurred in western North Carolina, where many more are still missing at the time of writing. The storm was also the costliest since Katrina with estimates of over $50 billion with billions of dollars of uninsured flood damages.
Video: Surviving after Helene: 'Just living is a challenge' (4:27)
Surviving after Helene: 'Just living is a challenge'
Travis Long, News Journalist: I've covered you know, probably 20 name storms somewhere around in that area. And this is probably by far in a lot of ways the worst that I've experienced Just in the scope of the damage, and how difficult it is and remote some of these communities are. Communication has largely been cut off especially during the first couple of days. Cell service is virally non-existent, and the only way that I've been able to even send some of my pictures out and communicate with my colleagues is through satellite Starlink. This hurricane is different because it was mostly a flooding event. And the power of the water is incredible, it's different than wind. It has the ability to uproot trees, and wash away buildings, buckle roads, pick up tractor trailers, and move them hundreds of feet. Some of the things that I've seen the water do is just unfathonable.
Travis Long: The first couple of days, especially, I think it was just everyone was just in shock. The devastation, the best way to explain it, is in pockets. And those pockets tend to be where there's a valley, and and a river, and a community that's along the river. And then within that those pockets, it's difficult to get to and people just don't have the basic, basic things that they need. Just living is a challenge. Just so many things that you take for granted. I mean even just at night it's striking how dark it was out here with no power. As a journalist I don't want to become part of the problem. So I try to be as self-sufficient as I can, and I try to be as respectful as I can in covering these communities because I don't want to do any more harm that's already been done. Every single thing becomes a challenge when you don't have cell signal, you know you need to be driving, but also looking at maps. When there's no gas, you have to pull over and put gas in your tank from gas that you brought with. There are no restaurants, so you have to eat snacks or make your own food. It's just being out here is a challenge. I see people a lot of times at the best moments in their life, or the worst moments in their life and not a whole lot in between. In this situation it's it is the worst moment for people, but it's something that needs attention and if I can help shed a light on people that need help I think that's what I have the skills and the tools to do.
Travis Long: There was one moment in particular that was something I had never seen or experienced. There was a a tractor trailer that apparently had been on a road in Black Mountain and had been washed up over a railroad track, and then into into some woods. And the residents there had opened the back of the tractor trailer and it was loaded with bottled water. And so we had people from churche,s and just anyone who was passing by and saw what was going on, climbing into the back of the tractor trailer and removing all the water and distributing it to anyone who needed it. And it was just an incredible sight to see. People should be careful about the information that they share and make sure that it's accurate, because it's not helping anyone to share inacurate information about what's going on in here. Things are bad enough without compounding that. So I I encourage people to, you know, look at the work that the Charlotte Observer and the New York Observer are doing. We're here on the ground we're trying to be as accurate as possible and give out good information so that people can get the help that they need and find ways to help people.
The storm left 4 million people without power, but more damaging was the flood damage, along the Florida coast from the storm surge and in the mountainous regions of the Carolinas and Tennessee from flash flooding. Here the water washed out roads causing severe disruptions to transportation and severed water lines including in larger towns like Asheville. Communication was made even more difficult by the loss of cell phone service as towers were knocked down by wind.
Recovery over the wide area impacted by Helene is still underway with major roles from FEMA and state agencies.

Asheville, NC: One month after Hurricane Helene
ETS Titan: February 2014
ETS Titan: February 2014In the remainder of this module, we discuss historic extratropical systems. In early 2014 several winters (extratropical) storms developed off the western coast of the U.S. In the case of the storm featured in the video below, the extratropical cyclone had already developed and then merged with a cold front or “atmospheric river” in February 2014. Another event developed a strong rotation later in February and early March. This storm was named Titan. Collectively, these atmospheric river-producing events helped to form large coastal swells and brought much-needed rain to California. The state had been suffering from significant drought conditions for more than 3 years.
Video: Animation of extratropical cyclone merging with atmospheric river off California." (1:06) (Video is not narrated.)
Animation of extratropical cyclone merging with atmospheric river off California. In mid-February 2014, an intense extratopical storm merged with an atmospheric river and hit the California coast. This three-part animation shows a satellite view of the storm clouds, then a color-coded animation of moisture flowing out of the tropics, and finally, how the atmospheric river banked up against the storm's cold front and moved inland with it.
Video: 2/28/14-3/1/14 West Coast Extratropical Cyclone Water Vapor Satellite Loop. (00:58) (Video is not narrated.)
West Coast Extratropical Cyclone Water Vapor Satellite Loop. This water vapor satellite imagery loop shows the evolution of an impressive extra tropical cyclone off the coast of California on 2/28/14-3/1/14.
The National Weather Service reported that more rain fell in a few hours than had fallen in eight months as a result of just one of these storms. Due to the relatively steep terrain of the region, and because of the extensive drought, as much needed as the rain was, numerous landslides resulted, and coastal erosion at the base of several sections of the coastal highway was undermined or buried. In some areas, roads were closed and people were evacuated. So, although the storms were not as large in scale as most tropical storms, they definitely impacted coastal regions in many of the same ways.
Below, a home video, taken in 2008 at Marina State Beach, just north of Monterey, California, and south of Salinas River National Wildlife Refuge, shows massive waves some 30’ high. The video illustrates the power of waves as they interact with the shoreline.
Video: Giant Pacific Wave Storm, January 5th, 2008 (1:53) (Video includes people talking, but is not narrated.)
Giant Pacific Wave Storm, January 5th, 2008
Although the winds don’t appear to be too intense, significant wave run-up is shown, and you can easily see how the swells produce extensive coastal scour and erosion along the shoreline. In the months following, portions of California experienced additional storm activity. Large waves, some in excess of 15 feet, pounded the shoreline up and down the coast. High winds, some gusts as high as 55 mph, were measured, and significant accumulations of snow were dumped at higher elevations, High Surf, Wild Winds Pound Southern California (CBS Los Angeles).
The Historic “Bomb Cyclone” of January 2018
The Historic “Bomb Cyclone” of January 2018In January 2018 a particularly intense nor’easter impacted the northeastern United States, bringing a freezing storm surge ashore in cities such as Boston. Although this was a rare set of circumstances, storms like this are not uncommon.
The storm originated on January 3rd as an area of low pressure off the coast of the southeastern U.S., which traveled rapidly up the eastern seaboard. The storm explosively deepened during this period, earning the storm its memorable moniker of “Bomb Cyclone.” The storm was also given other unofficial names, such as Winter Storm Grayson, Blizzard of 2018, and Storm Brody.
The term bomb cyclone comes from meteorological terms describing an extreme drop in the central pressure of the storm. Terms including explosive cyclogenesis, weather bomb, meteorological bomb, bomb cyclone, and bombogenesis were used to describe the rapid deepening of the low-pressure area of the extratropical cyclone.
By the morning of January 4, the powerful storm system had deepened by 53 mbar of pressure in 21 hours—one of the fastest rates ever observed in the Western Atlantic (Wikipedia). This drop in pressure was over twice the threshold (24 mbar in 24 hours) for bombogenesis.
In Massachusetts, winds gusted to hurricane-force at 76 miles per hour (122 km/h) on Nantucket Island. At least 17.0 inches (430 mm) of snow fell on Boston. In Boston, a freezing storm tide of 15.16 ft (4.62 m) was recorded during the blizzard which flooded areas of the financial district, including a subway station, setting a new historical record. Significant coastal flooding occurred in Maine and New Hampshire.

For more information
- Washington Post Video: Storm surge floods coastal towns in Massachusetts
- Business Insider: Bomb Cyclone Imagery
Shoreline Effects of Storms
Shoreline Effects of StormsIn “Beaches are Moving: The Drowning of America’s Shoreline”, coastal geologist and author Orrin Pilkey discusses the four components of shoreline equilibrium – material, energy, shape, and sea level - and how they interact in the event of a storm. He states: “During a storm the strong wind and waves pick up much more sediment than usual, carrying it inland into the dunes or seaward into the waves”…. “Covered by the storm surge, the beach temporarily loses its usual position in the marine environment and becomes an underwater or offshore bar... …the boiling surf keeps the sand particles in suspension, and because the energy of the big waves reaches deeper water, the sand cannot settle until it is either far offshore… or until it is washed up on land to reshape the beach”.
The result, after a storm has passed, is a very different shoreline than before. The energy of water is awesome in its ability to move sediment from one place and deposit it in another. This is often in conflict with the human desire to stabilize and prevent shorelines from moving. But storms and the shoreline naturally interact in a dynamic way. Humans place structures on shorelines, and they get destroyed and rebuilt. But this cannot go on indefinitely.
A point that Dr. Pilkey repeatedly makes is that storms and shorelines are the natural state in a “constant, dynamic balancing of materials, energies and shapes”. When people attempt to change this dynamic equilibrium, a catastrophe happens. This is something to keep in mind as we consider the impacts of the storms we have discussed in this module and as we move forward to explore ways communities deal with these impacts.
Dr. Sean Cornell of Shippensburg University, who does fieldwork on Wallops Island, captured the following images documenting the impacts to the barrier island after Hurricane Irene in 2011. Read through his description and examine the photographs to learn about the local impacts of a hurricane on a barrier island beach. He contrasts Hurricane Irene with Hurricane Sandy, pointing to the difference in angle of approach.
Irene developed as a tropical storm some 300 km off the eastern end of the Lesser Antilles and outside of the Caribbean Sea. It first became a hurricane on August 22, 2011 as it made landfall on Puerto Rico. Despite making landfall, the storm continued to strengthen and eventually became a Category 3 hurricane as it passed through the Bahamas on August 24. The storm then tracked northward and impacted the Outer Banks of North Carolina as a Category 1 storm before emerging once again out into the Atlantic Ocean off the coast of Virginia just south of Virginia Beach on August 28.
As the storm moved northeastward, it ran parallel to the shoreline of the Delmarva Peninsula, where it produced strong winds and waves and high water for the barrier islands and coastal bays located behind the barrier islands, including Wallops Island, home of NASA’s Wallops Island Flight Facility, as well as Chincoteague and Assateague Islands. These barrier islands are nearly continuous along a distance of almost 150 miles of shoreline between the Chesapeake and Delaware Bays. They are interrupted only occasionally by relatively narrow inlets. Nearly 80 miles of this shoreline is relatively undisturbed and undeveloped and is generally allowed to behave naturally and without significant modification by human activity (although see the impact of constructed shorelines at Ocean City, Maryland, and recent coastal engineering projects on Wallops Island to help protect the launch facility and infrastructure). Centered in this region is one of the largest bays on the Delmarva. Chincoteague Bay straddles the Virginia-Maryland border and today has two inlets to the ocean, one between Wallops Island and Assateague Island (i.e., the Chincoteague Inlet), on the south, and one between Assateague and Fenwick Island on the north (i.e., the Ocean City Inlet; see figure below).

For the Eastern Shore of Virginia, and although it was relatively fast-moving, Hurricane Irene was a significant event as the center of the storm passed only about 30 miles offshore. During the onset of the storm, onshore winds and waves piled significant volumes of water along the barrier islands producing storm overwash, eroding shorelines (see images below), and relatively robust storm surge in back bay areas along the mainland (see images below), although nothing is comparable to the levels observed during Katrina on the Gulf Coast, or during Hurricane Sandy in New York. This was, in part, because of the trajectory of the storm, the speed of the storm, the fact that it moved along the continental shelf, and also because the number of inlets was relatively few and narrow. These factors, combined with the robust nature of the barrier island maritime forests and dune systems, helped reduce the total volume of water that could enter the coastal bays. As the storm moved north of the region, offshore winds on the trailing edge of the storm helped to push surge waters back out of the bays and helped produce extensive scouring in the vicinity of the unprotected inlet. This helped form a large ebb-tidal delta that helped fill in much of the navigational channel between Assateague and Wallops. Thus, for this region, Hurricane Irene’s impact was significant but could have been much worse if the storm’s trajectory had been different.


Hurricane Sandy
In contrast, although Hurricane Sandy was similarly scaled in wind speed and size to Irene, ultimately it was much more impactful further north to New York and New Jersey, primarily because of the storm track it took and the orientation of the shoreline where the storm made landfall. The figure below shows the storm track for Sandy in the fall of 2012. Whereas Irene’s track was parallel to the shore, Sandy’s approach was more perpendicular with landfall toward the northwest. In this way, not only was the brunt of the storm’s energy focused on the shoreline, but the geomorphic configuration of the shoreline and the shallow nature of the inner shelf led to amplification of the storm surge as outlined in the previous module.

Module 6 Lab
Module 6 LabA few of our Labs in this course are considered "mini" Labs, meaning the work will not be as involved, and they will not be worth quite as much. However, the work remains just as important.
In this Lab, you will:
- Use Google Maps to examine the impacts of two major storms in two locations.
- Observe and analyze, using street view and historic imagery in Google Maps, the changes to the landscape and communities caused by the hurricanes' surges and winds.
- Compare redevelopment in the two communities and consider the possible factors influencing redevelopment.
Lab Overview
For this short Lab, we tour two locations in the U.S. to view the impacts of two storms: Hurricane Katrina (Aug 29, 2005) in Pass Christian, MS; and Hurricane Sandy (Oct 31, 2012) in Mantoloking, NJ. Both of these storms were unique, and each community had unique characteristics based on the geomorphology of the coastline and the details of the structures built there. While you make your observations, keep these variables in mind. You will assess the damage to the human structures (mostly individual homes) and then use historic imagery and street views to estimate the level of rebuilding that has taken place in the years following the storms. Consider the factors that may influence homeowners' decisions about rebuilding, including the time elapsed and economic factors. Think about how exposed both of the locations are to coastal hazards and the probability of a future coastal disaster impacting this coastline. Your ability to judge details will be limited by the tools you are using, so you will need to estimate and use the online resources provided to help you fill in gaps of knowledge.
Guidance Video
Downloads/Resources
- Module 6 Lab Worksheet
- Pass Christian, MS (Read the section on Hurricane Katrina)
- Mantoloking, NJ (Read the section on Hurricane Sandy)
Statement of Use of AI on Exams, Quizzes, and Labs
Instructions
Before you begin the Lab, you will need to download the Module 6 Lab Worksheet. The worksheet contains the steps you need to take to complete the Lab in Google Maps. In addition, it contains prompts for questions that you should take note of (by writing down or typing in) as you work through the Lab. Once you have worked through all of the steps , and answered all of the questions, you will go to the Module 6 Lab Quiz and answer the multiple-choice questions. The questions and answer choices on the lab worksheet will match those in the multiple-choice quiz. Submit the quiz for credit.
Summary and Final Tasks
Summary and Final TasksCoastal storms ultimately present a great risk to human and natural landscapes. It is probably true that no one will ever die from sea level rise, but millions of people around the world live, work, and play in areas that are prone to the deadly impact of storms. Although modern meteorological equipment has been developed to the point where we now have good success at predicting major storms, evacuation out of harms way is extremely difficult, as we will see in Module 11. And as we will see in Module 7, tsunamis are much greater as the speed at which tsunami waves propagate as well as the complex ways that waves reflect, refract, and interfere with one another as they move around landmasses and across oceanic shelves.
As these phenomena are so incredibly damaging to human societies around the world each year, it is critical that scientists help promote public awareness and facilitate the development of plans to respond, react, and minimize human losses in the event of the inevitable. In Modules 8-13, we will explore, in more detail, the ideas of coastal zone resource management, managing risk, and planning for a more productive, safe, and less impactful future. Given that global warming processes produce more severe storms each year, coupled with the fact that sea level is rising at a more noticeable rate than ever before, many hard decisions have to be made in the future if we are to continue to enjoy the quality of life that comes from living on or near the coastline.
Reminder - Complete all of the Module 6 tasks!
You have reached the end of Module 6! Double-check the Module 6 Roadmap to make sure you have completed all of the activities listed there before you begin Module 7.
References and Further Reading
The following links are meant to provide suggestions for further investigation into some of the topics covered in Module 6.
Module 7: Tsunami
Module 7: TsunamiIntroduction
Long-Wavelength Waves: Tsunamis or Harbor Waves.
There is nothing that epitomizes the sheer destructive force of nature than a tsunami. And these destructive events have caused extraordinary damage in coastal regions of the Indian and Pacific Oceans, and the Mediterranean. Tsunami have actually changed the course of history, as we will see! Tsunami are caused when large movements of the seafloor occur, suddenly displacing the water above them. As we will learn in this module, this movement can be caused by an earthquake, a volcanic eruption or a submarine landslide or avalanche.
Or even a meteorite collision! Possibly the largest tsunami Earth has ever experienced happened 66 million years ago in the Gulf of Mexico. This massive collision in the northern Yucatán peninsula of Mexico opened up a 180 km wide crater in a matter of minutes. Water rushed into the crater then quickly out again, creating a giant tsunami that may have been as big as 45 to 90 meters (150 to 300 feet) tall. The tsunami rapidly converged on the coast of Mexico and Texas, drowning out animals, possibly including dinosaurs, that were living near the ocean. Evidence for this tsunami comes from sedimentary rocks that are found at the time of the impact around the Gulf of Mexico. In fact, characteristic sedimentary deposits known as tsunamiites are evidence for ancient powerful tsunami, and we will explore some of these catastrophic events in this module.
More recent tsunamis have captured the imagination of historians. The cataclysmic eruption on the Greek Island of Santorini in 1600 BC triggered a tsunami that may have led to the end of the Minoan civilization on the island and the nearby island of Crete. And the collapse of the volcanic island of Krakatoa in 1883 caused an estimated 30,000 deaths on nearby Java. A tsunami around Puget Sound near Seattle in 1700 is a portent or warning of a massive event in the so-called Cascadia margin that threatens the citizens of Portland, Seattle, Vancouver, and Victoria.
The last 20 years have seen powerful tsunami that have caused massive destruction and staggering numbers of fatalities. The December 26th, 2004 Indian Ocean event, caused by a massive submarine earthquake which caused upward of 250,000 deaths in countries around the Indian Ocean really woke people up to the extreme danger of tsunami, and governments up to the need for forecasting and especially for the need for rapid warning systems. The similarities between hurricane storm surge which we learned about in Modules 5 and 6 and a tsunami include the devastation of a community, followed by recovery and rebuilding. But there are also great differences in the ways coastal communities prepare for the two kinds of events.
Video: Japan Tsunami | National Geographic (3:34)
Japan Tsunami | National Geographic
Man reporting: All across northern Japan, they felt it, a violent magnitude 9.0 earthquake on March 11, 2011. It was centered about 80 miles offshore, and tsunami warnings went up immediately. In coastal cities, people knew what to do next, run to higher ground. It's from these vantage points, on hills and in tall buildings, that incredible footage was captured. In Kesennuma, people retreated to a high-rise rooftop and could only watch in horror as tsunami waves inundated their city, knocking buildings into rubble and mixing into a kind of tsunami soup filled with vehicles, building parts, and contents. Seawater cascaded over sea walls and into cities. This video shows the water rushing over an 18-foot seawall in the Kamakshi city. The seawall here was the world's deepest and largest, but not enough for the magnitude of the March 11 disaster. It was the largest quake ever known in Japan and one of the five largest reported in the world. More than 28,000 people are confirmed dead or missing. When two tectonic plates pushed together under the sea, the resulting earthquake sends an enormous burst of energy up through the ocean, displacing enormous quantities of water. With the upward motion, a series of waves expands in all directions. In deep water, these waves travel fast - up to five hundred miles an hour - but only reach a height of a few feet. A passing ship might not even notice. But as the waves enter shallow waters, friction with the ocean floor lowers the wave speed but raises their height. This video is from a Japan Coast Guard ship confronting a tsunami wave in shallow water on March 11. And a rare view from the air, video of a tsunami wave approaching the shoreline. In Japan, some tsunami waves reached as far as 3 miles inland. Japan may be the most seismologically studied country in the world. And with more than 1,200 high-precision GPS stations, a geophysicist at the University of Alaska used the data to create a visualization of the March 11 quake. The waves of displacement that you see were moving as fast as 5 miles per second. In this photo, the ripples of tsunami waves are seen moving upstream in the Naka river at Hitachinaka city. New technology left an enormous amount of visual evidence for studying years to come, and can perhaps help us better understand the power of earthquakes and tsunamis and prevent loss of life in the future.


Unfortunately, tsunamis and the earthquakes that produce them are not readily predicted. The National Oceanographic and Atmospheric Administration (NOAA) in collaboration with international agencies are collaborating on ways to detect tsunami and strategies to notify people around the world of an event should one be detected. The goal is for future earthquakes to trigger sirens and radio warnings in close-by locations for immediate evacuation and guidance for locations further away for evacuation in the hours to come. Such warning systems have been in place in Japan for several decades because of the great tsunami risk. The March 11, 2011, Tohoku earthquake occurred on a part of the fault line that was not thought to be an immediate threat, but these warning systems saved thousands of lives. A variety of detection tools are used today by geoscientists to help detect these phenomena. We will learn later in the module about tools and the data they collect. However, detecting tsunamis was not always possible, and we still have limitations.
The greatest tsunami risk is in parts of the world that are seismically active. The four projection maps, shown below, show the areas of the globe that are most prone to tsunami generation (i.e., shown in red highlights). Most of these areas are identified as high risk for generating tsunamis because, not only are they plate boundary areas, they are also associated with subduction zones where two tectonic plates collide and one is pushed below another. These maps and information about simulating tsunami events for predicting their travel and impacts are from NOAA's Center for Tsunami Research.

In this module, we will learn about the range of processes that generate tsunami. We will study the wealth of data from the 2004 Indian Ocean and 2011 Tohoku events. And we will learn how warning systems work and places at greatest risk of tsunami in the future.
So sit back, relax, and prepare to be terrified!
Required Reading
If you haven't already, please take a few minutes to read this web article (USGS Circular 1187) titled: Surviving a Tsunami—Lessons from Chile, Hawaii, and Japan. The link provides some important details about tsunamis and some critical information items on how to survive an event if you are ever faced with the need to do so.
Goals and Objectives
Goals and Objectives- Students will continue to develop the fundamental geospatial skills and concepts needed to assess the coastal processes and hazards discussed in this course.
- Students will develop an understanding of the relationships between the hydrosphere and lithosphere that result in the development of tsunami.
- Students will consider the geology of tsunamis and their impacts on shorelines.
- Students will consider current shoreline processes in the context of coastal hazards and past and present evolution of coastline morphology.
Learning Objectives
By the end of this module, students should be able to:
- describe the geologic phenomena that lead to the occurrence of tsunamis;
- analyze case studies of how coastal systems are impacted by geologic hazards such as tsunamis;
Module 7 Roadmap
| Activity Type | Assignment |
|---|---|
| To Read | In addition to reading all of the required materials here on the course website, before you begin working through this module, please read the following required readings to build some required background knowledge on sea level rise predictions and future changes in storm intensity.
Extra readings are clearly noted throughout the module and can be pursued as your time and interest allow. |
| To Do |
|
Questions?
If you have any questions, please use the Canvas email tool to contact the instructor.
The Tsunami that Killed Dinosaurs!
The Tsunami that Killed Dinosaurs!Imagine for a moment that you are a dinosaur, 66 million years ago. You live in the lush coastal plains near where the modern city of Galveston, Texas was built in the future. Your life is filled with looking for food, you’re carnivorous, so you spend your days and nights scouting for food: mammals, small reptiles, even fish. You’ve been living in this neck of the woods for decades and nothing much perturbs you. You’re in charge of your destiny.
Then everything changed. It all happened very fast, you see a bright light in the sky to the east, a searing flash, and next, a boom that is the loudest sound you’d ever heard, so loud it deafens you (if it mattered, but sadly it doesn’t). The ground shakes violently: earthquakes almost never occur in these parts, and this is a magnitude 13, likely the largest quake Earth has ever felt! Your giant 50-foot-long frame is thrown to the ground, and you lie there stunned. Next, you are hit by searing heat, a giant fireball approaches from the ocean, skirting the water, wave after wave of heat burns your skin, and you roar in agony. But then you see it -- a giant wave coming also from the same direction -- you have seen storms before, even some hurricanes, but nothing like this. It’s a wall of water, some 90 meters high coming at you, there is nowhere to go, you begin to run towards the land, but it’s no good. After millions of years of dominance, it’s all over.


Well, of course, this is fiction, most dinosaurs were not drowned. Most likely died slowly because climate change that was a result of the impact hitting very volatile sedimentary rocks emitted a lot of climatically active gasses and soot, which cooled the planet by 25 degrees C for decades. Vegetation stopped growing, herbivores died off and ultimately so did you, the carnivorous dinosaurs. You didn’t drown, you slowly starved.

The tsunami part is true. The impact did generate a massive tsunami, and it was one of the largest waves Earth ever experienced. The asteroid that hit the Earth 66 million years ago was 8-10 km across and traveled from the northeast at a velocity of 20 kilometers per second which is 45,000 miles per hour, (!) causing the flash the dinosaurs observed. The collision was so violent it released an estimated 100 teratons of TNT, the equivalent of a billion nuclear bombs (the deafening sound and the earthquake). The collision released a blast wave and a fireball that incinerated vegetation along the coastlines of the Gulf of Mexico (the burning sensation). The colossal Chicxulub crater formed in a matter of minutes, in one of the most dramatic movements the Earth has ever experienced, rocks from depths of more than 20 km were excavated to the surface as a giant ring of mountains. The crater is what is known as multi-ringed, which means it is made of concentric faults that get progressively deeper towards the center.


The crater has a diameter of 200 km and a depth of about 1 km, a giant hole in the ground that slowly filled with seawater over a period of hours. This wasn’t a slow seeping in of water, it was a massive surge, huge waves of water entering the crater. The crater had numerous connections to the surrounding ocean for this water to surge in, and once the crater was filled, giant waves of water exited as a massive tsunami. There were several phases in tsunami development.
When the water rushes back in it forms a central plume (a giant splash) that collapses outwards causing tsunami, this is known as a rim wave tsunami, the first tsunami to form. This wave would travel outside the crater and be the first tsunami to hit the Texas coast. However, it was not the last. Imagine dropping a huge boulder into a bathtub filled with water. The rim wave tsunami forms from the initial big splash (the plume) when the boulder displaces the water. This wave will travel out to the edges of the bathtub and reflect off of it. That is what happened in the Chicxulub crater, the rim wave tsunami hit the shores of the Gulf of Mexico and caused numerous reflected tsunami. But that wasn’t the end. The crater was unstable, with massive piles of rubble all over the place, and giant landslides were occurring everywhere. In addition, the tsunami were so big that they themselves triggered landslides. As we will learn in this module, landslides also trigger tsunami. So there was total chaos that lasted for days, multiple tsunami of varying size going in and out of the crater. And once the tsunami waned and energy began to subside, seiche waves formed, these were waves that did not exit the crater. It took months for the energy to totally diminish. Watch these simulations here:
Video: Chicxulub Tsunami (4:07) (No audio.)
Chicxulub Tsunami
Text on video: Chicxulub Tsunami. 65 million years ago, an asteroid 10 km in diameter struck Mexico's Yucatan Peninsula. The asteroid and its 100 km diameter crater have the Mayan name Chicxulub...but you might know it as "The Asteroid that Killed the Dinosaurs". Let's turn back the clock. Geography was different then. 65 million years ago, Yucatan was under a shallow sea...Florida did not exist...and most of central North America sat at less than 175 m elevation. Important Facts: Impactor - ; Diameter = 10 km; Velocity = 20 km/s; Density = 2.5 gm/cm3 ; Energy = 2.6 x 10²³ J. Arriving at 40,000 miles per hour, the asteroid had the energy of 3 billion WW II era atomic bombs. Vertical Impact: Numbers = Wave Height in meters. Close in, tsunami waves reached about 100 m in height. Along the Mexican coast, the waves were 30-50 m. Some geologists suggest that the Chicxulub tsunami reached Chicago, Montana, or Canada. The simulation, however, predicts just 20-30 m waves in proto-USA. Perhaps the strike came at a low angle from the south? If so, it pushed bigger waves northward, but still, the tsunami falls short of legend. Fact is, the Chicxulub tsunami was restricted to ~100 m size because the impact struck in water ~100 m deep. Could impact-triggered landslides have generated the distant tsunami that geologists report? For now, suppose that the asteroid landed in deeper water a bit to the north. A deep water impact increases tsunami size by a factor of five. What if that happened today? Let's return to the present...and drop the rock. Several U.S. states would go missing. Over eons, asteroids of all sizes have hit Earth. Geological traces remain of some...but extinction-level asteroids like Chicxulub visit us perhaps once in 100 million years. That's small consolation for the dinosaurs, but it's good news for you and me.
We can study cores of rock drilled in the crater to learn about the tsunami. Tsunami deposits are also found all over the margin of the Gulf of Mexico in Texas, Alabama, Mississippi, and northern Mexico. Giant boulders deposited by landslides are found in Cuba. Seiche waves likely made it all the way up to North Dakota! The crater has been drilled, including by a rig in 2016, and cores tell us about the timing and the physics of the tsunami. Also, geologists have worked on rocks around the Gulf of Mexico and the Caribbean that provide information about the height of the wave and how far it extended inland. Some of these rocks are shown below.
So it was a really rough day for you the dinosaur, it was the end of an era, the Mesozoic, when you ruled, you may have been swept out to sea by that first rim wave tsunami, but in all likelihood, your relatives suffered a far slower demise.
Hawaiian Landslides and Potential Megatsunami
Hawaiian Landslides and Potential MegatsunamiPossibly the largest tsunamis ever experienced were triggered by massive landslides off the flanks of Hawaiian volcanoes. And these unstable areas will fail again in the future and trigger a massive tsunami that may devastate coastlines around the Pacific Ocean. It’s not a matter of if, it’s a matter of when.
Hawaiian volcanoes are some of the fastest-growing landforms in the world. The Pacific Plate is moving to the northwest over a massive plume of heat known as a “hot spot”. The plate is moving to the northwest at a rate of 10 cm per year and there is a clear age progression of volcanoes from older on Kauai the northwesternmost island to younger on the southeast flank of the Big Island, Hawaii. In fact, the active youngest flanks are those that have the potential to fail in the future, as we will see.
The evidence for landslides is super clear. Images made with sonar show pockmarked areas of seafloor littered with massive blocks of displaced material off the flanks of islands that show evidence for past failure.
The Nu’uanu slide lies off the northeast coast of the island of Oahu and is one of the largest landslides on Earth. The slide is 235 km wide and 35 km long and occurred 1 to 1.5 million years ago when nearly half of the Ko’olau volcano collapsed. One of the largest blocks in the slide is called the Tuscaloosa seamount, which is 30 km long by 17 km wide and 2 km high! The remaining part of the caldera shows a steep fault escarpment where the failure occurred. The Wailua slide off the north coast of Molokai lies close to the Nu’uanu slide and occurred 1.4 million years ago when the East Molokai volcano collapsed. The slide is 195 km long and 40 wide. The volume of material generated by these two slides must have caused massive tsunamis, or megatsunami, which models suggest were up to 100 m high on the coasts of the Hawaiian islands! One possible piece of evidence for tsunami is found on the island of Lanai, where blocks of coral are found 35 meters above sea level. Such corals could not have grown at these elevations and must have been delivered by tsunami. In all likelihood, tsunami generated by these events hit the west coast of the US and Canada, but there is no known record in these locations.
Hawaiian volcanoes grow, with lavas spreading out from the crater at rapid rates. GPS data show extremely fast motions of 10cm/year along the southeast flank of the Big Island of Hawaii, the youngest Hawaiian island. All eyes are on this margin where recent collapse formed the Hilina slide and current gradual movement is forming the Hilina slump. This coast is also where future flank collapse looks likely, and the arcuate cliffs of the Hilina Pali look like possible pre-collapse features.
This rapid motion has caused visible features in the Hawaiian landscape. The so-called Great Crack on the southwest rift zone of Kilauea is 6 miles long, 60 feet wide and 60 feet deep in places and is and highly visible in Google Earth. The crack is in no immediate danger of failing, but is a reminder that the rapidly accreting Hawaiian islands pose a unique tsunami hazard in the Pacific Ocean.
Santorini 1600 BC and the End of Minoan Civilization
Santorini 1600 BC and the End of Minoan CivilizationThe island of Santorini (also known as Thera) is widely considered the most dramatic Greek island and one of the most beautiful places in the world. White homes are plastered on the side of rugged hills and travel is by donkey. Once the island was a massive volcano that erupted numerous times, but with one final and fatal eruption about 1600BC (the exact number is argued). The steep hillsides on the island were produced during this giant eruption, with massive quantities of lava and ash erupting from a small cone in the middle of what is left of the island. Now the island is like a cut-off horse-shoe with the ocean on all sides and the cone in the middle.
There were several phases in the eruption, including both lava fountains and the generation of deadly and hot mixtures of ash and gas. These mixtures can flow at speeds of 300 kilometers per hour and are often sprayed up into the air as massive columns many kilometers high that can collapse. The collapse of these columns into the ocean is thought to be a process that can generate a massive tsunami, as we will see in the 1883 eruption of Krakatoa, and it is thought that several phases of the Santorini eruption did this. The volcano had originally been a typical mountain-like structure with steep sides. In the later stages of its history, as the magma chamber emptied out, the mountain basically collapsed into a wide crater known as a caldera. The final two stages of the 1600 BC eruption led to the collapse of the caldera, and it's filling up with seawater. The final dramatic collapse which formed the horseshoe-shaped ring of the modern Santorini also generated the well-known megatsunami.
The phases of the eruption are known from well-preserved, layered records of the eruption that are up to 7 meters (23 feet) thick on Santorini but also found at archaeological sites including the well-known ruins in Crete. The eruption was certainly disastrous for the late Minoan civilization on Santorini, but what about elsewhere? The one-thriving Minoan civilization on Crete collapsed around this time and there have been numerous theories about how this related to the eruption. Was it the ash that blanketed the island? A giant earthquake associated with the eruption? Or the massive tsunami?


The tsunami deposit is found all over the eastern Mediterranean, including in deep-sea cores and in northern Crete, western Turkey, and as far away as Israel. There is much debate about its size and impact, however. Simulations have a tough time generating a large tsunami. However, a discovery about ten years ago in Crete provides some clues. At the Palikastro archeological site on the northeast tip of the island, a fascinating layer contained the Santorini ash, broken up building stones, marine fossil shells including those of beach and open ocean organisms, pieces of ceramics and even bones. The distribution of this layer on the rugged shore and in the areas above it suggests that the maximum wave height was 35 meters high! However, the impact of that wave on the Minoans is still debated and unlikely to have been the sole cause of the end of this civilization.
Krakatoa 1883: West of Java!
Krakatoa 1883: West of Java!One of the first disaster movies ever made was about the giant tsunami of 1883 that was triggered during a massive eruption of the giant volcano, Krakatoa, about 20 miles (32 kilometers) from the islands of Java and Sumatra. The movie included a group of thieves and a group of good guys. They are on Java, getting ready to set sail to look for lost treasure. They see the volcanic eruption in the distance, feel the ground shake and the ocean recede, and know that a tsunami is coming. They have a decision to make: stay on land and get to high ground, or escape on a boat and ride the wave out at sea. So the good guys get in the boat, and the bad guys run for higher ground. The boat gets out to sea, where it is rocked by giant waves, but barely survives. The bad guys climb trees and are swept away by the waves. Justice is served! The movie ends.

Think about how inaccurate this storyline is for a minute. While the characters would have felt the earthquakes, the tsunami would have arrived in about THREE minutes (at 800 km/hour). So there would have been almost no time to stand around and make that fateful decision, and certainly not enough time to steer the ship out into open waters. And finally, the movie is infamous because Krakatoa is actually WEST of Java!
Krakatoa is a massive stratovolcano that lies between the islands of Java and Sumatra in the Sunda Strait. The volcano is still active today (it erupted in 2020) and rises out of the ocean with numerous small island cones. The 1883 eruption was by far the largest in its history and basically blew up the majority of the volcano. Eruptions began on May 20 of that year as documented by historic records, and these led up to the massive eruption that began on August 25 and lasted for two days. That eruption is what is known as a culminating eruption, where much of the volcano literally blows up, and, in the case of Krakatoa, all that was left was one flank of the volcano and a couple of small cones in its center. The sheer power of the eruption was caused by what is known as phreatic activity. Because the volcano was right next to the ocean, seawater seeped into the plumbing system, and, when heated, became steam.

The eruption was so powerful that it was heard in Perth in Australia, more than 3000 km away, and may have been the loudest sound heard in historic times. Ash from the eruption stayed elevated for months and caused spectacular sunsets around the world in places as far away as New York and Norway. The famous painting The Scream by Edvard Munch is thought to depict one of these dramatic sunsets. The global temperature dropped by 0.4 deg C in the year after the eruption, as a direct result of the emission of sulfur dioxide that blocked out solar radiation. Record rainfall occurred in California.

When Krakatoa erupted, it generated a massive column of ash, pumice, and gas that extended up to 27 km above the volcano. The collapse of these columns displaced several cubic kilometers of seawater, and this is thought to have been the trigger for the massive tsunami that caused so much destruction. Waves up to 46 meters high (120 feet) crashed onto coastal villages in Java and Sumatra and killed up to 36,000 people. The coastal areas are very flat, there was little warning (sorry, Hollywood!), and nowhere to escape.
The collapse of the column spread a massive cloud of hot ash and poisonous gas called a pyroclastic cloud or surge that basically burned and asphyxiated anyone in its path and caused at least 4000 fatalities on the islands of Sumatra and Selebesi. Large pieces of pumice landed around the region. There are reports of corpses washing up on volcanic pumice in Africa in the months after the eruption.
Sadly, the 1883 eruption was not the last time an eruption of Krakatoa caused massive fatalities. The Anak Krakatoa volcano violently erupted in December 2018 and triggered a tsunami that led to over 400 deaths and over 800 injuries on Java and Sumatra.

Video: Krakatoa volcano explodes: spectacular huge eruption two months before 2018 tsunami (0:54) (Video is not narrated.)
Krakatoa Volcano Explodes: Spectacular Huge Eruption Two Months Before 2018 Tsunami
Krakatoa East of Java was made in 1969, the first of many super wildly inaccurate disaster movies. In “Earthquake,” giant cracks opened in the ground in Los Angeles and swallowed people whole (including the bad guys!). Still worse, in “Volcano”, an eruption takes place in Los Angeles (there are no volcanoes even close to the city!). “Dante’s Peak” did a little bit better, at least it took place in a region where there are volcanoes, but imagine making a truck to be lava resistant so that the family pet can make his last-minute escape! And this is without the wildly inaccurate storm movies!
The 1883 Eruption of Krakatoa shows the devastation that a volcanic tsunami can cause. It was not nearly the largest eruption in the region, however. The eruption of Toba 75,000 years ago was many orders of magnitude more powerful and is thought to have caused more than 3 degrees of global cooling that lasted a number of years. Thick ash from this eruption is found all over the Indian Ocean, and a thin layer is found in Greenland ice cores. The Toba eruption must have generated a truly monstrous tsunami!
Canary Island Landslides and Potential Megatsunami
Canary Island Landslides and Potential MegatsunamiThe Canary Islands are a group of seven volcanic islands that lie 100 kilometers off the coast of Africa. These islands grew over a hotspot as in the Hawaiian islands and all but one has active volcanoes. The coastlines of the Canaries are characterized by massive, steep cliffs and there has long been speculation that these features formed by dramatic collapse. What makes this possibility super significant is the fact that this process could trigger massive tsunamis that could hit the coasts of Europe, the eastern seaboard of the US, and Antarctica. In fact, speculation is that giant blocks of limestone that weigh hundreds of tons meters above sea level in the Bahamas were delivered there by a megatsunami and the Canary Island landslides are a possible culprit. And more locally, tsunami deposits found in the Canary island suggest waves in the past over 150 meters high!
Cumbre Vieja is the main volcano on the island of La Palma and has erupted recently, causing large cracks to grow involving the significant motion of the western volcano flank. This has caused speculation that this flank could collapse. The flank has a volume of 1.5 trillion metric tons and models suggest that if it were to collapse it would generate a tsunami 1000 m high that would be 50 m when it arrived in Europe and along the eastern coast of the US. Because this scenario would be devastating to cities including New York, Boston, and Miami as well as coastal real estate in New Jersey, North and South Carolina, and Florida, it has been rigorously investigated by scientists.


Video: Megatsunami Scenario - La Palma Landslide (4:48)
Megatsunami Scenario - La Palma Landslide
Man narrating: A slide from this mountain could kill millions of people in Europe and along America's eastern seaboard. Some eminent scientists warn that it's purely a matter of time till it happens. This is the volcanic island of La Palma 700 miles off the northwest coast of Africa. It's a newborn baby island, barely past its 4 millionth birthday, created in the last stage of what geologists call the rock cycle. Volcanoes can form land in various ways. In Hawaii lava gently pours from vents in the ground to build up almost horizontal layers of new rock. But elsewhere, as here on La Palma, more violent eruptions build steep-sided cones with surrounding layers of thick ash.
Eruptions in the past 60 years have jolted this island to the core, creating a fault line - a crack you can walk through - along the island central spine 6,000 feet above the Atlantic Ocean. On the western side of the fault, the land fell 13 feet down then stopped. Geologists Bill McGuire and other scientists say gas pressures could build up in a future eruption and crack open the island along this fault line. They have traced the fault for at least nine miles along the island ridge. And they believe the fault is so long that when it cracks open five hundred billion tons of rock will slide thousands of feet down into the ocean.
Prof. Bill McGuire, University College London: So it's going to go during a future eruption, there's no doubt about that. The problem is eruptions occur sometimes every 20 years, sometimes every 200 years.
Narrator: McGuire paints a terrifying fantasy picture of what anyone standing on the top of the landslide would see and hear.
Prof. Bill McGuire: I don't know if anybody's heard the noise made by this amount of rocks sliding against another great chunk of rock, but I always imagined it as if there are a million fingers scraping down a blackboard.
Narrator: The slide will reach a speed of more than 220 miles per hour
Prof. Bill McGuire: So you'd be hurtling down the slope of the volcano. It would start to break up into smaller pieces as it entered the ocean but by then it would already have displaced something like half a mile of water, which would be towering above your head. And that would be probably the last thing you'd ever see. Spectacular way to die.
Narrator: McGuire believes the impact with the ocean will create a dome of water nearly 3,000 feet high.
Prof. Bill McGuire: This is a massive rock which is probably bigger than Manhattan Island and when it collapses it would generate oceanwide tsunami, which will be at least as devastating as those that struck the Indian Ocean.
Narrator: The vast amount of energy pumped into the ocean will create what one scientist has called a megatsunami. Tsunami waves racing out in all directions. Computer predictions suggests they could even travel 4,000 miles toward the eastern seaboard of the United States, losing some but not all of their power along the way.
Prof. Bill McGuire: That wave will travel all the way across the Atlantic Ocean to the east coast of North America, but the water itself won't move all the way across, the individual particles in the world would transmit the energy to one another. We can demonstrate that quite nicely on a pool table here, where the energy from this first ball I'm going to hit is transmitted through all the others to the last one.
Narrator: Just as energy moves from ball to ball, so the landslide energy transfers from water particle to water particle across the ocean. As the landslide's energy approaches the coast, it builds up into a massive wall of water. These deep reds and blues are computer predictions of waves 100 feet high and more.
Prof. Bill McGuire: The level of destruction is difficult to quantify, it is going to be enormous, there's no doubt about that. If people are still in the cities when the collapse occurs, you may be considering millions of casualties.
The hypothesis that Canary Island collapse generates megatsunami is not universally accepted. This skepticism arises from the fact that island collapse may not have been catastrophic, instead, occurring slowly in numerous discrete small events rather than a single giant collapse. Such a slow collapse would not generate a large tsunami. So what about the large Bahamian blocks? An alternative possibility is they were delivered there by a hurricane during a time 125,000 years ago when sea level was higher than it is today.
In summary, it does not appear that a devastating megatsunami generated in the Canary Islands is imminent. There is potential for collapse of the volcanic flanks on the islands but these events will likely be less dramatic than once feared and with waves only devastating on a local scale.
Investigating The Geology & Impacts of Recent Tsunamis
Investigating The Geology & Impacts of Recent TsunamisIn the discussion below, we will explore two case studies. The first is the Sumatran tsunami from 2004, which we will use to explore the geologic origin of tsunamis, how tsunamis are generated within the water column, how they travel, and the impacts that they have on shorelines. The second case study will spend time exploring the most recent large-scale tsunami and associated impacts in Japan. Please click the first case study below or in the menu to get started.
2004 Sumatran Earthquake
2004 Sumatran EarthquakeThe Boxing Day 2004 Earthquake: A Holiday's Worst Nightmare
It is an idyllic morning to be at the beach, the day after Christmas 2004, bright sunshine and balmy temperatures greet vacationers on the tropical island of Phuket in Thailand. Kids run in the waves and build sandcastles, and sunbathers relax. The ocean slowly recedes, exposing rocks below the low tide line and much further, and stranding fish. People venture way out to see this surprising phenomenon. The Earthquake off Sumatra occurred at about 7 AM local time, it was about 500 km away, and no one here felt shaking.
A few people had heard about it on TV, but no one put two and two together---the ocean often recedes as a tsunami approaches. A wave appears on the distant horizon, a bright white band on the ocean surface moving slowly toward the land. People stare at it, puzzled. Gradually, it dawns on some that the wave is dangerous, but others don’t realize it until it’s too late, especially those who had wandered out. The wave is moving really fast. The peaceful beach scene gradually becomes gripped by panic. People flee as fast as they can and run for higher ground. The wave quickly covers the beach and heads for the luxury beachfront hotels. Pools are covered, and beach chairs move around like tinker toys. People cling to trees or desperately clamber up to higher floors to escape the wave. Others have already rushed to higher ground inland. The scene at Phuket is similar to many other resorts in Thailand and Malaysia. The wave reached up to 6 meters or 20 feet high here. Up to 300 people lost their lives in Phuket, and many more were injured. But while there were places to escape to inland if you were fast enough, that was not an option in the Phi Phi islands, also in Thailand. The lovely beach there is backed by dramatic, steep limestone cliffs, and there are few hotels, just low-lying beach cottages. The tsunami was also up to 6 meters at Phi Phi, and as many as 4000 people died, though the total could be far higher.
The date couldn’t be worse for such an event to occur; with thousands of people on holiday in the region and with very few people working in government offices, it was a recipe for disaster. Tourists from all over the world were vacationing in seaside resorts in Thailand, Indonesia, India, and elsewhere. Unplugged as they were, it was next to impossible to inform them or the residents of the region of the impending hazard.
Banda Aceh, the capital of the Aceh province of Sumatra, was much closer to the earthquake epicenter, and people felt the shaking. However, they had very little time to do anything, and there were no warnings about what was to come. And to be effective, a warning would have had to have gone out immediately. About 20 minutes later, three successive waves arrived; the first wave was smaller, but the next two were so large that they reached as far as 4 km (2.5 miles) inland. The water was up to 12 m (40 feet) high in the city, and the impact was truly devastating. Houses were totally destroyed, and wreckage, cars, and anything else were carried inland on this massive, muddy wall of water and debris. Outside of the city, the wave was even higher, up to 30 meters (100 feet) high on the west coast of Aceh province, where it traveled 3 miles inland. The highest measured wave reached 51 meters (167 feet) on a hillside near Banda Aceh. A total of 167,000 people are known to have died in Banda Aceh, and many more were missing. The video shows footage of the devastating tsunami in Banda Aceh, followed by Phuket.


Video: Boxing Day Tsunami 2004 Thailand (9:16) (This video has on-screen text, but is not narrated.)
Boxing Day Tsunami 2004 Thailand
Earthquake near Sumatra 26.12.2004 makes a gigantic tsunami. First, destroyed the coast of Indonesia. The second victim of the devastating phenomenon was the island of Sri Lanka. And now the Tsunami is steadily approaching the shallow Andaman Sea to nearby Thailand. Let’s take a look at the sequence of subsequent events in Thailand. Boxing Day: Tsunami 2004, Country by Country, Thailand. Although Thailand lies 3 times closer to the epicenter than the island of Sri Lanka, Thailand was hit by a tsunami 30 minutes later, approximately 2 hours after the underwater shock. (A red circle is drawn around the location of the epicenter of the 9.3 M Earthquake; arrows show the epicenter is 1056 miles from Sri Lanka and 310 miles from Thailand.) The wave was significantly slowed by the shallow Andaman Sea, which also determined its behavior. The wave was the first to hit the islands of Surin and Similan. On the islands, there was first a massive retreat of the ocean. The subsequent wave came at incredible speed in the form of a rapidly rising water surface. The islands were flooded up to one meter, but the tsunami seems to have flown around Similar Island and has not caused much damage. The sad story took place on the islands of Surin. Staff at a nearby hotel encouraged tourists to explore the exposed seabed. When a wave came, like a swift flood, people rejoiced with the surf. They had no idea they were bathing in a tsunami. When the flow of water intensified, the wave washed away many people into the high seas. The tsunami chose the first victims. Subsequently, the wave struck the coast of Khao-Lake, where it caused tremendous damage. The wave was preceded by a huge retreat of water a few miles back, revealing the seabed. People went to explore the exposed seabed and had no idea they had fallen into a deadly trap. Suddenly, a huge foamed water wall appeared on the horizon, making a thundering sound, like a storm approaching. The height of the racing water was 12 m (40 ft). The tsunami struck with great force all the resorts on the Khao Lak coast. The ruthless wave swept away all the people who could no longer escape from the sandy bottom and sinking sand. The tsunami was so destructive that there were no shots of the incoming tsunami from a tourist resort. However, in “The Impossible” movie, a tsunami coming to the resorts of Khao Lak was captured credibly. The movie tells the story of Henry Bennett’s family, which was broken up by a devastating tsunami. This incredible story of division and reunion really happened. Many families were not so lucky. The Khao Law area was themes affected area in Thailand. The highest recorded tsunami run-up in Thailand measured 19.6 m (64.3 ft) at Ban Thing Dap, on the southwest tip of Ko Phra Thong Island. The area lies north of Khao Lake and the damage was enormous. South of Khao Lak lies the island of Phuket, which was hit moments later. The tsunami here was smaller than in Khao Lake and came in two consecutive waves that would look like surf waves. The reason for the difference seems to have been caused by the local bathymetry off Phuket Island. The first wave was smaller and had a height of about 4m (13 ft) and quickly flooded tourist resorts. The second wave came in ten minutes and had a height of about 9m (30 ft). In the second part of the fourth episode, we will visit Phi Phi, Koh-Lanta, and other smaller islands.
Now let’s take a step back and understand the megathrust earthquake that generated the tsunami. Remember a megathrust earthquake is one that occurs in a subduction zone where one plate is descending under another. These types of motions tend to cause a lot of strain to build up and thus then produce massive amounts of energy when it is released, the fault ruptures, and the crust moves or slips. The slip can encompass the movement of massive areas and involve different motions on either side of the plate boundary. In terms of tsunami genesis, as we have learned, the critical part of the motion is that the megathrust often causes rapid upward motion of the crust (and downward motion in some areas). And, of course, these fault zones are almost all under the ocean.
The 26 December 2004 Sumatra Andaman Earthquake took place when the Indian Plate is subducting beneath the Sunda Plate, actually, a small microplate belonging to it, the Burma microplate.
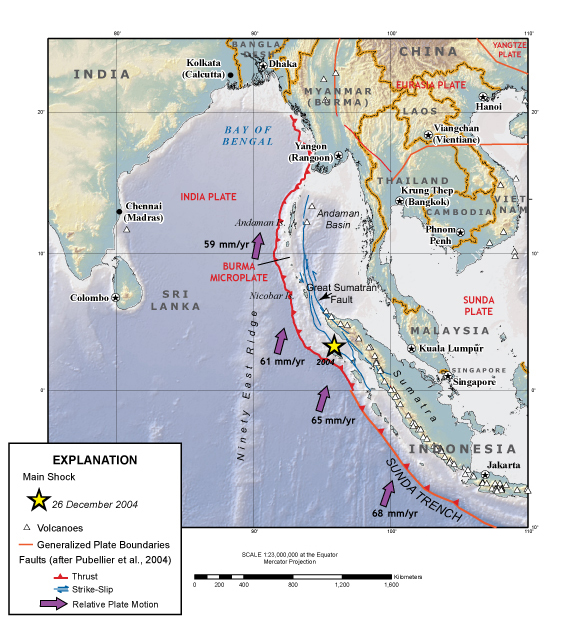
The earthquake was the third-largest quake ever measured with a magnitude of about 9.1. Two other notable elements of the quake were that it involved eight to ten minutes of shaking, which is a very long time compared to most quakes. The rupture took place in several stages with a total of 15 meters or 50 feet of movement over a length of 1500 km (900 miles), and the area of slip was truly massive, about the size of California (as seen in the image below).

The rupture actually involved a complex set of faults with some very rapid upward motion, which triggered the tsunami. The initial rupture occurred above the earthquake epicenter and then propagated to the north at a speed of 2km/sec or 1.2 m/sec (see image below). The fault that moved was up to 50 km (30 miles) deep, and the total amount of motion at the epicenter was about 20 meters or 65 feet. The megathrust motion caused the Burma microplate to move upward rapidly.

The upward motion was enough to make new islands. The animation below shows how the crust moved upwards in propagation from the south toward the north. It is very easy to see how this motion generated a tsunami. The second animation shows how tsunami waves spread out from the area of upward motion. You can see that the waves that hit Banda Aceh in the south of the map came from a different part of the plate boundary from those that hit Thailand in the north.


The earthquake was so large and the plate motion so significant that the 2004 Sumatra-Andaman earthquake is thought to have triggered other earthquakes in a process known as dynamic including the deadly 2008 Sichuan earthquake in China that killed 69,000 people.


Learning Check Point
After examining the diagrams and maps on the USGS’s Pacific Coastal and Marine Science Center website and watching the animation video of the modeled tsunami waves that were generated by the earthquake. Take some time to think about what you just learned, then consider how you would answer the questions on the cards below. Click "Turn" to see the correct answer on the reverse side of each card.
2011 Japanese Earthquake
2011 Japanese EarthquakeJust a few years after the 2004 event, another large-scale tsunami hit one of the most prepared and most technologically advanced countries in the world. The event occurred on March 11, 2011, when a massive 9.0 magnitude earthquake occurred off the eastern coast of Japan, one of the five largest quakes of the modern era. The quake occurred off the coast of the Tohoku region of Japan; hence it is called the Tohoku earthquake and tsunami.
The geologic context was nearly identical to the 2004 event in Sumatra. An eastward directed mega-thrust earthquake disturbed the seafloor. Even though the area disturbed was smaller than offshore Sumatra, it was still massive and had a similar energy release, and it generated a substantial tsunami that raced across the Pacific Ocean, and, most ominously, towards Japan. The Pacific plate to the east of Japan is moving westward under the North American Plate. Seismic data show that parts of the Pacific Plate moved westward by up to 40 m (130 feet) during the quake! The map below shows the amount of movement, known as slip, on the landward North American Plate, and you can see from the darkest red area, a huge region also moved 40 m (130 feet) in a matter of 2 or 3 minutes! The earthquake moved the island of Honshu 2.5 m (8 ft) to the east and shifted the whole Earth off its rotational axis by 10 to 25 cm! Parts of the Japan coast dropped by 0.6 m (2 ft), making the tsunami more devastating, and parts of the seafloor rose by 7 meters (23 feet)! The earthquake rupture mechanics are well known, with an initial speed of 1.5 km (about a mile) per second. So from those last two numbers, 7-meter motion and 1.5 km/sec, you can see how the quake generated a tsunami! The depth of the major quake was 30 km, but numerous aftershocks for various magnitudes occurred for two weeks after as you can see from the red dots in the map below.

The quake generated a tsunami wave that came ashore on the Japanese coastline less than an hour after the earthquake. The tsunami wave was detected about 25 minutes after the earthquake by a DART buoy. This model produced by NOAA’s Tsunami Research Center (NCTR) in Seattle, Washington shows the predicted path of the March 11, 2011, Honshu tsunami as it propagated around the Pacific.
The two videos below show terrifying up-close footage of the earthquake and tsunami:
Video: 2011/03/11 Great East Japan Earthquake, Tsunami (7:00) (Video is not narrated.)
2011/03/11 Great East Japan Earthquake, Tsunami
Video: Dramatic unseen footage of Japanese tsunami (3:24)
Dramatic Unseen Footage of Japanese Tsunami
Man translating in English while Japanese is being spoken in the background. The first time I realized a tsunami was going to hit, I actually saw it myself. I looked in my rearview mirror and saw an even larger wake.
Woman: Dramatic footage has emerged of the Japanese tsunami in March, shot by an onboard camera on a car belonging to (person's name). It shows the moment that waters flood a busy main road and the chaos that ensues. He lost
Man translating in English while Japanese is being spoken in the background: People were running out of their cars. I suppose that's the last thing. I think everybody was really panicking. It was incredibly quick. It probably only took about ten or twenty seconds from the point when the water hit my car to the car being washed away. At the time I thought I was going to die. It was kind of strange, but I didn't really feel panic myself. I was quite calm. I thought that's how things go, so I might as well do as much as I can. And I decided just to sit inside and wait. I thought that even if my car got swept up by the tsunami, I might land someplace, building, or whatever. I might be able to float to safety. I had it in my mind that I'd use the car to protect me as long as possible, that the car would float to somewhere safe and I'd jump out. Or if that was impossible, and the opportunity came, I'd jump out and float to safety. I think I didn't have to swim
Woman: Mr. Muruga managed to escape from the vehicle and fashion a makeshift raft from his possessions. After sheltering in a warehouse until the waters subsided, he later recovered his car and the tape.
Video: March 11, 2011, Honshu, Japan Tsunami Propagation (1:10) (Vidoe is not narrated.)
March 11, 2011, Honshu, Japan Tsunami Propogation
Check out NCTR Tohoku (East Coast of Honshu) Tsunami, March 11, 2011. Also on the site is a maximum wave amplitude model produced by the MOST tsunami model and a new narrated animation of the tsunami propagation and maximum amplitude model. Even more exciting is the fact that NCTR now has a Google Earth interface that provides users with access to datasets (tide data, DART buoy data, etc.) that record water levels in shallow water regions as well as out at sea in deep water where they present water column height (in meters above the seafloor). More on this later.
In any regard, as the length of the fault rupture was relatively small compared to the 2004 Sumatran event, wave propagation was more spherical, and although tsunami beaming occurred, seamounts and other submerged obstructions in the direction of the most prominent beaming direction (i.e., toward the southeast) helped to bend and refract the direct wave so that it lost some of its amplitude as it traveled toward Hawaii and South America. Data measured by tsunami buoys showed that the initial wave close to the fault observed a nearly 2m amplitude wave. As the wave moved toward the southeast, the amplitude subsided to less than a meter, likely as a result of interference as mentioned here. However, the beaming that focused toward the northwest meant that the full force of the direct wave was squarely on the island of Honshu. Given the orientation of the shoreline with numerous river valleys opening to the east and southeast (see below), the tsunami waves were funneled full force into shallow waters and up the progressively narrower valleys located up and down the coast of Honshu.
So, although much had been learned from the 2004 event, and although the tsunami warning system is more advanced and sophisticated and although it had helped to detect and measure the tsunami wave, unfortunately, the tsunami produced an incredible trail of destruction across northern Japan. As discussed, the Tohoku earthquake resulted in uplift and subsidence of portions of the seafloor in northern Japan and some of the shorelines subsided by 0.6 meters. The tsunami was a combination of 10-meter waves that led to wave run-up heights of almost 40 meters (over 120 feet) in some areas, and traveled inland through low-lying river systems at least 10 kilometers and caused over 500 square kilometers to be flooded.
Most coastal defenses were insufficient in preventing the destruction, as tsunami seawalls were overtopped or destroyed in many communities. Perhaps the tsunami warning system didn’t function as intended and notice didn’t reach the population. Perhaps the wave was generated so close to shore there was so little time. Perhaps a false sense of security was afforded by the coastal infrastructure built to protect the shoreline. Nevertheless, as a result of the 2011 tsunami, more than 15,000 people died when entire communities were wiped from their seaside locations. The vast majority died as a result of drowning. When you search the Internet, you will easily find tons of videos showing people desperately trying to move to high ground as the wall of water surges inland behind them. There are even videos of residents on the tops of taller buildings who thought they were safe, but who were also washed away. In addition to these frightening occurrences, the tsunami triggered a series of events that led to the failure of the Fukushima Daiichi nuclear power plant. When the plant failed, the nuclear meltdown led to the release of radioactive materials that ended up in the atmosphere and the Pacific Ocean. In addition to radioactive materials, the Japanese government suggested that more than five million tons of debris were washed out to sea as the surge waters retreated to the sea. As a result of these and other damages, estimates for damage topped 300 billion dollars in Japan alone, but real costs were far greater and continue to mount as a result of clean-up efforts and as a result of the environmental impact on fisheries and agricultural areas that supply food to the population. Tohoku's Six Minute Nightmare provides photos and video from the event that are incredible to look at and fundamentally demonstrate how destructive these events can be.
Required Viewing
If you haven't already, please look over the series of photos that you can swipe across to see the before and after-effects in a number of locations affected by the tsunami in Japan Earthquake: before and after.
Further away, there were also some noticeable impacts. An entire colony of nesting seabirds (in excess of 110,000 birds) was washed away on Midway Atoll. Relatively minor impacts were felt in Hawaii and along the West Coast of the U.S. The tsunami wave continued to travel over 17,000 km and came ashore in Chile where it produced a modest wave of about 2 meters, luckily occurring near low tide so the impact was minimal. Luckily, the tsunami warning systems went into place and no one was killed as a result. In Antarctica, the tsunami waves broke a number of icebergs off the Sulzberger Ice Shelf. The same event was even linked to a number of impacts in the fjords of Norway where waves nearly 2 meters in height sloshed back and forth around the fjords located along the Norwegian Sea in the northeastern part of the Atlantic Ocean. These waves, termed seiches, were terrifying for local residents and produced some minor damage, but no casualties. Other occurrences have been tentatively linked to either the earthquake or the tsunami wave.
The 1700 Cascadia Megathrust Earthquake and the Future of Cascadia Margin
The 1700 Cascadia Megathrust Earthquake and the Future of Cascadia MarginThe 1700 tsunami that impacted the Puget sound region was triggered by a megathrust earthquake off the coast of northern California, Oregon, Washington, and British Columbia on the so-called Cascadia margin. The event happened on the evening of January 26th as documented in Japanese historic records. In Japan, the event was called an “orphan” tsunami because the earthquake was so far away it was not felt. The other significant piece of evidence for the tsunami comes from dead trees in so-called “ghost” forests in Oregon and Washington that can be dated using carbon 14 and tree ring studies. These trees in lush coastal forests are thought to have been instantly killed by the saltwater when they were flooded initially by up to 12 m (36 feet) of land subsidence associated with the megathrust earthquake and then by the tsunami. The photo below shows the Neskowin Ghost Forest on the Oregon coast. We see many tree stumps sticking up above the sand at low tide. These trees were killed by a tsunami in 1700 when the elevation of the land fell, and they were completely inundated and then buried by sand. Large storms eroded the sand from the trees and exposed them. They remain as evidence of the huge tsunami more than 300 years ago.

Oral accounts from indigenous Native American and First Nation tribes living on the coast of Vancouver Island in Canada that have been passed down from generation to generation tell of an earthquake and tsunami on a winter’s evening. The accounts describe that all the low-lying settlements were wiped out and the only survivors were those people who lived 75 feet above the waterline. So the tsunami must have been massive!
Subsidence and tsunami records suggest that the earthquake was in the range of a magnitude 8.7-9.2 on the Richter scale. So what is a megathrust earthquake? It’s a very powerful quake usually close to or greater than a magnitude 9. These quakes occur at subduction zones where one plate is thrust under the other. When this happens the overriding plate moves upwards rapidly and this is what typically generates the tsunami. What is incredible about these events is the motion covers such massive areas. In the 2004 Indian Ocean event, an area 180 km wide and 1000 km long moved up by 30 meters! In the 2011 Tohoku event, an area 200 km long by 500 km wide moved up by 20 meters!
Back to Cascadia. The whole margin from Northern California to British Columbia lies about 200 km from the plate boundary where the Juan da Fuca Plate is sliding beneath the North American Plate. Paleoseismology, the exploration of evidence of ancient quakes from rocks, has become a cottage industry here and suggests that a major (i.e. megathrust) quake occurs every 500 years on average. So it’s been 300 years since the 1700 event and thus getting close to the time for another major event. The probability of such a massive quake in the next 50 years is about 12 percent, about 1 in 8, which is not insignificant.

Tectonics of the Cascadia margin
Cascadia earthquakes are triggered by the movement of North American and Juan de Fuca Plates and to a lesser degree the Pacific Plate. The motions cause shallow and deep earthquakes, some that have epicenters on the land and do not cause tsunami, and others that have epicenters in the ocean. These oceanic earthquakes, like the 1700 Megathrust Earthquake, have the potential to trigger large tsunami that arrive at the coast of Oregon and Washington in 15-20 minutes. This quake provides a warning for the future.
The map shows that there were crustal earthquakes in Washington in 900AD and 1982, deep earthquakes in 1949, 1965, and 2001, and a subduction zone earthquake in 1700. The following chart appears below the map:
| Source | Affected Area | Max. Size | Recurrence |
|---|---|---|---|
| Subduction Zone | W. WA, OR, CA | M9 | 500-600 yr |
| Deep Juan de Fuca plate | W. WA, OR | M7+ | 30-50 yr |
| Crustal faults | WA, OR, CA | M7+ | hundreds of yrs? |
This is the scenario that could play out on the Cascadia margin. A magnitude 9 earthquake rocks the plate boundary leading to a 1000 km long rupture including significant vertical displacement. This generates a tsunami that travels at 800 km/hour. Folks on the coast will feel the earthquake waves first with a magnitude between 7 and 8. This severe shaking will crumble older buildings with poor construction, collapse bridges, and cause landslides and soil liquefaction (when waterlogged soils behave like Jello---see images below from Alaska of the potential damage from liquefaction), stranding communities, and hampering relief. But everyone on the coast will know that the worst is yet to come and that they will need to evacuate as soon as the land stops shaking. The deformation that occurs along the plate boundary could cause land at the coast to sink by up to 6 feet (2m) making the coastal zone much more susceptible to flooding. The first tsunami wave will reach the coast from Victoria Island in Canada to Northern California in 15-20 minutes giving folks very little time to escape to higher ground. The waves could be 30-40 feet (9-12 m) in height when they hit the coast but some models suggest they could reach 100 feet (30 m), and in many parts of the coast they would flood up to 10 miles (16 km) inland. Some parts of the coast are a lot more vulnerable to tsunami inundation than others, and citizens in these locations will have to move to higher ground extremely rapidly once the earthquake waves subside. The waves will keep coming and since they have such long wavelengths it will take hours for the water to subside.
Earthquake Damages
Video: The Next Cascadia Earthquake: Worst-Case Scenario (8:07)
The following video describes the likely impact of a megathrust Cascadia earthquake.
The Next Cascadia Earthquake: Worst-Case Scenario
PRESENTER: On January 27th, 1700, Japanese chroniclers reported a mysterious wave, which struck the island of Honshu and caused widespread damage. The records referred to it as an orphan wave, because unlike most tsunamis on record, it had struck seemingly out of nowhere without being preceded by a detectable earthquake.
[MUSIC PLAYING]
About 12 hours earlier and more than 7,000 kilometers away on Vancouver Island, several villages of the Hesquiaht First Nation were completely destroyed while the inhabitants were sleeping. And 300 years later in 1986, paleontologists excavating along the Washington coast discovered a ghost forest of hundreds of trees that had all been killed by being suddenly submerged in saltwater. The orphan wave, the lost villages, and the ghost forest all had the same cause, a massive earthquake along the Cascadia subduction zone where the Juan de Fuca tectonic plate is being forced under the North American plate.
Further research has shown that there have been seven major earthquakes in the Cascadia subduction zone in the last 3,500 years with the time between major quakes ranging from 200 to 900 years. More than 300 years have passed since the quake of 1700, and the region has grown into an economic center home to more than 10 million people. We need to ask, what would happen if the next Cascadia earthquake happens tomorrow?
This is a worst-case scenario, and the odds of it happening in the near future are still quite low. It's been estimated at around a 12% chance in the next 50 years. But it's a real possibility. So let's imagine what would happen in the worst-case scenario for the next great Cascadia earthquake.
For this scenario, we're going to look at the impact of a magnitude 9.0 earthquake occurring on a weekday morning in late spring. Throughout the region, people are beginning their days. Students are arriving at school. And in the major cities of Vancouver, Victoria, Seattle, and Portland, businesses are gearing up for another normal workday. The major seaports and airports in the region will handle more than 200,000 passengers and $600 million worth of cargo by the end of the day.
At around 10:00 AM, after more than two centuries of building pressure, the Cascadia fault line finally slips and a 1,000-kilometer-long section of the North American plate moves 20 meters to the west, causing one of the largest earthquakes to strike the continent in more than half a century. Seismic waves race outward from the epicenter at 5 kilometers per second and reach the coast before moving inland. This means that people living far enough inland will start seeing posts about the earthquake on social media seconds before they feel the shaking start.
In order to understand the effect that the earthquake will have, we need to understand two different measurements-- magnitude and intensity. Magnitude is the measure of how much energy is released by an earthquake. A magnitude 9 earthquake like this one will release more than 2 exajoules of energy, equal to almost half a billion tons of TNT.
Intensity is a measure of how violent the shaking is at any given point. And here we actually get some good news. Since the epicenter of the quake is more than 100 kilometers off the coast, most cities will experience less violent shaking than other recent earthquakes. Here's an intensity map for the Northridge earthquake, which struck California in 1994, compared to an intensity map for a hypothetical magnitude 9.0 earthquake. The two big differences are that the Cascadia earthquake will be felt over a much wider area and it will last for much longer. The Northridge earthquake lasted for 20 seconds. The Cascadia earthquake will last for more than four minutes.
To get an idea of the impact that the quake will have, let's take a closer look at one of the largest cities in the area, Seattle, Washington, with a population of around 700,000. The intensity of the quake in this area is between a 6 and a 7 on the Mercalli intensity scale, which is associated with mild to moderate damage. Most of the large and recently built buildings in the city sustained fairly little damage.
Of greater concern is the 1,100 unreinforced masonry buildings in the city with more than 30,000 occupants. These buildings pre-date the current codes, and most of them haven't been retrofitted. Many of these buildings are prone to collapse. And those that don't collapse might cause injuries as a result of falling debris. Other risks facing the city include soil liquefaction, where areas of wet soil begin to behave like a liquid during an earthquake and cause damage to roads and foundations.
Thousands of landslides occur across the city, blocking roads and damaging buildings. Landslides, building collapses, and soil liquefaction occur throughout the Pacific Northwest. By the time the shaking stops, water, power, and cell service have been lost across most of the region. Nearly 1,000 highway bridges and overpasses have collapsed or are rendered unusable, cutting off-road access for dozens of communities. And the worst is still yet to come.
When the fault line slipped, it displaced billions of liters of water, creating a wave that begins to radiate outwards at 800 kilometers per hour. People living along the coast will have around 20 minutes to react. For those that have limited mobility or are cut off by damaged roads and bridges, options will be very limited. The height of a tsunami depends on the shape of the coastline. Because of the steep coasts in the region, the tsunami won't be as high as some other recent ones. However, at 10 to 15 meters, it's still high enough to completely inundate low-lying coastal communities and cause flooding up rivers more than 50 kilometers from the coast.
Over the next several hours, the wave will radiate outwards across the Pacific and cause damage as far away as Alaska, Hawaii, and Japan. Aftershocks continue possibly for months after the initial quake. Relief efforts are almost immediately mobilized from all levels of government, but they'll have their work cut out for them. It's immediately apparent that this has been one of the worst disasters to strike the continent in recent history.
Hundreds of thousands of buildings have been destroyed or damaged beyond repair. More than 100,000 people are left homeless, with many more being displaced. Up to 10,000 people might be killed. Around 70% of the deaths and injuries are a result of the tsunami, with the remainder being caused by collapsing buildings and falling debris. This would be the deadliest disaster to hit the United States or Canada in more than a century.
The cost is difficult to estimate, but the immediate cost could exceed $150 billion, making it one of the most expensive natural disasters in recorded history. The long-term economic impact could easily double that as the ports, airports, and corporations based in the area have their services interrupted for months.
Recovery is a long process. Efforts are focused on restoring essential services to population centers first. Seattle and Portland have their electricity and water fully restored after about six weeks. Meanwhile, the hardest-hit areas along the coast and isolated communities inland may be left without road access, utilities, and health care for up to three years after the quake. Thousands of the people who have been displaced may never return home.
The odds of this scenario occurring in the near future remain fairly low. But earthquakes are an inevitability, whether they happen a year from now or not for another century. So what's being done to prepare for this scenario? Funding has been allocated to bring thousands of vulnerable buildings, highways, and bridges up to code. But the process will take years or decades. Improvements have also been made to early warning systems.
With efforts from all levels of government and improvements to disaster preparedness and education, we have the best possible chance of preparing the Pacific Northwest for the next major earthquake. I've included links and resources in the description as well as links to the studies which were used to make this video. If you have ideas for future videos, leave a comment. And if you'd like to see more videos like this, click here to subscribe.
Such a disaster will happen along the Cascadia margin at some time in the future. The damage and impact will depend on the mechanics and location of the quake, the amount of coastal subsidence, the amount of damage by the earthquake, and the height of the tsunami waves. The good news is that public awareness is significant. There has been a lot of media attention, and local governments have been investing heavily in public safety projects.
Detecting Tsunamis: The US Tsunami Warning Center
Detecting Tsunamis: The US Tsunami Warning CenterVideo: NOAA Tsunami Forecasting (2:33)
NOAA Tsunami Forecasting
Today, in partnership with the USGS and NOAA, the US Tsunami Warning Center operates from Hawaii. The warning center was first created after WWII as a result of the 1946 Aleutian Island tsunami that originated between Alaska and Siberia. The tsunami produced incredibly destructive waves that traveled hundreds of miles to the south and resulted in the severe inundation of Hilo Bay, Hawaii and led to numerous deaths. Formerly initiated in 1949, the center expanded in the aftermath of the 1960 Chilean earthquake that not only destroyed many communities along the coast of Chile but also led to more destruction in Hawaii and even in Japan on the opposite side of the Pacific Ocean. With such severe long-distance impacts, it was clear that individual nations needed to collaborate in order to effectively save lives. As a result, efforts were initiated to coordinate monitoring around the Pacific, but even in 2004, the effectiveness of the center was limited as demonstrated by the 2004 Sumatran Tsunami that impacted much of the Indian Ocean. Although the earthquake and tsunami were detected from the Pacific, little could be done to monitor its progression in the Indian Ocean, and efforts were more or less futile in terms of issuing effective warnings to residents living around the Indian Ocean basin. As a result of that event, the center now coordinates with other tsunami warning centers in the U.S.and with the United Nations and similar agencies in several other countries including Japan, Australia, and others. These centers not only detect earthquake activity but also track the development and movement of tsunami waves as they travel across the world’s oceans. The main missions of these centers are to monitor and issue warnings, advisories, and watches to help reduce the loss of life associated with these events around the world.

The US Tsunami Warning Center is a great resource that provides details about specific events around the globe that are being monitored for tsunami generation. Australia and a few other countries maintain similar websites. It is worth spending a little bit of time exploring the types of tools and data that these agencies are collecting and monitoring to help keep the public as safe as possible from these types of catastrophes. It is, however, up to individuals and communities to be educated about tsunami risks and hazards and to act on the information provided in order to save lives. Individual communities are ultimately responsible for developing evacuation plans and limiting shoreline development, in especially susceptible areas. These topics will be explored in greater detail in later modules.
It’s clear that tsunamis pose an incredible threat to coastlines and societies around the world; but exactly what are tsunamis, how are they formed, and how do they interact with coastlines around the world? In order to answer these questions, we will explore two case studies. The first is the Sumatran Tsunami that occurred in December 2004, and the second is the 2011 Japanese Tsunami that devastated the island of Honshu, one of Japan’s main islands.
Module 7 Lab: Discussion
Module 7 Lab: DiscussionIn this lab, we will have a guided discussion about the impact of the March 11, 2011 tsunami on the landscape of northern Japan. We will do this by observing historical imagery on Google Earth and looking closely at images from before and after the tsunami. This is a great opportunity to study the extent and severity of the damage by the tsunami because there are many images from before and after the tsunami struck, the resolution is excellent, and there is only moderate cloud cover, so you can avoid it easily.
The goal of your observation is to determine what features you can use, both natural and human-made to determine: (a) how far inland the tsunami traveled in two different regions, and (b) how severe the damage was. As in Module 1, what I am looking for is original, thoughtful input as well as engagement in discussing other students’ ideas. First I will describe what you will need to do in Google Earth and then how you will input your ideas in the Discussion Forum.
Google Earth Observations
Open Google Earth and enter one or more of the following names in the search field:
1A. Minamisoma, Fukushima, Japan
1B. Iwaki, Fukushima, Japan
2A. Watari, Miyagi, Japan
2B. Miyagi, Japan
We will be looking at two regions, between Minamisoma and Iwaki in Fukushima Prefecture, and between Watari and Miyagi in Miyagi Prefecture.
We will be looking at features in these two locations and comparing them. It is recommended that you start observing at an elevation of 15,000 feet (4.5 km), but be ready to zoom in closer when you see something interesting. Next, turn on the historical imagery button on the upper toolbar (the clock). Look closely at images before March 11, 2011, and after. There are numerous images of the days after the tsunami struck, and you may need to look at several days to avoid clouds, breaks in the image, and darkness. It’s also easiest to start near the coast and move inland. Look at natural features as well as structures and vehicles, and notice changes between pre- and post-tsunami images.
Discussion
- Use Word or another text editor to respond to the prompt with your thoughts backed up with locations from Google Earth (Lat. Long coordinates and elevation - record as best as you can). The length of your response should be between 150 and 200 words. Pick one specific area in each prefecture (at least 2 places total) that was impacted by the tsunami. Compare the appearance of locations before and after the tsunami. Your response must include at least one location in each of the two prefectures (a total of two minimum). Look for natural features such as rivers, shorelines, forested areas, etc., to analyze the impact of flooding. Look for human-made features such as roads, houses, businesses, ports, agricultural fields, farms, etc., to analyze the impact of flooding. Be sure to write the coordinates of the places and note the distance from the coastline to discuss how far inland the tsunami waves traveled. Do you notice differences between the two prefectures? We recommend typing your response in Word or another text editor and then copying/pasting it to the discussion forum to avoid losing your work midstream in the event of an accidental browser closing, intermittent Internet connectivity, etc.).
- Go to Module 7 Lab (Discussion) and type or copy/paste your response to the prompt into the text box marked 'reply' and select Post Reply by 11:59 p.m. on Thursday to allow time for responses. Your response is now visible to your classmates and your instructor.
- Read through others’ responses and write a thoughtful reply to at least two other students by the date listed on the calendar. These replies should be either a rebuttal in which you add your ideas in the form of a persuasive argument (written with respect for the originating author) or a response that agrees with, supports, and builds upon the original response. Because a timely response to the conversation is part of your grade, subscribing to the forum is required. Check in to the discussion forum often throughout the week to post and respond to comments. Your response to at least one other classmate should be posted by 11:59 p.m. on Sunday to allow for authentic discussion.
Statement of Use of AI on Exams, Quizzes, and Labs
Grading
The grading rubric will help you understand what constitutes an appropriate level of participation on your part. The instructor reserves the right not to award any credit (including points for timing and interaction) if the content of the posts (however on-time they may be) is off-topic, offensive, or otherwise inappropriate. Such posts may be deleted at any time by the instructor.
| Content | Addresses all facets of the assigned discussion prompt, with accurate supporting detail where necessary. A response post is at least 200 words of substantive content addressing the prompt. To earn full credit in this category, your comments and replies to classmates must demonstrate thoughtful consideration of the topic and go well beyond, "I agree with you." While a discussion forum has an informal tone, please refrain from foul or offensive language, texting abbreviations, etc. |
|
|---|---|---|
| Posts should be appropriately complemented with exact coordinates that show relevant features. Specifically, features that suggest recent tsunami inundation (and others that suggest the land remained dry). You need to show examples of natural and human-made structures to get full credit. It is key that your first post shows original locations that are different from ones suggested by your classmates (it will be hard to avoid some overlap by chance, but plagiarized entries will lose credit). |
|
| Timing | This assignment is deliberately structured to allow you to participate throughout the week. Your initial response to the statement should be shared by 11:59 p.m. on Thursday and your response to at least two other classmates by 11:59 p.m. on Sunday to allow for authentic discussion to occur. | 2 points |
Summary and Final Tasks
Summary and Final TasksAs you have learned first-hand from the data presented here, tsunamis have the capacity to flood low-lying coastlines and can push waves of water inland for hundreds of meters, if not several kilometers, under the right geographic conditions. In the images studied on the website and historical imagery on Google Earth, it is easy to see how far inland the tsunami impacted.
By studying a case example like this catastrophic event, geoscientists collect incredibly important information that is absolutely critical in helping to develop plans for mitigating and or adapting to similar events that will occur in the future. Unfortunately, the findings often don’t get to people on the ground until years, if not decades, after such events – sometimes, after rebuilding has taken place. You may have noticed in the reading that large tsunamis are relatively infrequent with some happening decades apart; however, you may have also seen where they can also be more frequent as in the case of the 1960 Chile and the 1964 Alaskan events, or the 2004 Sumatra, the 2005 Sumatra, and the 2007 Sumatra earthquakes. Suffice it to say that it is critical that the general public becomes educated on the topic. Moreover, it is also important for government agencies and political leaders to act on these data and become active in the process of helping to protect life, resources, and infrastructure in new and creative ways, so we can avoid such catastrophic loss of life in the future. Hopefully, the materials covered here will lead you to an understanding of the complexities of providing communities with early warnings to protect lives and property.
Tsunamis are unpredictable, and because of their unpredictable nature, tsunamis are incredibly damaging when they occur and are very challenging to mitigate and adapt to even in the most technologically advanced countries of the world. Imagine, if one of the world’s most technologically centered societies can be rocked to its core by an event of this magnitude, what can and will happen in the future in countries like the U.S. when we are impacted again? Will our outcome be similar to or possibly even worse than the event that impacted Japan? For much of the U.S. population, the risks are perceived to be relatively low because of the minimal plate tectonic activity along the eastern seaboard in the Atlantic. However, geoscientists are still concerned about a number of high-risk areas, including the Cascadia region of the Northwest coast. What do you know about risks for tsunamis in the area that you live, vacation, or are interested in studying?
For additional Information
Japan Earthquake & Tsunami of 2011: Facts and Information
Final Tasks
Reminder - Complete all of the Module 7 tasks!
You have reached the end of Module 7! Double-check the Module 7 Roadmap to make sure you have completed all of the activities listed there before you begin Module 8.
Module 8: Coastal Engineering: Hard and Soft Structures
Module 8: Coastal Engineering: Hard and Soft StructuresIntroduction
Eroding coastlines throughout the world, particularly in large population centers where human dwellings and their way of life and infrastructure are at risk, were historically mitigated using coastal structures; which led to the development of a relatively new engineering discipline – coastal engineering. Coastal engineering is a division of civil engineering responsible for the organization, conception, development, and preservation of works along shorelines. Coastal engineers study the processes ongoing at the shoreline and construction within the coastal zone. This includes the management and mitigation of shoreline erosion; improvement of navigation channels and harbors; protection against flooding brought on by storms, tides, and even tsunamis; improvement of coastal recreation; and management of pollution in nearby marine environments.
Coastal engineering works typically consist of the installation of structures and have been conducted for hundreds of years for port development, coastal hazard protection, and reclamation of land from the sea. The needs of each country or society are fundamentally linked to the resident geologic controls, physical processes operating at a specific location, and the respective marine threats that the location is exposed to. Coastal engineering approaches to erosion or hazard mitigation have traditionally been "hard" through the installation of structures or hard approaches. In this module, we will explore these hard approaches and their advantages and disadvantages, explore erosion trends induced by these structures and how they disrupt sediment transport along coastlines, and discover alternative soft approaches to mitigation through case studies.
Visit Coastalwiki for a full description of terminology used in coastal engineering and sciences.

Goals and Objectives
Goals and Objectives- Students will develop an understanding of the mechanics of coastal erosion, and develop the fundamental geospatial and quantitative skills and concepts needed to assess coastal erosion rates.
- Students will learn about various classical coastal engineering methods for mitigating coastal hazard risks and be introduced to new alternate options for mitigating coastal hazard risks.
Learning Objectives
By the end of this module, students should be able to:
- examine the mechanics of the erosion process through the concept of a sediment budget in a coastal cell;
- observe erosion along a coastline from sequential Google Earth images;
- describe and critique a variety of methods used to mitigate coastal erosion;
- explain and contrast innovative approaches to coastal hazard mitigation and describe some alternatives and where they are used presently;
- differentiate between soft versus hard mitigation strategies and state advantages and disadvantages associated with each.
Module 8 Roadmap
| Activity Type | Assignment |
|---|---|
| To Read | In addition to reading all of the required materials here on the course website, before you begin working through this module, please read the following required readings to make sure you are familiar with the content, so you can complete the assignments.
Extra readings are clearly noted throughout the module and can be pursued as your time and interest allow. |
| To Do |
|
Questions?
If you have any questions, please use the Canvas email tool to contact the instructor.
Overview of Coastal Erosion
Overview of Coastal ErosionIntroduction
Coastal erosion is a natural phenomenon that can be exacerbated by human activities and by storms and tsunamis. In Modules 2 and 3, we briefly touched on the natural processes of coastal erosion. We discussed the role of sediment movement and deposition in the evolution of coasts. We have also mentioned that barrier islands, an important protection for inhabited coastlines, are diminishing in size worldwide due to lack of available sediment and sea level rise. We also discussed the deterioration of the world’s deltas, including the U.S. Mississippi River delta, which is a classic example. In Modules 5-7, we looked at the erosional effects of storms and tsunami waves on coastlines, and in Module 11, we will look at specific examples of the effects of erosion and other coastal changes on the human landscape. In Module 8, we will examine the topic of coastal erosion from an engineering perspective, considering the forces at work on the shoreline and the rates of sediment gain and loss, which determine the state of the shoreline.
This shoreline is naturally retreating as winter storms in the North Sea erode the soft sediment of the cliffs. Towns such as Happisburgh are at risk as the sea cliffs erode.

We will consider the natural phenomena of coastal erosion and accretion and the human-induced changes on shorelines. We will weigh the pros and cons of the many engineering strategies (hard and soft engineering) that humans have devised to control shoreline changes. First, we will explore the concept of coastal erosion and the idea of the coastal cell by reading the article linked below.
What is coastal erosion, and when is it a problem?
Defining coastal erosion is rather straightforward. But to understand the phenomenon is far from easy. There is a widespread perception that coastal erosion is always irreversible, especially, for example, immediately after a storm event when erosion is more evident. This sometimes results in a call from both local residents and political representatives for hard engineering works to be constructed. There is little public awareness of the physics behind coastal processes that causes the difference between structural and episodic erosion. Few will know how natural coasts change due to fluctuations in forcing. And that erosion can be followed by coastal accretion when boundary conditions change, either at a seasonal, annual or much longer, geological time scale.
from Conscience-eu.net: What is Coastal Erosion and When is it a Problem?
Required Reading
Read the following sections on the Conscience website, making notes as you go, with a focus on the details of the definition of coastal erosion and the processes at work in the coastal (or littoral) cell concept:
Learning Check Point
Please answer the questions below.
The Dynamic Coastline and Human Uses
The Dynamic Coastline and Human Uses
While maps typically delineate the transitions between land and sea with clear lines, in reality, the coastline is much less well-defined. The position of the coastline through time is highly variable, from the daily fluctuations of the water’s edge at beaches due to tides to the shoreline advance or retreat over hundreds of kilometers with geologic-scale or climatic influenced sea level fluctuations. As you read in the ConScience article, the coastline position does not just depend on sea level; instead, the supply of sediments to the coast and the processes responsible for their redistribution within a coastal cell are both responsible for coastal evolution. Coastal erosion removes material from the shoreline and redistributes it to other parts of the coastal cell. While erosion is usually most drastic during extreme events with associated high surges and waves, shoreline erosion can also occur gradually over a longer time period due to sediment deficits.
In modern times (decadal timescales), many of the world’s coastlines are characterized by erosion (approximately 70% of the world’s sandy coastlines are retreating). This widespread erosion is due to a variety of factors, most notably:
- global eustatic sea level rise that has occurred over the past century;
- global reductions in the supply of sediment reaching the coast (due to sediment impoundment behind dams, urbanization, etc.);
- human engineering at the coast that restrict sediment movement (harbors, seawalls, groins).
Coastal erosion is a naturally occurring process that can be exacerbated and becomes a significant problem when the dynamic coastline impinges on the fixed human infrastructure and uses within the coastal zone. Despite the potential risk of coastal erosion or flooding within the coastal zone, the majority of the world’s human population resides there, and in fact, numbers continue to grow as people migrate to coastal cities. Coasts continue to support the economic centers of the world, while at the same time critically ecologically important and sensitive natural habitats are supported by coastal zones. Coastal zones support a wide variety of human land uses. Tourist resorts, fishing communities, farming, aquaculture, and other land uses all vie for space on the coasts of the world, and often come into conflict with each other and with the dynamic interface between land and water. While inland areas are undoubtedly less vulnerable to coastal hazards, the coastal zone has been historically rich in resources and uniquely suited to support economic activities such as trade, industry, and tourism, attracting settlement and migration despite the elevated risks.
The primary impact of human activities within the coastal zone is the displacement of natural habitat with development, an increasing problem with continued coastal population growth. This issue will be examined in detail in Module 11 case studies. In the following pages, we will examine more closely the mechanics of coastal erosion and the human engineering strategies employed around the world to mitigate coastal erosion to sustain human land uses on the coast. We will question each approach in terms of sustainability in the context of the dynamics of the coastal zone and the increased challenges related to climate change.
These land use change maps of Egypt's Nile Delta, which are shown in the link below, show change over 24 years, between 1990 and 2014. Comparison of the two maps reveals many changes to the land-water interface on this coast. As you compare the two images, you will notice that the human activities that impact the coastline, such as fish farming and urban areas increase in area. The area of natural coastal lands decreases in area. Almost all urbanized coastal zones around the world will show complex land use changes such as these over the past few decades.
Coastal Protection and Mitigation
Coastal Protection and MitigationAlong much of the world’s coastlines, the intersection of vulnerability (e.g., high populations, economic activities supported by the coastal zone) and coastal hazards (e.g., coastal erosion, coastal flooding) produces a risk that is unacceptable to the particular community and society, requiring the use of coastal protection measures to reduce the risk. The following sections detail some of the typical “hard” and “soft” coastal protection measures and how they impact risk and the environment in the coastal zone.
Coastal Protection Using Hard Structures
Coastal Protection Using Hard StructuresCoastal structures are frequently constructed to prevent erosion of coastal landscapes and infrastructure and mitigate the risks to the populations and economic activities dependent on the coastal zone. Coastal structures, sometimes referred to as “hard” structures, are usually built using materials (at least for certain coasts and beaches) that do not form naturally, such as of concrete, large armor stone, steel, or timber, are relatively permanent (typical 50-yr design life), and are spatially-fixed within an otherwise dynamic coastal zone. The most important hard structure types are dikes (levees), seawalls, breakwaters, groins, and jetties. The following descriptions are taken directly from the USACE Coastal Engineering Manual, the primary reference for coastal structure design in the U.S. Next, read about the hard structures and what each one does to protect the coast.
Sea Dikes
Sea DikesSea dikes are onshore structures with the principal function of protecting low-lying areas against flooding. Sea dikes are usually built as a mound of fine materials like sand and clay with a gentle seaward slope in order to reduce the wave runup and the erodible effect of the waves. The surface of the dike is armored with grass, asphalt, stones, or concrete slabs (USACE, 2005).

Seawalls
SeawallsSeawalls are onshore structures with the principal function of preventing or alleviating overtopping and flooding of the land and the structures behind due to storm surges and waves. Seawalls are built parallel to the shoreline as a reinforcement of a part of the coastal profile. Quite often, seawalls are used to protect promenades, roads, and houses seaward of the crest edge of the natural beach profile. In these cases, a seawall structure protruding vertically or close to vertically from the beach profile must be built. Seawalls range from vertical face structures such as massive gravity concrete walls, tied walls using steel or concrete piling, and stone-filled cribwork to sloping structures with typical surfaces being reinforced concrete slabs, concrete armor units, or stone rubble (bulkheads, revetments, and Rip Rap are different types of seawalls).


Detached Breakwaters
Detached BreakwatersDetached breakwaters are small, relatively short, non-shore-connected nearshore breakwaters with the principal function of reducing beach erosion. They are built parallel to the shore just seaward of the shoreline in shallow water depths, using solid concrete structures, piles of stone/concrete blocks, or rubble mound. Multiple detached breakwaters spaced along the shoreline can provide protection to substantial shoreline frontages. The gaps between the breakwaters are in most cases on the same order of magnitude as the length of one individual structure. Each breakwater reflects and dissipates some of the incoming wave energy, thus reducing wave heights in the lee of the structure, interrupting transport along the shore, and reducing shore erosion. Beach material transported along the beach moves into the sheltered area behind the breakwater, where it is deposited in the lower wave energy region. The nearshore wave pattern, which is strongly influenced by diffraction* at the heads of the structures, will cause salients and sometimes tombolos to be formed, thus producing a shoreline similar to a series of pocket beaches. Once formed, there is positive feedback: the pockets will cause wave refraction, which helps to stabilize the pocket-shaped coastline. Breakwaters can also be constructed with one end linked to the shore, in which case they are usually classified as sea walls.
Recommended Reading
Read over Marine Biodiversity Wiki: Detached Breakwaters to learn about these features.
The figures below illustrate the formation of salients (cusps of sediment protruding from the shore) and tombolos (larger cusps that attach to the breakwater), to form the pockets described above.


*(for a definition of Diffraction visit the Coastal Wiki website).
Groins
GroinsGroins are built to stabilize a stretch of natural or artificially nourished beach against erosion that is due primarily to a net longshore loss of beach material. Groins function only when longshore transport occurs. Groins are narrow structures, usually straight and perpendicular to the pre-project shoreline. The effect of a single groin is the accretion of beach material on the updrift side and erosion on the downdrift side; both effects extend some distance from the structure. Consequently, a groin system (series of groins) results in a saw-tooth-shaped shoreline within the groin field and a differential in beach level on either side of the groins.

Jetties
JettiesJetties are used for the stabilization of navigation channels at river mouths and tidal inlets. Jetties are shore-connected structures generally built on either one or both sides of the navigation channel, perpendicular to the shore and extending into the ocean. By confining the stream or tidal flow, it is possible to reduce channel shoaling and decrease dredging requirements. Moreover, on coastlines with strong longshore currents and longshore sediment transport, jetties also function to arrest the crosscurrent and direct it across the entrance in deeper water where it represents less hazard to navigation. When extended offshore of the breaker zone, jetties improve the maneuvering of ships by providing shelter against storm waves. Jetties are constructed using methods and materials similar to breakwaters.

Disadvantages of Hard Structures
Disadvantages of Hard StructuresWhile hard coastal structures can be the most effective option for flood protection and/or mitigation, or for stabilizing a shoreline at a fixed position, there is a price to pay. Hard structures partially hinder the recreational use of the coastal zone and can cause adverse ecological effects within the coastal zone. For example, when seawalls are constructed on eroding beaches, the erosion continues so that the beach in front of the seawall can become very narrow or disappear completely. And while groins and jetties trap sediment on the updrift side, resulting in shoreline accretion, there is corresponding shoreline erosion on the downdrift side due to the interruption in longshore transport. Some of the disadvantages of hard structures include:
- Visual impacts
- Horizontal and vertical access restrictions
- Loss of sand supply to beach from armoring backshore
- Placement losses with construction of revetment or seawall
- Passive erosion
- Active erosion
Recommended Reading
Learning Check Point
Learning Check PointLook at the figure below and then answer the questions below.

After examining the Coastline figure, consider how you would answer the questions below.
Coastal Protection Using Soft Structures
Coastal Protection Using Soft StructuresWhat is Soft Shoreline Stabilization?
It is the stabilization of the shoreline using environmentally friendly techniques used to protect property and uses from shoreline erosion. The main objective of soft shoreline stabilization is to achieve a balance between the need for protection against erosion while maintaining and enhancing shoreline functions.
Contrary to shorelines that are completely hardened with structures (described earlier), soft stabilization methods seek to incorporate key features into the design that either maintain or enhance functions of the shoreline, or those that allow natural processes to continue. But, natural processes, such as the movement of sand along a beach or barrier island or sediment moving along cliff coasts, headlands, etc., can vary widely between sites, making soft stabilization methods quite variant as well. Soft stabilization methods are highly dependent on local environments, and processes governing sediment pathways in each system. As such, additional planning for these methods may be required because of differences in coastal geomorphology, physical processes governing sediment transport, and because local ordinances vary across state boundaries.
As our understanding of the effects of hard stabilization methods increases, many traditional coastal engineering practices are slowly being phased out, especially where soft stabilization methods can replace or restore the ecological function, establish energy continuity, and offer sufficient protection. But, soft shoreline stabilization is a complex topic. Many federal and state agencies, including the National Oceanic and Atmospheric Administration (NOAA) Coastal Services Center, have been working for many years to implement programs to facilitate such protection practices with a fair amount of success. However, we still have a lot to learn before we can completely abandon hard structures. This is especially true if relocating communities that are at immediate risk is not possible (recall concepts in coastal vulnerability, exposure, and rising seas, from previous modules).
Required and Recommended Reading
Useful information on some approaches and guidelines:
Required:
Recommended:
Principles and Objectives of Soft Shoreline Stabilization
Principles and Objectives of Soft Shoreline StabilizationProtection or mitigation of shorelines using soft approaches has some simple objectives and three basic principles.
The first principle is, try to imitate nature. Within each geomorphic environment, sediment characteristics, shoreline slope, and terrestrial and submerged habitat will be specific, hence using native plants and sediments that have already been exposed and shaped by forces within the specific coastal zone are critical to the success of soft mitigation methods. Plants help retain the soil matrix with their roots, and often offer good protection to erosion. On the other hand, if an area is subjected to higher energy conditions where vegetation is not naturally found, such as a beach, trying to steady the shoreline using vegetation along the high energy environment of the beach might not be a good idea. The fast-moving water and energy resulting from tidal currents and breaking waves will uproot the plants and quickly render the plants ineffective.
The second principle is, maintain gentle slopes. Unless we are in rocky coasts or regions with bedrock exposure, natural slopes where sediment is stable under gravity (less than the angle of repose) are relatively gentle. Maintaining a gentle slope allows for gradual dissipation of wave energy across a longer distance, hence the energy acting on each unit area is much lower compared to a vertical wall.
The third principle is, employ combined or mixed material approaches. Along many shorelines, we see a variety of terrestrial plants, various sediment sizes ranging from mud to sand or gravel, and shorelines are often lined with trees and other plants, and slopes can vary widely. Therefore, using a combination of approaches that imitates nearby natural shorelines is the best recipe for the successful implementation of soft approaches.
Methods of protection also often involve integrated approaches that include a combination of soft and non-traditional hard structure approaches.
Examples of Soft Shoreline Stabilization
Examples of Soft Shoreline StabilizationThere are many methods of soft shoreline stabilization with complex construction methodologies and materials. Here we will list a few examples for illustrative purposes in order to introduce the concept, and examine case studies that demonstrate how these methods work.
Soil Bio-engineering and Streambank Stabilization
Soil Bio-engineering and Streambank StabilizationCase Study 1: Jacques-Cartier Park
Stream and riverbank protection efforts in populated areas are expected to address issues such as habitat, aesthetics, and water quality, as much as they address needs such as flood control and erosion protection. Therefore, integrated streambank protection designs that include vegetation are likely to satisfy these multiple objectives. Soil bioengineering is a method routinely used to address erosion and can be achieved in many ways across different systems. These systems utilize hybrid approaches that use geotextile fabrics and/or vegetation and can provide sound streambank protection while maximizing ecological and water quality benefits. These methods are used in place of riprap, concrete, or other inert structures alone. The Jacques-Cartier Park case study describes soil bioengineering systems that have been used to meet specific aquatic and riparian habitat objectives, and the procedures developed for this project are considered or have been used elsewhere where environmental concerns are placed high on the priority list, such as Alaska and the Ottawa River in Canada, which divides the Provinces of Ontario and Quebec.
Soil bioengineering methods have a common geotechnical benefit of providing root reinforcement in the soil and can help modify drainage patterns of the soil, help stabilize soils at steeper angles if desired, help keep grasses, and bushy vegetation in place resisting erosion, and support woody debris or other types of vegetation. The species of woody vegetation selected for inclusion in soil bioengineering systems can have a significant effect on the habitat benefits. While various species of willow are the most common woody plants used in soil bioengineering because of their excellent rooting ability, good overhanging cover and shade for streams, good nesting habitat for some species of birds, and some cover for mammals, it is not noted as an excellent food source for land animals, nor it is suitable for saline systems and may have limited applications in coastal settings.
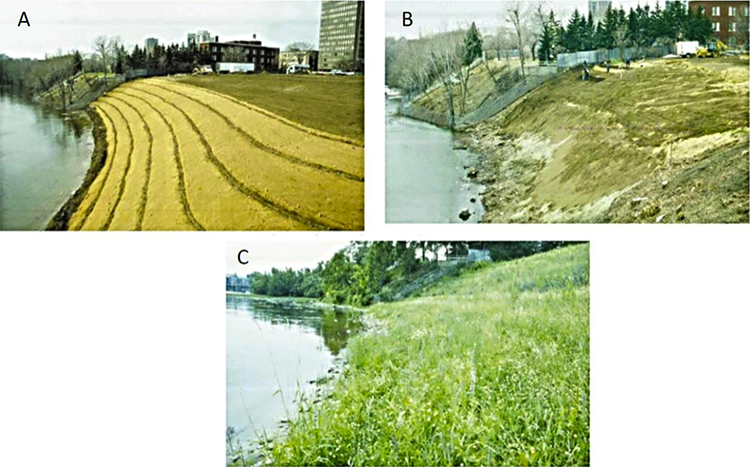
As part of the remediation of the Jacques-Cartier Park site, contaminated soils and materials were excavated and replaced with a sand/clay subsoil mix (A) and the resulting embankment was then topped off with a new topsoil blend. The steepness of the constructed slope and the presence of the river below required using live fascines (bundles of brush) on the contour with erosion control fabric made of coir (fiber from coconut husk) to provide surface stability (B). Other project objectives for this case study included preparing a foundation where, over time, a natural community of indigenous plant materials for upland and riverine habitat would evolve, thereby improving aesthetics and establishing a long-term, maintenance-free natural slope along the Ottawa River within its highly urbanized context. The success of this project to meet the desired goals enabled Public Works to designate the area as an extension of Jacques Cartier Park (C).
Case Study 2: Waquoit Bay Preserve, Massachusetts
In this more coastal example, the Massachusetts Office of Coastal Zone Management Stormsmart Coasts Program provides guidance to property owners wishing to use bioengineering techniques to stabilize shorelines on their property. The use of a matting material made of coconut fiber called coir logs is used in combination with planting native vegetation. This is described in StormSmart Properties Fact Sheet 4: Bioengineering - Coir Rolls on Coastal Bank, a public information brochure provided to the public on the Mass.gov website. In another example, Wilkinson Engineering was employed to stabilize a shoreline on Waquoit Bay in Massachusetts. They used a variety of methods, including changing the angle of slope, installing "coir" matting to stabilize the bank, and establishing a fringing marsh at the base of the slope.
Recommended Resource
Bioengineering Strategies: Reducing Coastal Erosion and Coastal Storm Damage While Minimizing Impacts illustrates the series of steps employed in bioengineering to stabilize a coastal shoreline on Waquoit Bay. Take a look at this richly illustrated document explaining the process.
Geosynthetics – Geotubes/Geotextiles
Geosynthetics – Geotubes/GeotextilesCase Study 3: Hurricane Protection in Grand Isle, Louisiana, USA
Geotextiles or geosynthetics have become very popular methods for several streambank stabilization projects, dune stabilization, and generally when earthen stability is required. A geotextile material that can be chosen varies in thickness and porosity and will depend largely on soil properties or whether it is necessary to improve a soil property – for instance, to increase surface soil strength, increase erosion resistance, or stabilize weak soils on steep slopes. For the case study in Grand Isle, LA, the objective was to protect the island from storm waves and storm surge, a function that is typical of a dune system. However, the island is highly exposed to the Gulf of Mexico storm waves that frequently overwash and erode the dune system, with increasing dune rebuilding costs after each storm. To protect against this erosion, coastal engineers employed geotubes, which were filled with native material excavated from the existing storm-damaged dune system. Once put in place, the tubes were covered with a top layer of sand and were vegetated for added soil stability. Over time, wind-blown sand from the beach system accumulates at the seaward side of the dune system and organizes into smaller dunes, where additional vegetation growth takes place and provides additional protection from waves and storm surges approaching the island.


Coastal Dune Protection and Restoration
Coastal Dune Protection and RestorationCase Study 4: Dunes in Massachusetts
Sand dunes are common features in coastal zones and desert environments. Along the coast, dunes can protect beaches from erosion during storms and supply sand to a beach that is eroding. Dunes also provide habitat for highly specialized plants and animals, including rare and endangered species. Because of threats by both intentional and unintentional human activity and because of the benefits they offer, such as storm protection and sediment cycling between dune and beach environment, many countries such as the Netherlands, United Kingdom, and the United States employ dune protection programs. These include stabilization programs and restoration efforts centered on building or re-building dunes. Protection, stabilization, and restoration methods utilize measures to reduce the transport of sand by wind and water, such as planting vegetation, constructing sand fences, and selecting access areas that avoid damage to dunes and dune vegetation from foot traffic.
It is important to consider dune structure when planting dune vegetation. Dunes are composed of the foredune (the part that faces the ocean), the sand plain (the dune crest or top), and the backdune (the side facing away from the ocean). The micro-environments of these dune components limit the types of plants that can thrive on them. For instance, foredune plants need to be tolerant to salt spray, strong winds, and some burial by wind-blown sand from the berm and beach environment, while sand plain and backdune plants can be less tolerant of these stresses because they are typically protected from salt spray and sand burial.
Managing coastal dunes for use as part of a flood protection and mitigation strategy involves an integrated management approach or plan, which follows closely with some of the principles we introduced for soft shoreline engineering. These are to:
- restore and preserve natural processes (that is, work with nature);
- create conditions and opportunities for establishing future natural processes (that is, maintain mass and energy flow);
- prevent land use practices that hinder any of the above.
In the Cape Cod area of Massachusetts, erosion caused by winter storms, in particular, results in loss of beach area. And one solution put into practice to address this issue is dune restoration using sand fencing to trap sand and build new dunes. This technique, in concert with planting suitable beach grass species to hold the sand in place, can be a very effective method.
Recommended Resource
The document "Coastal Dune Protection and Restoration" from Woods Hole Sea Grant and Cape Cod Cooperative Extension provides excellent details and illustrations of the process.

Advantages and Disadvantages of Soft Shoreline Stabilization
Advantages and Disadvantages of Soft Shoreline StabilizationAlternative soft stabilization approaches can offer many benefits over typical hard stabilization structures. Often these approaches are referred to as living shorelines because they offer added ecological benefits. Some of the benefits of soft stabilization approaches include:
- maintaining natural shoreline dynamics and healthy sand movement across a coastal cell;
- trapping sand to rebuild eroded shorelines or maintain current shoreline form;
- providing or enhancing important shoreline habitat;
- reducing wave energy impacts at or seaward of the shoreline;
- absorbing storm surge and floodwaters;
- filtering nutrients and other pollutants from the water;
- maintaining beach and intertidal areas that offer public access opportunities for wading, fishing, and walking;
- reducing the costs of stabilization from bulkheads, rip rap, and other hard structural approaches;
- creating a carbon sink and thereby helping mitigate climate change.
While there are many benefits associated with living shorelines, they are not appropriate for all geomorphic environments. Drawbacks for living shorelines include:
- not being appropriate for high energy environments;
- not being as effective where much of the shoreline is already hardened;
- being more difficult to design and install than more traditional hard structural approaches;
- having limited information available on the effectiveness of living shorelines for different types of shorelines, energy regimes, and storm conditions.
Earth Systems in Action: Development and Coastlines
Earth Systems in Action: Development and CoastlinesAs you have just discovered, humans have undertaken a wide range of initiatives to try and protect some coastlines and limit the amount of coastal erosion that is taking place. These initiatives include the construction of hard protective structures such as breakwaters and seawalls or the imitation of natural processes that include the placement of sediment in key locations or planting vegetation to stabilize loose unconsolidated sediment. The decision to use one method over another is extremely complex, requires a solid understanding of the system to be protected, and consideration of the economics and politics of a project.
Suppose, for example, that you own beachfront property and historically the beach in front of your house has been retreating landward, toward your house, at a rate of a meter per year for the last decade because of the combined effects of erosive storms and reduced sediment supply. On the basis of the historic trend, it is clear that within another decade the waves will be at your door. It is clearly, then, in your best interest to develop some sort of project that will help reduce the erosion and cause the beach to begin building seaward again. What are your options?
You could go to the local city council and suggest that a series of groins be placed along the beach in a location that will help trap sediment carried by longshore transport. For this to be effective, you would, however, need to have an excellent understanding of the longshore transport patterns on a daily and longer time frame. Placement of the groin in the wrong place could actually have a negative effect on the beach at your property (depending on the direction of transport) and enhance the erosion. Additionally, you would have to consider the impact of such a structure to the neighboring beaches. Do you think that your neighbors would advocate for structures to protect your beach if it would then also cause erosion in front of their properties? What about the cost of such a structure and who would pay for it? Projects such as this can cost millions or tens of millions of dollars, and you do not have the finances to cover the costs. So, who will pay for it? Suppose I am a taxpayer in a more landward located county. Do you think I would advocate for my taxes to be used to protect your beach-front property if the school my kids attend needs new technology and computers that are normally paid for by the same tax money?
In this example, numerous systems need to be considered, ranging from the natural longshore transport system to the local economic and political system. It is clear that situations such as this are extremely complex and require careful planning and implementation, and, in most cases, not everyone is content with the final outcome.
Module 8 Lab
Module 8 LabIntroduction
The objective of this Lab is to help you develop an appreciation for coastal erosion and associated risks when placing major infrastructure proximal to coastal hazards.
Ocean Beach is a sandy beach backed by erodible bluffs that form the boundary between the western edge of the city of San Francisco, CA and the Pacific Ocean. Like many sandy coasts around the world, portions of Ocean Beach have experienced significant erosion in the past decades. The long-term erosional trend along the southern reach of the beach has been punctuated by periods of intense erosion during particularly severe winter El Niño storm seasons, when the beach and backing bluffs can be exposed to very high waves.
The situation is complicated by the presence of critical infrastructure within the coastal zone. The Great Highway, an important transportation link, is located on top of the bluffs backing Ocean Beach, and recent erosional events damaged parking areas and forced the closure of one direction of traffic for much of the storm season. More importantly, a large sewage tunnel runs under the Great Highway, transporting the city’s wastewater south to a treatment plant. Continued erosion threatens this piece of expensive, critical wastewater infrastructure, and it must be protected in the near term to prevent both the environmental consequences of a tunnel failure and the huge cost of relocation. During the most intense erosion episode during the 2009-2010 El Niño winter, the city constructed an emergency revetment of armored stone along the eroding bluff to protect the wastewater infrastructure; however, the use of “hard” coastal protection structures met stiff opposition from environmentalists and local regulatory agencies due to the inevitable loss of beach in front of the structure.
Required Reading
Be sure you have read "SPUR: The Future of Ocean Beach," located on the Module 8 Roadmap. The article details the coastal erosion and management issues at Ocean Beach.


Lab Overview
After you thoroughly read the article “SPUR: The Future of Ocean Beach” (mentioned above, follow the steps in the Module 8 Lab Worksheet below.
Downloads/Resources
Statement of Use of AI on Exams, Quizzes, and Labs
Instructions
Before you begin the Lab, you will need to download the Lab worksheet. We advise you to either print or download/save the Lab worksheet, as it contains the steps you need to take to complete the Lab in Google Earth. In addition, it contains prompts for questions that you should take note of (by writing down or typing in) as you work through the Lab.
Once you have worked through all of the steps, you will go to the Module 8 Lab to complete the Lab by answering multiple-choice questions. The answers to questions on this Lab worksheet will match choices in the multiple-choice questions. Submit the quiz for credit.
Summary and Final Tasks
Summary and Final TasksIn Module 8, you have learned about the various traditional "hard" structures used in coastal engineering for shoreline stabilization and flood protection. However, hard structures partially hinder the recreational use of the coastal zone and can cause adverse ecological effects within the coastal zone. Groins, and jetties in particular, interrupt longshore sediment transport, causing updrift accretion and downdrift erosion of the shoreline. Soft shoreline stabilization methods offer an alternative to hard structures by using environmentally friendly techniques that enhance ecological functions and allow natural processes to continue. In the activities, you viewed different coastal areas with erosional shorelines, learned how to measure the long-term erosion rates, and became familiar with some of the complications of real-world problems where choices between the use of hard or soft structures must be made.
Reminder - Complete all of the Module 8 tasks!
You have reached the end of Module 8! Double-check the Module 8 Roadmap to make sure you have completed all of the activities listed there before you begin Module 9.
References and Recommended Reading
- U.S. Army Corps of Engineers. (2002). Coastal Engineering Manual. Coastal Engineering Manual (pp. 1–62). Washington, D.C.: U.S. Army Corps of Engineers. doi:10.1093/intimm/dxs026
- Larson, M., Hanson, H., & Kraus, N. C. (1987). Analytical Solutions of the One-Line Model of Shoreline Change.
- IPCC. (2007a). Climate Change 2007 - The Physical Science Basis: Working Group I Contribution to the Fourth Assessment Report of the IPCC. (M. Tignor & H. L. Miller, Eds.)Science (p. 1009). Cambridge University Press.
- IPCC. (2007b). Climate Change 2007: Impacts, Adaptation and Vulnerability. (M. L. Parry, O. F. Canziani, J. P. Palutikof, P. J. Van Der Linden, & C. E. Hanson, Eds.)the Intergovernmental Panel on Climate Change (Vol. 114, p. 976). Cambridge University Press. Retrieved from http://www.ipcc.ch/ipccreports/ar4-wg2.htm
- Barnard, P. L., Hansen, J. E., & Erikson, L. H. (2012). Synthesis Study of an Erosion Hot Spot, Ocean Beach, California. Journal of Coastal Research, 28(4), 903–922.
- Bosboom, J., & Stive, M. J. F. (2010). Coastal Dynamics 1: Lecture notes CT4305. Delft, the Netherlands: Delft University of Technology, Faculty of Civil Engineering and Geosciences, Section of Hydraulic Engineering.
Capstone Project: Stage 3 Instructions and Examples
Capstone Project: Stage 3 Instructions and ExamplesYou are now in Stage 3 of the Capstone Project, in which you will populate the Stage 3 section of the CVAT Coast City Audit PowerPoint with relevant details on topics related to the human systems and coastal engineering concepts covered in Modules 8-10.
Directions
- Complete Stage 3 of the CVAT Coastal City Audit PowerPoint: Engineering Infrastructure Assessment: (Green Section). Include slides relevant to this stage for your City Slide presentation in indicated spaces.
- Make sure you insert references for your information sources as you go along.
- Submit your updated CVAT PowerPoint here by the due date. Please employ the following naming convention: Last Name_First Name Stage3.pptx
- After you have submitted Capstone Stage 3 with the City Slides and have received feedback from your instructor, you may make revisions to your City Slide figures. Remember they will be included in your end-of-semester presentation.
Statement on Use of AI in Capstone Research
AI is a powerful tool for doing research and learning when used correctly. We allow the use of AI to research your Capstone city with the following strict conditions:
- You can use AI for research, but you cannot under any circumstances copy out of AI directly into the CVAT. You must rewrite everything in your own words. We can and will check all entries with a ChatGPT checker, which detects AI-generated text with 96% accuracy. There is no credit given for grammar, so please write everything from scratch and do not use Grammarly, as these can trip the AI checkers. Any direct copying will result in a ZERO for the assignment. You must cite all references that AI gives you.
- You will also include slides for your City Slides presentation relevant to Stage 3 for feedback. You cannot use AI for these under any circumstances for the City Slides, you can search for images using Google Images or any other search engine. Copying images or presentations out of AI is easily detected because and will receive a strict penalty.
Rubric
| Capstone Stage | Activity | Criteria | Points |
|---|---|---|---|
| CVAT Stage 3: Engineering and Infrastructure Assessment | Complete CVAT Stage 3: Engineering and Infrastructure Assessment and submit by the due date. The instructor will grade your work and provide feedback where needed to help you improve your project. | Thorough and accurate analysis of the hard and soft engineering and structural and non-structural strategies/ coastal defenses used by the city. References cited. (10 points); Mostly complete; Some inaccuracies/missing information or misinterpretation of the human system and the strategies for coastal defenses and mitigation used by the city. No references. (6 points); Incomplete: Many inaccuracies/ misinterpretations/missing information on the human system and strategies for coastal defenses and mitigation used by the city. No references. (4 points); Poor attempt to analyze the human system and coastal defense strategies. Few details provided and many inaccuracies. No references/ AI sources not cited. (2 points); No Information on these topics (0 points). | 10 |
Examples
We post a couple of examples below to help you get going. We stress that there are no correct answers, and these examples are just for guidance, to help you with questions about the amount of detail we expect in various components of the Capstone project. Also these were taken from a previous version of the CVAT which was more detailed. Every city is different, and there may be more information in one area or another for a specific city. For example, there is often more information, particularly in the engineering and policy areas, for U.S., European, and some Asian cities than there is for some cities in Africa. Again, please use these examples for guidance, along with the detailed directions for each stage, and let us know if you have any questions.
Capstone Project Stage 3 Example: San Francisco
Click on the expansion arrows at the bottom right of the slide show to view full-size images.
Capstone Project Stage 3 Example: Shenzhen, China
Click on the expansion arrows at the bottom right of the slide show to view full-size images.
Module 9: Managed Retreat
Module 9: Managed RetreatIntroduction
In Module 9, we will explore questions around whether rebuilding after a major hurricane or repeated coastal flooding is the best approach. Here, we will look at some of the alternatives to rebuilding in place and strengthening the flood defenses with larger and stronger structures. We will consider the concepts of managed retreat, moving entire communities, and alternate approaches for achieving more resilient coastal communities.
Goals and Objectives
Goals and ObjectivesStudents will be introduced to ideas of managed retreat and relocation of communities in coastal environments due to repeated impacts from coastal hazards; they will consider the idea of multi-layered defenses and continue to examine the rebuild versus retreat debate.
Learning Objectives
By the end of this module, students should be able to:
- investigate alternative methods for non-structural shoreline hazard mitigation, including managed retreat and multi-layered defenses;
- explore the pros and cons, including cost-benefits of managed retreat case studies and consider examples of communities facing retreat as an option and the factors leading to these decisions;
- analyze hypothetical storm surge impacts on communities on the Louisiana coast using Google Earth and online tools.
Module 9 Roadmap
| Activity Type | Assignment |
|---|---|
| To Read | In addition to reading all of the required materials here on the course website, before you begin working through this module, please read the following required readings to make sure you are familiar with the content so you can complete the assignments.
Extra readings are clearly noted throughout the module and can be pursued as your time and interest allow. |
| To Do |
|
Questions?
If you have any questions, please use the Canvas email tool to contact the instructor.
Alternate Approaches to Coastal Hazard Mitigation
Alternate Approaches to Coastal Hazard MitigationAfter Super Storm Sandy devastated the New Jersey coast and flooded coastal New York, including parts of Manhattan, the debate about rebuilding in place or implementing more sustainable coastal hazard mitigation practices has raged in the U.S.
The traditional practices in the U.S. and in other countries around the world have been to armor the shorelines and replenish beaches to prevent or mitigate erosion. Here in the U.S., recovery from flooding has relied on programs such as the National Flood Insurance Program, the Federal Emergency Management Agency (FEMA), and others, to allow home and business owners to rebuild.
Around the world, there is a growing recognition that hard structure protection and rebuilding in place are not sustainable practices, especially as we become increasingly aware that storms of Sandy and Katrina magnitude may be occurring more frequently with our changing climate. Greater emphasis is now being placed on coastal communities developing better resilience to repeated coastal flood events and sea level rise.
Following the devastation of Sandy in the northeast, some geologists weighed in on the debate to advocate alternatives to rebuilding, such as managed retreat. Here, we will take a look at some ideas from one leading group of coastal scientists, led by Orrin Pilkey, who has spent his career thinking and writing about how to live with dynamic shorelines. Here, he is vocal in making the call that there needs to be a change in policy in the U.S. when it comes to trying to combat catastrophic flooding along our coasts. The case study focusing on rebuilding after Sandy on the Jersey Shore in the reading "Rebuild or Retreat from the Jersey Shore", in which a piece from WNYC follows homeowners debating on the future of their community after Sandy, highlights once more the dichotomy of opinions about the need to retreat from the shoreline versus the need to maintain a lucrative tourism and vacation home economy by holding things in place, at least for now.
Required Readings
Read the following two articles in which Orrin H. Pilkey, emeritus professor of earth sciences at Duke University, explains the rationale behind moving away from the “madness” of rebuilding in places that have proven to have high rates of repetitive impacts of coastal hazards such as hurricane storm surges. In the second piece, other opinions are voiced in relation to the dilemma on the Jersey Shore. As you consider the range of opinions, make a list of key points, and use these to answer the Learning Check Point questions below to reflect on the ideas put forth and develop your own ideas about the need to change the way things are done on built shorelines in the U.S.
After reading both articles, please complete the Learning Check Point below before moving onto the next section.
Learning Check Point
While this Learning Check Point is not for credit, you will be expected to know the material for the Module 9 Quiz.
Please take a few minutes and answer the questions below.
What is Managed Retreat?
What is Managed Retreat?In the readings on the previous page, much of the thinking was in response to a catastrophic event, such as Hurricane Sandy. On the Jersey Shore, the emphasis has been on building higher dunes to mitigate the problem of coastal hazards threatening human infrastructure. However, as the coastal scientists point out, dunes and other beach features have a tendency to migrate landward. As sea levels rise, this natural migration will accelerate. Options that involve working with these natural processes rather than trying to control them involve a longer-term approach and, as we have seen, can be controversial. We will look at some examples of places where these alternative methods have been employed using the principles of managed retreat or managed realignment, which are in contrast to the more reactionary approach of rebuilding structures in place and protecting them with dunes and other engineered lines of defense.
Managed retreat or managed realignment is a coastal management strategy that allows the shoreline to move inland, instead of attempting to hold the line with structural engineering. At the same time, natural coastal habitat is enhanced seaward of a new line of defense. This approach is relatively new, but is gaining traction among coastal policymakers and managers in the face of increased coastal hazard risks. There is a growing recognition that attempting to “hold the line” in many places is a losing battle.
In many cases of managed retreat, human development is “moved” out of harm’s way and natural areas are restored to enhance their ecosystem services. Typically, flood defenses are set back from the shoreline, and flooding is allowed in the previously defended area. Usually, natural coastal habitat is preserved seaward of the man-made defense, and it provides extra protection or a buffer from flooding.
Managed retreat can be complex and often contentious, as it can include delineating a new line to which structures can be built and home and business owners must be bought out.
Components of managed retreat may include:
- coastal planning;
- relocation and buy-back and buy-out programs;
- regulating types of development allowed;
- designating no-build areas;
- habitat restoration;
- replacement of built environment with green space.
For managed retreat or managed realignment to be successful, a number of criteria or conditions must be met, according to authors Gardiner et al., and Rupp and Nicholls. These are listed below. Perhaps points 4-6 are the criteria that are lacking most often. As we will read in the following case studies, few managed retreat projects are accomplished without controversy and lengthy debate. In places where the level of development on the shoreline is high, managed realignment may not be an option at all, at least in the present conditions.
"Six of the most important conditions are given below (Gardiner et al., 2007; Rupp-Armstrong and Nicholls, forthcoming):
- presence of coastal defenses
- availability of low-lying land
- desire or need to improve flood or coastal defense systems
- presence of a sustainability-oriented coastal management attitude
- desire or need to create intertidal habitats
- societal awareness about the benefits of managed realignment"
In this module, we will explore examples of managed retreat in the U.S. and the U.K. to gain an understanding of the complexities of implementing these projects. We will also consider the discussions of managed retreat options in large cities that are particularly vulnerable to inundation.
In addition, we will look at the dilemma of whole communities facing decisions to relocate in the face of repeated flooding, as well as other mitigation measures such as elevating homes and changing building codes.
Learning Check Point
Objective
Investigate alternative methods for non-structural shoreline hazard mitigation, including managed retreat and multi-layered defenses.
While this Learning Check Point is not for credit, you will be expected to know the material in Module 9 Quiz.
Explore the examples of managed retreat in this ArcGIS Story Map, created by Virginia Institute for Marine Sciences: After reading, consider how you would answer the questions on the cards below. Click "Turn" to see the correct answer on the reverse side of each card.
Examples of Managed Retreat in the U.S.
Examples of Managed Retreat in the U.S.California Coast
On this page, you will visit two locations on the California coast where the process of managed retreat has been used to address shoreline erosion problems. In the first example, at Ventura Beach near Santa Barbara in southern California, stakeholders worked together to find a solution to a chronic shoreline erosion problem. In the second example, at Pacifica Beach near San Francisco, wetland and riparian habitat were enhanced while at the same time moving structures out of the way of flooding and erosion. As you will see, both examples are in locations that have a medium level of human development, a motivated group of residents, and diverse stakeholders who collaborated to produce and execute a long-term plan. Both areas are in economically healthy areas, which makes raising funds more feasible. However, none of these things are easy to accomplish. These small-scale, less than ten-acre projects serve as valuable learning experiences, but larger-scale projects of similar kinds will likely need to be implemented in the near future, on the scale of, for example, Ocean Beach, which you studied in Module 8 Lab.
In the Ventura Beach example (Climate.gov - Restoring Surfer's Point), Surfers' Point Shoreline Managed Retreat Project is described and illustrated. The article outlines the challenges that had to be overcome to find consensus among the many stakeholders, with the project taking a decade to come to fruition. The stakeholders found that "Focusing on goals they had in common and identifying a bounded problem helped the groups converge on a single solution strategy. The decision to retreat from the ocean—pulling existing structures inland to make room for natural beach processes—allayed concerns that a hardened solution such as a seawall would degrade conditions for surfing, opened opportunities to rehabilitate the beach ecosystem, and enhanced the natural protection of assets on land." In this example, the road and parking areas are moved back and the beach and dunes widened. Volunteers planted native vegetation on the dunes, which serve as natural habitat and protection for the human structures behind the beach.
Restoration and Managed Retreat of Pacifica State Beach examines the Pacifica Beach effort to create climate change coastal community resilience. At Pacifica Beach, the managed realignment project is touted as a success.
Examples of Managed Retreat in the U.K.
Examples of Managed Retreat in the U.K.The U.K., being a relatively small island nation with a dense population, has a somewhat different approach to coastal management than the U.S. As a result, managed retreat, or managed realignment as it is called in the U.K., has been under serious consideration for a longer period of time than in the U.S. In the winter of 2013 -2014, tremendous storms caused extensive coastal flooding, bringing coastal management to the forefront.
Required Readings
- There are several examples of managed realignment in the U.K., Three are outlined in this article: Managed coastal realignment projects in the UK: ‘working with nature. Read the article, and begin a list of pros and cons of managed retreat vs. “hold the line” strategies involving hard structures such as higher sea walls and rock barriers.
Ecosystem Services of Coastal Marshes
Research shows that natural coastal marsh habitats provide many ecosystem services, including attenuation of storm surge. Attempts to quantify the amount of protection provided by coastal marsh has been elusive, but researchers conclude that “It is clear that coastal management decisions should consider the dynamics of natural coastal systems previous to human modification and be cautious about any actions that erode the natural benefits and ecosystem services provided by salt marshes.” (Shepard et al., 2011). This statement is based on the fact that research strongly indicates that coastal marshes play a very important role in protecting human infrastructure from coastal hazards, including sea level rise and storm surges. (Reference: Shepard CC, Crain CM, Beck MW (2011) The Protective Role of Coastal Marshes: A Systematic Review and Meta-analysis.)

Managed Retreat as a Response to Disaster
Managed Retreat as a Response to DisasterHurricane Sandy came ashore on the New York/ New Jersey shoreline on October 29, 2012. This late-season storm was dubbed “Superstorm Sandy” because of its massive size and because it coincided with a spring high tide (full moon), which exacerbated the height of the storm surge. The massive storm surge inundated a large swath of the coastline, which includes New York City. Parts of the New York Subway system were flooded, widespread power outages crippled the city, and low-lying neighborhoods were destroyed across the region. The statistics for New York alone sum up the storm’s magnitude:
- 43 deaths - 23 of whom perished on Staten Island.
- $19 billion in damages
- 90,000 buildings in the inundation zone
- Nearly 2 million people without power
The size of the area inundated is illustrated by the FEMA flood map image below.
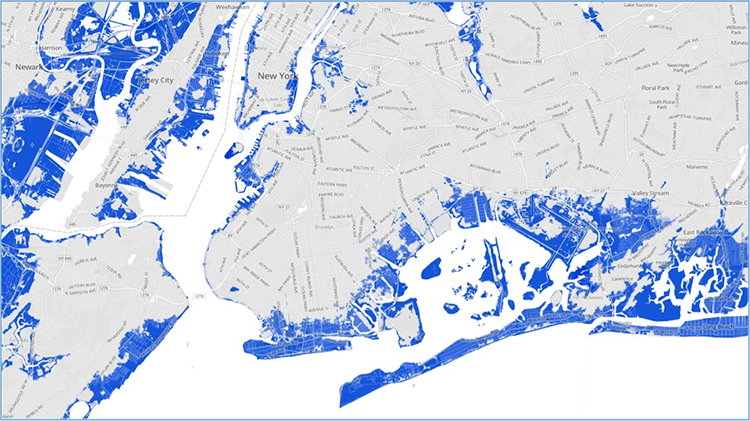
Sandy’s massive impact on such a densely populated and economically important region of the United States precipitated an unprecedented response by area leaders. Both New York Governor Cuomo and former New York City Mayor Bloomberg have taken strides to encourage residents to consider the future of New York’s coast in light of sea level rise predictions.
Former Mayor Bloomberg and the New York City Government were proactive in the development of the NYC: Special Initiative for Rebuilding and Resilience which produced a comprehensive report calling for a “stronger, more resilient New York”. Recommendations found in the report include a multi-faceted approach, including flood protection systems (levees, floodwalls, floodgates, etc.), as well as the designation of certain areas to be set aside as green space. It takes into account the fact that 25% of the city is flood-prone and that sea level rise will only make matters worse.
New York Governor Cuomo, meanwhile, initiated a buyout program for homeowners whose homes were in areas likely to experience repeated flooding. This buyout program has been successful, particularly in Staten Island and in other New York neighborhoods especially hard hit by Sandy. Areas are being returned to green space rather than being rebuilt. Case studies are featured in this module.
A slightly different approach to managed retreat is sometimes necessary in the face of a natural disaster. So, rather than using the types of managed retreat projects described in the previous section, that are carefully planned and take place in discrete locations, moving homes and businesses to safer locations urgently comes to the forefront as we saw in Unit 2. In these cases, decisions are often made quickly and are driven by economic necessity.
Retreat as a Response to Disaster: New York Example
Retreat as a Response to Disaster: New York ExampleHurricane Sandy Recovery: Staten Island’s Fox Beach Community.
Following a natural disaster caused by a storm such as Sandy, a different approach to retreat is often considered. In this case, rather than using the managed retreat projects described previously in this module, which are carefully planned and take place in discrete locations with a long-term vision, the action of moving homes and businesses to safer locations urgently comes to the forefront. In these cases, decisions are often made quickly and are driven by economic necessity and the availability of funds resulting from the disaster itself.
Required Reading
The following two articles from the Module 9 Roadmap look at the case of the New York Smart Home Buyout Program in the Fox Beach community of Staten Island, initiated by Governor Cuomo in 2013 (see press release excerpt further below). The program provided funds to purchase homes in particularly flood-prone areas severely impacted by Sandy’s storm surge. In addition, the program was designed to discourage rebuilding after Hurricane Sandy, by providing a monetary incentive to move to higher ground, and was met with a measure of success in certain areas.
Learning Check Point
Government Buy-Out of At-Risk Coastal Properties – New York Example following Sandy
Objective: Investigate alternative methods for non-structural shoreline hazard mitigation, including managed retreat and multi-layered defenses.
Although this Learning Check Point is not for credit, you will be expected to know the material in the Module 9 Quiz. Once you read and understand the articles referenced above as well as the excerpt below, take a few minutes to answer the questions about the New York Home Buyout Program in the space provided.
Government Buy-Out of At-Risk Coastal Properties – New York Example following Sandy
Excerpted from a March 2013 press release from New York Governor Andrew Cuomo’s Office:
Recreate NY Smart Home Buyout Program - $171 million: Certain areas are at high risk for repeated flooding, causing damage to homes and risking the lives of residents and emergency responders. To reduce those risks and provide residents with an opportunity to leave their properties, New York State will offer voluntary Buyouts for homes that were:
- substantially damaged inside the 500-year flood plain, or
- located within designated buyout areas where damage has occurred and where property may be susceptible to future damage due to sea level rise and other factors. These enhanced buyout areas will be selected in consultation with county and local government officials.
- In very high-risk areas, there will be a prohibition on rebuilding and these areas will be used as buffer zones. Under the state's proposal, and subject to approval by HUD, re-development of property outside of the 100-year floodplain that is acquired through a buyout would be permitted, so long as the new structure is built to mitigate future flood impact. Homeowners will be notified if they are eligible for a buyout after HUD has approved this plan.
Definition for "500-year flood plain" and "100-year flood plain"
A "100-year flood" is not a flood that will occur once every 100 years. Instead, it should be thought of as flood elevation that has a 1-percent chance of being equaled or exceeded each year. Therefore, a 100-year flood could occur more than once in a relatively short period of time. A 500-year flood elevation has a 0.2% chance of being equaled or exceeded in any given year.
If the trend of more frequent storms and increased sea level rise continues, these types of solutions will likely become more common. Who will foot the bill to move coastal communities? Will it happen only after disasters, or in a more planned way? In the case of Isle de Jean Charles, government funding was found in the form of a grant awarded to relocate the entire community. However, many challenges have plagued even this small-scale relocation project. We saw that long-term planning was lacking in Ocean Beach, CA. What will the approaches to these dilemmas be in 10 or 15 years from today? These are questions for us to ponder at this point. Policymakers, planners, community leaders, and politicians will have to quickly find solutions to these challenges for many communities soon.
Relocating Coastal Communities: Isle de Jean Charles
Relocating Coastal Communities: Isle de Jean CharlesCoastal Louisiana is home to hundreds of small communities, as well as several larger towns (such as Lafitte, Houma, and Thibodaux), that are not protected by the large federally subsidized hurricane protection levees such as those that surround New Orleans. The new hurricane protection system for the area, that is currently under construction, cannot incorporate all of these communities, although the Morganza to the Gulf levee* when it is completed, will include the larger towns listed here. One community that will not be included is the small town of Isle de Jean Charles in Terrebonne Parish. This small, mostly Native American community is grappling with relocating and creating a new community after receiving federal funds for resettlement.
Video: Isle de Jean Charles from the documentary LAST STAND ON THE ISLAND (11:23)
As the short film below will demonstrate, not all the residents agree with Chief Naquin’s decision.
Isle de Jean Charles from the documentary Last Stand on the Island
Visitor to island: You and I will enjoy this marsh. Our kids will enjoy some of it. Our grandkids don't stand a chance.
Island Resident's voice: The island was very big. We had a lot of trees on both sides of the island. But now, we ain't got no more trees, just a few. So, the saltwater messed up everything.
The oil company has digged some canals. The more canal you dig, the more water passes through. And then, after they dug the canals, saltwater start to come in. And then, that is when the erosion started. So, the saltwater messed up everything.
Visitor to island: And every time you're out there fishing, you see a nice clump of grass floating on down with the current. That's piece of marsh going.
Island Resident 1: I am what I am. Nobody gonna move me. And if you try enough to move me, you got a problem. First, that's my home, my land, and I like it down here. So, that's how we live and that's how we gonna stay.
Visitor: Don't stand a chance unless they get to know ya. It's almost like a gated community, but there's no gates.
Island Resident 2: Hurricanes start to come, left and right. Andrew in '92. We had a lot of water. For Andrew, we had about 3 foot of water in the house. My house was done. And then, the next one came in 2002: Lili. Then, we had some water. That's when we started raising up the house. Because they had five foot of water on the land, over here. And then, after that, every two years, two, three years, we had a hurricane.
Island Resident 1: We didn't really get that much water for them hurricanes, but there was hurricanes with plenty of water.
music
Island Resident 2: Like the people on the island, they can do. They do almost everything for themselves, ya know? We used to build our own house. With two, three men together. Build a house ya know?
Visitor: I got to admit I can understand why these Indians down here, they're so in love with this, with this little island. This is just like heaven down here. This beats any camp that I have ever been to. You try to just protect this little bitty piece of marsh, ya know? We don't really tell anybody about this down here. We try to keep it a secret.
music
Island Resident 2: We don't care about Albert. Albert don't run the island. He's the chief, but he don't run us you know? We do what we please.
music
Chief Albert Naquin: My deal is to get a big enough piece of land and not have to worry about oil spills or hurricanes. Let's say we'll take this reservation here, and we'll take it and we'll move it here. And this is the reservation.
Interviewer: So, you wouldn't want the reservation to be on the island?
Chief: Well, would you?
music
Chief: Consider the deal we got right now, with the Morganza-to-the- to the Gulf, and leaves us out in the open? We'll just wash away.
Resident 2: Maybe they want to take the island. Give that to the rich people, the millionaire.
Resident 1: We're not gonna sell the island. Ain't nobody can buy that island, partner. Before they buy that island, there gonna be a war. You see, when they was talking about moving the people off the island, I bought 200 dollars worth of ammunition - me. And I got four guns. Only thing I don't got is a machine gun. But I'm fixing to put my hands on one.
music
Resident 1: We know how to shoot guns. We got bows and arrows, we got hatchets. We can throw hatchets. I can throw a hatchet to that tree and stick it in that tree.
music
Resident 1: See, the people think we're stupid on the island. But we're not.
Isle de Jean Charles Resettlement Story
The Isle de Jean Charles residents have long been aware that the island's days are numbered as sea level rises and erosion of the marshes continues. Their houses are flooded and damaged regularly. Even so, many residents are resistant to the idea of leaving the island because of their strong attachment to the land and the way of life, including living off the water by fishing, shrimping, and crabbing. In 2016, the community of Isle de Jean Charles was the recipient of a $48 million grant from the Department of Urban Development - HUD to relocate the families of the "Island" to a safer location, 40 miles inland near the community of Schriever. This is the first time a community has received federal funding and support for a relocation of this kind. The resettlement plan, which is still in progress, has not progressed smoothly. The original intention of tribal Chief Albert Naquin was to keep the tribal community intact and create a new community that allowed displaced members who had previously left the island to rejoin the community. There are many details and concerns to be worked out between the tribe and the state. To date, 23 families have committed to relocating to the new community. Others are staying behind. The actual move is still several years ahead. The difficulties encountered highlight how challenging relocating a community can be, especially if the community wishes to stay intact. The dilemmas and challenges met by Isle de Jean Charles are likely to play out in many places as sea level rise claims other coastal communities.
Recommended Reading
- Read about the Morganza to the Gulf Levee in this U.S. Army Corps of Engineers: Morganza to the Gulf fact sheet.
For a more in-depth look at the story of the resettlement of IDJC residents, please read the following two articles:
Learning Check Point
The resettlement website has details of this plan and a video in which Chief Naquin and others outline the plan. Read the articles and watch the video on Isle de Jean Charles to help you understand the dilemma faced by such a small, tight-knit community. Consider how you would answer the questions on the cards below. Click "Turn" to see the correct answer on the reverse side of each card.
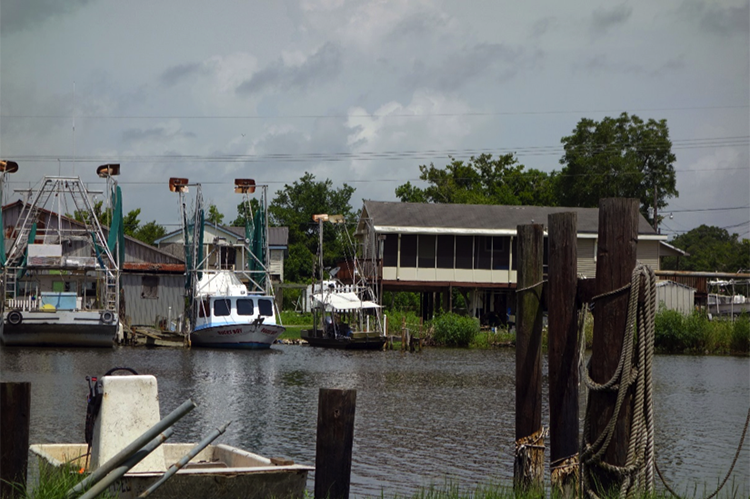
Multi-Layered Defenses
Multi-Layered DefensesLouisiana is an example of a very low-profile coastal area characterized by relatively newly deposited delta sediment (less than 10 thousand years) of the Mississippi River delta. Land loss has been ongoing at a rapid pace over the past century, peaking in the late 20th century, and is currently occurring at a rate of approximately 10 – 20 square miles per year. The communities in coastal Louisiana are all at risk of storm surge inundation, to varying degrees. We have already looked at New Orleans in detail and seen that it has a system of flood defenses recently upgraded after Hurricane Katrina. Many smaller communities that are located close to the Gulf of Mexico have no protection from federally funded flood protection. Many have levees built and maintained at a parish level. New federally-funded hurricane protection levees, such as the Morganza to the Gulf levee system are planned to protect towns such as Houma and Thibodaux. It is approximately 100-mile-long levee that averages 6 meters (20 ft) in height. But some small communities such as Cocodrie and Isle De Jean Charles will not be within the footprint of this levee. It is not feasible in terms of available funding and engineering options to protect some communities. This presents a dilemma for many communities.
Louisiana's Coastal Master Plan and Multi-layered Protection
Levees are not the only form of protection for coastal communities. Louisiana’s Coastal Master Plan incorporates the concept of a multi-layered defense system that includes maximizing the flood mitigation potential of barrier islands, marsh, and natural ridge restoration projects, (many of which involve pumping sediment from a designated location, often from the bottom of the Gulf of Mexico), as well as the use of fresh water and sediment diversions from the Mississippi River to build new land.
Recommended Reading
Learn more about this complex plan by visiting Louisiana’s 2023 Coastal Master Plan. At this site, you can read an overview of the plan, its objectives, its progress to date, and the principles upon which it is founded.
What is Multi-layered Protection?
A clear explanation of the concept of Multi-layered protection is presented by the Lake Pontchartrain Basin Foundation outlined at Multiple Lines of Defense Strategy. This conceptual approach identifies eleven “lines of defense”, which work in concert to ameliorate the effects of a storm surge by creating friction and reducing storm surge and wave height as it moves inland across the low-lying delta land. This plan was published and incorporated into Louisiana's Coastal Master Plan in the years after Hurricane Katrina. The eleven layers of protection are shown in the diagram below:
- Offshore shelf
- Barrier islands
- Sound
- Marsh land bridge
- Natural ridge
- Highway
- Flood gate
- Levee
- Pump station
- Elevated buildings
- Evacuation route

Video: FPA East Virtual Tour (16:06)
This is a virtual tour of the 17th St Canal Pump Station and the Surge Barrier in New Orleans. The first part focuses on Hurricane Katrina's destruction, while the second part showcases the flood protection system: Hurricane Storm Damage and Risk Reduction System (HSDRRS).
FPA East Virtual Tour
[DIAL TONE]
PRESENTER 1: Devastating damage expected. Hurricane Katrina, a most powerful hurricane with unprecedented strength rivaling the intensity of Hurricane Camille in 1969. Most of the area will be uninhabitable for weeks, perhaps longer. At least 1/2 of well-constructed homes will have roof and wall failure. All [INAUDIBLE] leaving those homes severely damaged or destroyed. The majority of industrial buildings will become nonfunctional.
Partial to complete wall and roof failure is expected. All wood-frame low-rising apartment buildings will be destroyed. Concrete block low-rise apartments will sustain major damage, including some wall and roof failure.
High-rise office and apartment buildings will sway dangerously, a few to the point of total collapse. All windows will blow out. Airborne debris will be widespread and may include items such as household appliances and even light vehicles.
Sport utility vehicles and light trucks will be moved. The blown debris will create additional destruction. Persons, pets, and livestock exposed to the winds will face certain death if struck. Power outages will last for weeks as most power down and transformers destroyed.
Water shortages will make human suffering incredible by modern standards. The vast majority of native trees will be snapped or uprooted. Only the heartiest will remain standing but be totally de-foliated.
Few crops will remain. Livestock left exposed to the winds will be carried. A [INAUDIBLE] hurricane wind warning is issued when sustained winds near hurricane force [INAUDIBLE] hurricane force are certain within the next 12 to 24 hours. Once tropical storm and hurricane-force [INAUDIBLE], do not venture outside.
[ALARM SOUNDING]
PRESENTER 2: On August 29, 2005, Hurricane Katrina made landfall in Louisiana, forever reshaping the landscape and the lives of those in its path. In addition to a path of destruction, the storm left people of New Orleans with uncertainty. Could New Orleans rebuild? And if so, how would the Crescent City survive if another storm similar to Katrina's strength was to strike?
With that question in mind, the federal government and the US Army Corps of Engineers went to work planning, designing and building one of the most ambitious flood protection systems in the world. The result is what you see today. The levees, barriers, and pumps that make up the Hurricane Storm Damage Risk Reduction System, known as HSDRRS.
Today, this system is operated and maintained by the team at the Southeast Louisiana Flood Protection Authority East.
[MUSIC PLAYING]
Welcome to the pump station at the 17th Street Canal. In the aftermath of Hurricane Katrina, the US Army Corps of Engineers constructed interim closures with temporary pumps at the mouths of the 17th Street, Orleans Avenue, and London Avenue outfall canals. The goal here was to prevent storm surge from Lake Pontchartrain from entering the canals during a tropical event, thereby reducing the risk of a failure along the canals.
The Corps' intent was to follow this temporary measure with the construction of a permanent, highly-automated, more sustainable solution. Soon we'll take an in-depth look at the more permanent solution. Let's begin our tour.
To your right, you will see the hydraulic gates that, when closed, cut off the lake from the canal. These gates are a critical part of the system. The brick building in front of you houses the pumps. We will head in there shortly. But first, let's head around to the back of the building.
You might be wondering what is significant about this side of the building. Well, for starters that is the 17th Street Canal in front of you. During a tropical event, any time the city pumps drainage water into the canal, we, in turn, pump the canal water into the lake. The goal is to prevent levee failure by reducing the stress on the canal walls.
The other thing you will notice is the metal structures coming up from the canal and towering over you. That is part of the mechanical screen and, when turned on, it will filter out debris from the water entering the pump station. Large screens catch the debris and then travel up the large metal tracks you see before you.
As they round the top, the debris falls onto the concrete pad that you're standing on. All right, it's hot out here. Let's head inside and get out of the sun. The building that we are now in houses the pumps at the end of the 17th Street Canal.
The giant machines that surround you are the pumps that help keep New Orleans safe, thus ensuring when the sewage and water board pumps are running the flow of water is one-directional, moving from the canal into the lake. Our two smallest pumps, which are all the way down on your left, can move 900 cubic feet of water a second, while our more numerous larger pumps can move double that-- 1,800 cubic feet of water in a single second.
To fully grasp how large these pumps are, notice how small Maintenance Mike looks when standing next to one. Let's move closer so you can take a look around some more. In order to protect New Orleans from flooding during a Hurricane, the pumps themselves need to be protected. This building has been designed to withstand sustained winds of 155 miles per hour and gusts up to 200 miles per hour.
From up here, you can get a better understanding of just how large these pumps truly are. Hang here for a bit and spend some time taking in the sights and sounds. It's OK to feel a little overwhelmed. It's quite impressive.
Now let's head down to the basement. Welcome to the basement of the pump station. Feel free to look around. And we'll start the tour back up in a moment.
Down here, we are standing 25 feet below the canalside water level. If you know anything about New Orleans, you know that basements are, well, rare. Each of these pipes is over 9 feet in diameter.
You'll notice Maintenance Mike taking his time inspecting the nuts and bolts holding these intake pipes in place. Each nut is striped with a yellow line so that we can easily tell over the course of time if they have come loose. When the yellow stripe on the nut lines up with the stripe on the bolt, we know they are tight and safe.
Interestingly enough, the water is not just pumped through the facility. But it is actually pumped from the bottom of the canal, up these pipes, and out through the lake side of the building. While the water is discharged below the surface, it has enough force to create a noticeably large wave.
So what does it take to move this much water? A whole lot of power. Welcome to the generator bay. Here you will find 15 2.6 megawatt generators. Take a look around for a bit.
When it comes to protecting the city of New Orleans from flooding, redundancy is everything. Each pump has two of these generators dedicated to it. In addition to that, this facility has generators and an on-site fuel storage facility allowing for full operation and off-grid protection.
The first thing many people think of when it comes to flood protection are the giant pumps that we just saw. However, those pumps only remove water from the city. What prevents water from entering New Orleans? Hold on tight.
Welcome to the IHNC Lake Borgne Surge Barrier. Consisting of over 3,000 piles, including 1,271 concrete cylinder piles that measure 66 inches in diameter and are driven to a depth of 130 feet into the ground, this is one serious barrier. So how does this all work?
Woo, back on solid ground. Directly in front of you is the main sector gate. When closed, you can walk across the Gulf Intracoastal Waterway, which is a major artery of marine commerce from Florida to Texas. Millions of dollars of shipments travel through this waterway on a daily basis.
Later on, we will take a look at the gate closing process. But for now, let's continue our tour. Further along is the Bayou Bienvenu Vertical Lift Gate and Bridge that help connect this nearly two-mile-long structure.
In fact, authorized vehicles are able to drive across for inspection and maintenance. Although it can be hard to see from here, the barge gate is exactly what it sounds like. It's a large barge that can be swung on in front of the barrier opening and then sunk to seal the opening off.
To your right and somewhat behind you is the primary control room. This is where the gate can be monitored and where the controls to open and close the gate are located. Take a minute to look around.
All right, ready to move on? Let's explore. Out here you can get a better view of the gate as well as see beyond the gate. Additionally, you will notice the building across the way. If you think this looks similar to the control room you saw earlier, you'd be right. That building is actually a secondary control room, allowing for the gate to be managed from both sides of the waterway.
Before we dive deeper into the gates, let's take a look at the surge barrier itself. As you look around, you'll notice on your right the levee portion of the flood protection system. While the pumps remove water from the city and the barrier closes off the flow of water, the levee helps protect against the storm surge typically associated with a major weather event. Let's move in a little closer to the levee.
Maintenance Mike is going to help us out now with a little demonstration. If you look slightly to your left, you'll see Mike standing next to the old levees which were part of the original flood protection system. These levees originally protected New Orleans against storm surges measuring up to 16 feet in elevation.
When standing next to the top of one, Mike is able to clearly see over it. These levees did the best they could. But to give you an idea of how challenging it was to prevent, the storm surge created by Hurricane Katrina was over 9 feet higher than these levees, topping out around an unprecedented 25 feet high. Now, Mike has moved across to the levees that are part of the new flood protection system.
As you can see, these are significantly higher than the old ones. In fact, at the highest point, the new levees are double the height of the old ones, topping out at 32 feet tall. Ready to move on?
Let's head back up to the gate and see if they are ready to start the closing process. Here we are in the control room, where our crew is about to get things started. Let's say a quick thanks to Patrick Brown for operating the gate for us today.
Now, let's head back outside to check out the action. Wow. Look at those gates close.
If you think they aren't moving, that's certainly understandable, as they do take over 15 minutes to move into place. But don't worry. You won't have to stand here in the heat for 15 minutes. Let's speed things up a bit.
Much better. All right, we're coming to the end of our tour. Before we leave, take a moment or two and look around some more.
We're back at the pump station and out of the sun. Thank you for joining us on the tour today. If you have any questions about something you saw, please do not hesitate to reach out to the New Orleans Flood Protection Authority East. Have a good one.
[MUSIC PLAYING]
Learning Check Point
Please take a few moments to think about what you just learned then answer the following questions to test your knowledge.
Module 9 Lab
Module 9 LabIntroduction
The objective of this Lab is to explore a low profile coastal area in Louisiana and use tools in Google Earth to measure the slope and evaluate the protective potential of the coastal wetlands and man-made levees separating the coastal communities from the Gulf of Mexico
For this Lab, you will be using Google Earth to explore the coastal area of Isle de Jean Charles and use data from a storm surge model to analyze the potential impacts of storm surges on this and nearby communities. You will consider the protective functions of the coastal marshes as well as the new hurricane levee that is designed to protect some communities but not Isle de Jean Charles.
Required Reading
Be sure you have read the U.S. Army Corps of Engineers: Morganza to the Gulf - Fact Sheet located on the Module 9 Roadmap.
Lab Overview
After you thoroughly read the U.S. Army Corps of Engineers fact sheet about the Morganza to the Gulf levee project (mentioned above), follow the steps in the Module 9 Lab Worksheet below.
Downloads/Resources
Statement of Use of AI on Exams, Quizzes, and Labs
Instructions
Before you begin the Lab, you will need to download the Lab worksheet. We advise you to either print or download/save the Lab worksheet, as it contains the steps you need to take to complete the Lab in Google Earth. In addition, it contains prompts for questions that you should take note of (by writing down or typing in) as you work through the Lab.
Once you have worked through all of the steps, you will go to the Module 9 Lab. to complete the Lab by answering multiple-choice questions. The answers to questions on this Lab worksheet will match choices in the multiple-choice questions. Submit the quiz for credit.
Summary and Final Tasks
Summary and Final TasksIn Module 9, you investigated alternatives for coastal hazard mitigation, including managed retreat and multi-layered protection. You considered the pros and cons of managed retreat versus traditional solutions such as structural protection. You used online tools to make measurements of bed slope on the Louisiana coast in order to estimate storm surge impacts on a real community. You took into consideration the physical, social, and economic challenges that face coastal managers today to make recommendations for the future for a coastal community in Louisiana.
Reminder - Complete all of the Module 9 tasks!
You have reached the end of Module 9! Double-check the Module 9 Roadmap to make sure you have completed all of the activities listed there before you begin Module 10.
References and Recommended Reading
- Barbier, EB. Georgiou, IY, Enchelmeyer, B., Reed, DJ, (2013). The Value of Wetlands in Protecting Southeast Louisiana from Hurricane Storm Surges.
- Coastal Planning and Restoration Authority of Louisiana (CPRA) Louisiana’s 2012 Coastal Master Plan
- Deltares
- Shepard CC, Crain CM, Beck MW (2011) The Protective Role of Coastal Marshes: A Systematic Review and Meta-analysis.
- University of Minnesota Institute on the Environment (Ensia)
Module 10: Smart Building
Module 10: Smart BuildingIntroduction
Most deltas around the world are in a declining state, as we learned in Module 2. Human population has been increasing on deltas and coastal zones generally around the world, making them the focus of urbanization and economic development. It is estimated that within the next few decades, roughly half the world’s population will be living in within the coastal zone. With increasing populations come big challenges to maintain ecosystem services and functions that are essential for food supply, critical management of key resources, and maintenance of socio-economic development. This, however, is only the beginning. As we learned in previous modules, coastlines and modern society are further challenged by a changing global climate, placing additional pressure on the need to address changing coastlines in response to a variety of uncertainties. How will we adapt to increased flood risks from sea level rise and more intense storm events; water scarcity from droughts; watershed degradation; possible shifts in river discharge; subsidence; and many other dilemmas related to the dynamic nature of coastal zones and a changing planet?


Goals and Objectives
Goals and ObjectivesStudents will develop an understanding of concepts of building with nature, and old and new smart building practices used for flood control, hazard mitigation, and risk reduction.
Learning Objectives
By the end of this module, students should be able to:
- distinguish and evaluate various smart building and building with natural approaches;
- evaluate and recommend smart building approaches for the expansion of a case study city that is threatened by sea level rise and storms;
- employ building with nature and layered defense approaches in consideration of the smart building design in the case study;
- examine recent trends in smart building along coastlines and integrate concepts of resiliency and coastal flood protection through methods such as massive nourishments.
Module 10 Roadmap
| Activity Type | Assignment |
|---|---|
| To Read/Watch | In addition to reading all of the required materials here on the course website, before you begin working through this module, please read the following required readings to make sure you are familiar with the content, so you can complete the assignments.
Extra readings are clearly noted throughout the module and can be pursued as your time and interest allow. |
| To Do |
|
Questions?
If you have any questions, please use the Canvas email tool to contact the instructor.
Early Smart Building
Early Smart BuildingThe concept of smart building or building with nature is not new. Early settlers, cities, and communities living along river banks, deltas, and along coastlines have adapted their lifestyle to the pulsing and cyclic forces of nature. From fluctuating sea levels to seasonal flooding, to storm flows, these communities slowly built resilience and developed methods to help them withstand the elements to maintain a way of life. Communities were founded or expanded along high ground; evacuated low-lying areas in river valleys during floods; fled during storms, or learned to live with water, often creating floating infrastructures. We will now explore some basic early smart building approaches by visiting low-lying and delta communities in the United States, the Netherlands, and the Mekong Delta in southwestern Vietnam.
The Netherlands - Terp Mounds
The Netherlands - Terp MoundsEarly Dutch Flood Protection
Flood protection in the Netherlands did not begin with dikes, land reclamation, and monumental surge gates. When the ‘low countries’ were first settled in prehistoric times, temporary communities were established on natural beach ridges and dunes, the highest topographic features in the area. The settlements were still at the mercy of nature, and communities retreated or perished when exposed to high storm surges. From around 500 B.C. onward, settlements along the Dutch coast were constructed on terps, or artificial mounds built to above typical high tide and surge levels so that communities would no longer be destroyed by floods. In the Middle Ages, large constructed mounds enabled permanent settlement in the fertile areas near the coast and rivers. During flood periods, villagers along with their livestock would retreat to the central mound with little risk of loss of life or property. Indeed, the floods were beneficial, depositing fine sediment in floodplains that helped improve agriculture. The figures below show two persevered terps in the Friesland province of the Netherlands. The terp mounds were a very resilient system against flood protection. For small village populations, terp-building was a great example of smart building. Important structures, such as dwellings and churches, were sited so that vulnerability to flood hazards was greatly reduced, while agricultural fields that could be flooded without significant damage were allowed to be inundated. With sufficient warning, loss of life and property (including valuable livestock) could be virtually eliminated by taking refuge on the terp, while natural processes that encouraged siltation to counter subsidence were not interrupted.


Mekong Delta - Floating Communities
Mekong Delta - Floating CommunitiesThe Mekong Delta in Southern Vietnam is characterized by a vast and fertile flood plain, made possible by the presence of delta distributaries, canal networks, and small villages and houses, an important corridor for biodiversity. The region's tropical climate, with a wet season lasting most of the year, calls for adaptation to the ever-flowing waters of the region. The fertile soils and lack of topographic relief in the lower delta and coastal zone compared to the proximal areas with more relief, produced two distinct types of communities. In the upstream delta regions with more topographic relief, communities are organized into villages with a typical cluster of housing or buildings, while, in the lower delta, communities are not organized into villages. Instead, they are spread throughout the delta, lining the channel banks and waterways that run through the district. This primitive smart building suggests that perhaps the floating or elevated houses are near canals to make more space available for agriculture, but also to provide access to transportation. The canals are the main routes for transport in and out of the district, with boats being the main form of transportation for both people and goods. Secondary transportation routes include elevated narrow roadways that run between rice fields, connected through centralized hubs where pedestrians and bikes can be transported across canals by ferries.


Despite the adaptation of communities to living with water in the Mekong delta, climate change-driven sea level rise, drought, and river floods remain a threat. The Vietnam Ministry of Natural Resources and Environment predicted in 2012 that a 1 m increase in sea level would inundate approximately 39% of the lower Mekong delta basin. The risk to these communities might be even higher if one considers droughts and floods inundating agricultural land, damaging crops, and potentially disrupting the food supply. As a result, the Asian Management and Development Institute is working with coastal provinces of the Mekong on community adaptation programs to better understand and prioritize climate risks and take actions to strengthen their resilience to food and livelihood insecurity resulting from climate change. The adaptation is needed to ensure key income continuity, sustenance food sources generated through rice production, aquaculture (shrimp and clam), livestock rearing (ducks and pigs), and coastal shellfish farming.
New Orleans
New OrleansEarly Smart Building along the banks of the Mississippi River
It is a common misconception, widely promulgated during the media’s coverage of Hurricane Katrina, that the city of New Orleans is below sea level. In fact, almost 53% of the city is at or above sea level (Campanella, 2007). Before the construction of flood protection levees along the Mississippi River, seasonal spring floods caused the river to overflow its banks, depositing sediment in the floodplain along both sides of the river. Sediment deposition was most intense directly at the bank and decreased with distance from the river, gradually building up a natural levee elevated above the surrounding land and typical river stages. From the topographic high of the natural levee, the land surface slopes downward to the below sea level backswamp. The natural levee of the Mississippi is visible in the map of above sea level elevations in New Orleans below, following the crescent shape of the river.
Another major above sea level topographic feature in New Orleans is the Metairie/Gentilly Ridge, a single feature that is known by either name depending on which part of the city it traverses. Formed by the natural levees of a relic distributary of the Mississippi River when its mouth was to the east of New Orleans, the ridge sits several feet above sea level and the surrounding lowlands. The Esplanade Ridge, also formed by a small Mississippi River distributary channel, connects the Metairie/Gentilly Ridge to the river’s natural levee. Most other areas in the city above sea level are artificial, the result of land reclamation along the lakefront, dredged material disposal along navigation canals, and construction of flood protection levees.

New Orleans was established as a French colony on a crescent-shaped piece of land between the Mississippi River and Lake Pontchartrain, about 80 km from the river’s mouth. The original settlement was built on high ground adjacent to the river and was bordered by low-lying cypress swamps to the North. A map of the further-developed city in 1829 is given below, with some constructed drainage canals already visible. Note that the city is confined to areas above sea level, the river’s natural levee and a small settlement on the Gentilly Ridge connected to the French Quarter by the Esplanade Ridge.

During the city’s early development, historic homes in the area employed a smart building approach despite being built above sea level. Realizing the threats of flooding from both the river and the sea, early New Orleans residents showcase houses that are elevated with elaborate architecture or houses that employ basements that are actually on the first floor. Some examples of these houses are shown below and show how well-prepared the communities were as a result of living with and being surrounded by water.


Due to its unique geography, New Orleans is subject to three types of flood risk: river floods from the Mississippi River, storm surge-induced floods from Lake Pontchartrain and Lake Borgne to the East of the city, and heavy rain-induced flooding due to the low-lying city’s poor drainage. The realization of these threats throughout the city’s history has influenced the development of its flood protection system. From its inception, New Orleans was routinely flooded by the high spring runoff floods of the river. To prevent these floods, the same strategy of heightening the natural overflow banks has been implemented at various scales. Though it did not directly inundate New Orleans, the great Mississippi flood of 1927 resulted in the authorization of the Mississippi Rivers and Tributaries Project, whose construction ensured protection from further river floods. Levees were constructed along most of the lower Mississippi River with 7.5 m above sea level levees fronting the city of New Orleans.
The Need for Growth
The Need for GrowthCity Expansion and Smart Considerations
Despite the high risk of exposure to coastal hazards of increasing intensity and frequency, most of the world's populations, economic activities, and infrastructure continue to be located along the coast. In many cases (see Module 9), retreat and abandonment of high-risk areas is simply not an option. Already growing populations, augmented by immigration, in major coastal cities requires thoughtful planning to protect against flooding without hindering the many valuable ecological functions within the coastal zone. The following sections detail several smart building measures that have satisfied the need for growth in coastal zones.
The Netherlands
The NetherlandsThe terp mounds were a very resilient system against flood protection. However, the size of the constructed mounds was limited and they could only support small villages. With continued population growth and the need for more protected space in villages, the Dutch began building ring dikes around towns. As settlements continued to expand into the low, coastal areas, the land was drained using increasingly elaborate means (ditches, windmills, steam pumps). This drainage, coupled with peat harvesting and poldering (a method used to reclaim land from the sea), caused extensive subsidence, which increased flooding vulnerability. The increasing populations and value of property inhabiting lowlands required higher and stronger dikes, so much so that now most of the Dutch population and economic activity is supported by areas below sea level that are protected from floods by massive, nearly indestructible dikes and surge barriers. With such high consequences of flooding, dikes, and barrier structures for much of the country are designed to protect against a flood with a 1 in 10,000-year recurrence interval.
Learning Check Point
Objective: Understand the benefits of building with nature, and distinguish smart building approaches.
Although this Learning Check Point is not for credit, you will be expected to understand this material for the Module 10 Quiz.
Watch the required video Protecting Against Flooding: Holland's storm-surge barrier (9:43) about the “Deltaworks” flood protection system in the Netherlands. Answer the questions below.
Amsterdam
AmsterdamModern Floating Houses
Driven by a lack of space on land to expand, the proximity of water has driven the concept of a houseboat to extremes in Amsterdam and around the world. Originally docked in canals, houseboats are now taking a new shape. They are redesigned to be just as good, if not better, than their land counterparts, and are taking shape over water. Small communities of floating houses are rapidly evolving, to fill the growing need. Watch the following video to learn more about the new construction of floating houses.
Video: Living on Water: Sustainable Housing in Amsterdam (5:40)
Living on Water: Sustainable Housing in Amsterdam
With more than 500 inhabitants per square kilometer, the Netherlands are in the top 5 most densely populated countries in the world. So if we need to allocate more space for service water, why not live on it? This is in line with a dutch planning strategy known as meervoudig ruimtegebruik, multiple use of space. Houseboats became popular in the 1960s and 70s when students could not find affordable housing and squatted on barges instead. Today, there are about 2,500 houseboats moored in Amerstdam waters. Usually, each house is a separate entity, moored to the quay and equipped with its own connections to electricity, water, and sewage.
More recently, though, there are experiments with larger floating settlements. At Haveneiland - West, which belongs to the new IJburg archipelago in the east of Amsterdam, there's a new neighborhood of 34 converted barges. The old ships are up to 42 meters long and are moored at a communal jetty running along the quay. They can be reached via two entrance pavilions above the water, which also house bike garages and letterboxes. It might not look like it from the outside, but each houseboat offers around 200 square meters of living space. Inside, they are unexpectedly bright and spacious. Some interiors have been designed by architects, such as this one by Ana Architecten. It hardly gives away that you're inside the belly of a ship built in 1957.
While the barges still convey the feeling of living on a ship, there's another development just next door at Steigereiland, which strikes a new path. In a locked-off part of the lake, two neighborhoods with floating houses have been realized. The master plan for both was made by architect Marlies Rohmer. The northern part consists of 40 individual floating houses designed by various architects and was realized around 2012. In between the houses, there's not a lot of space, but it's enough to park your boats or even create a little terrace. Some inhabitants have made tiny floating gardens to accompany their floating home. The floating houses have a concrete base that contains a semi-underwater story. The air contained in this tub, lets them float. The lightweight construction on top is made of wood. In total, they offer around 150 square meters of living space.
The other side of the area, Steigereiland - Zuid, was designed as a floating community by architect Marlies Rohmer. The design of the floating houses is based on a modular system with detached houses, duplex houses, and triple houses. In total, there are 55 floating homes, but also three stilted houses, and seventeen dike houses. In social terms, it is a mixed water community with owner-occupied as well as rental houses. Inhabitants can choose from a range of pontoons and terraces as extensions of their homes. Like on the other side of the lake, each house has its own connections to electricity, water, and sewage, hanging in tunnels under the jetties and in plastic tubes under their buildings.
And here is the reason why the envelope of the house is the same on both sides area. They all have to fit through this little lock. The wharf where they were produced lies in a village in the north of Lake Isomer. After construction, the houses were dragged across the lake, maneuvered through the lock, and then moored in their final location.
The latest floating development in Amsterdam takes the story one step further. Schoonschip is a community with 30 water plots in a canal. The urban plan was developed by the architecture firm Space & Matter but within the plan, each house was designed individually. Schoonschip has the aim to be a resilient and entirely circular development. That's why all the floating homes have solar panels on the roof, generate energy with heat pumps, and store it in in-house batteries. There's only one connection to the national energy grid. Thanks to a smart grid, inhabitants can trade energy that they generate amongst each other. Wastewater from toilets and showers is treated and also converted into energy. Inhabitants don't own cars, but share a pool of electric cars and cargo bikes. These floating houses work exactly like the ones on Steigereiland, and they are also moored at jetties. But you can see there is a lot more wood used here. For the jetties, as well as for the facades. And there is another important difference to earlier projects. This neighborhood, home to 48 families, was a result of a bottom-up initiative and participation process. That's why there's a strong community feel, also expressed in the wide jetties, which serve as communal exterior space. Schoonschip is the most recent and most sustainable floating development in the Netherlands. It probably won't be the last, considering the challenges of climate change in a country that lies largely below sea level, and suffers from increasing rainfall. It is also another manifestation of the paradigm shift from fighting against water to living with water and enjoying it.
Greater New Orleans
Greater New OrleansThe city of New Orleans' expansion was partially driven by the need for space (to expand) and the unavailability of sufficient space above sea level. Driven partially by flood protection measures due to the Mississippi River and Tributaries Project, the city expanded into the former back-swamp north of its original footprint. Small-scale levees, termed drainage levees, were constructed on the South shore of Lake Pontchartrain and drainage canals were dredged so that floodwaters could be conveyed out to the lake. To facilitate drainage from an area that is shaped like a bowl (recall Digital Elevation map earlier), an elaborate system of pumping stations, in conjunction with the levees, had to be built. Despite these improvements, the city was still frequently flooded by hurricane-induced storm surge, including major floods in 1947 and 1965. These events, and particularly Hurricane Betsy in 1965, resulted in the inception of another federal project, where the Lake Pontchartrain levees were raised to the current elevation. But the lack of space to construct strong earthen levees, such as those that line up the Mississippi River banks, called for a hybrid construction method. This included the addition of sheet pile walls added atop the existing drainage canal levees, forming the foundation for the concrete floodwalls. These structures failed catastrophically during Hurricane Katrina. The figure below gives a typical cross-section of the city, stretching from the river on the left to the lake on the right.

Was the catastrophic flooding from Hurricane Katrina due to false protection and unknown risk? To partially answer the above question, we examine city urbanization patterns with the city topography and flood depths from the widespread event that provided the only data point for flooding post-1965. Historically, and to accommodate the growing population of the city, settlement expanded from the crescent-shaped high ground that was organized along the natural levees of the Mississippi River into the former backswamp areas. This expansion would not have been possible without the development of cutting-edge pumping technologies coupled with an elaborate and challenging levee building construction. These technologies first enabled the swamps to be drained, promoted development to extend into these low areas, and helped keep the city drained during heavy rainfall. But, the modifications that took place post-1965 were proven to be the most vulnerable and were not really tested until decades later. While still not immune to flooding risks, areas above sea level in the original city plan were significantly less vulnerable and fared relatively well during Katrina. Recall the DEM at the beginning of the module, and now examine the figure below. From the figure to the left, it can be seen that New Orleans did not expand significantly into low-elevation areas until the late 19th century, exposing the population in the newly-settled areas to elevated flood risks. Up until this point, the settlement patterns of the city clearly followed smart building principles, where development was generally limited to the higher elevations of the natural levees and relic distributary ridges. False protection, afforded by the levees and an elaborate pumping system, produced peace of mind but without contingency or layered defense concept/approach, and resulted in catastrophic flooding when the levees failed.

Building with Nature
Building with NatureMitigating Risks While Preserving Natural Processes
The simple concept of sediment supply along the coast and the unified concept of the coastal cell can be applied to other systems. For example, similar to the way a groin disrupts sediment transport downdrift of the structure, resulting in downdrift erosion until sufficient bypassing takes place, land reclamation practices, and the construction of levees, seawalls, and other storm protection structures including gates have their effects. On the one hand, land reclamation in tidal systems can alter the tidal exchange of water between the interior basin and the coastal ocean, and may yield sedimentation issues within the basin and near the tidal inlets. On the other hand, erosion within the basin, such as wetland loss, may have the opposite effect, resulting in widespread erosion at the inlets and sediment export due to the increase in tidal exchange. Levees that enclose open or semi-enclosed basins disrupt water, sediment, and nutrient exchange and may adversely affect submerged and intertidal habitat, including fish and other aquatic organisms.
Climate change sea level rise will continue to erode coastlines throughout the world for decades to come, and during these transgressive times, we cannot afford to be working against nature. This means that we must first understand the underlying processes governing the transport in the system experiencing these erosional cycles, determine accretion cycles, if any, and establish the best approach. Hardening the shorelines by seawalls and levees often implies a permanent boundary. Recall that sea levels rise and fall over geologic time with coastal imprints that span over generations; therefore, if we do not deal with issues now, the next generation will have to. Best approaches, for the most part, imply that we turn to soft, process-driven nourishment of eroding coasts that utilize natural processes – as opposed to mechanical placement – for the distribution of materials. Often these soft methods are the least disruptive to nature, including local and proximal ecosystems.
But we cannot protect cities by nourishment methods alone. In many cases, the installation of levees and other flood control structures will be necessary, especially if cities are already established. The relocation of cities or portions of cities will have catastrophic economic influence. When floodgates are needed, modern designs that utilize natural processes will be favored. An example we saw in the video from the Netherlands is the installation of gates that remain open most times to allow for tidal exchange and facilitate small changes in tidal range to maintain ecosystem function, closing only when cities are threatened by storms. Coupled with layered defenses, a concept introduced in Module 9, smart building in many cases can afford the needed protection while helping to lower future energy demands and maintenance costs and achieving overall higher ecosystem services and functions.
The following five case studies will help you learn about how some communities have built with nature to mitigate risks while preserving their natural resources.
Case Study 1: The Thames Barrier
Case Study 1: The Thames BarrierThe Thames Barrier spans 520 meters across the River Thames near Woolwich, protecting 125 square kilometers of central London from flooding caused by tidal surges and storms from the North Sea. The barrier became operational in 1982 with 10 steel gates that can be raised into position across the River Thames. When raised, the main gates stand as high as a 5-story building, are as wide as the opening of Tower Bridge, and weigh about 3,300 tons. The barrier is closed under storm surge conditions to protect London from flooding from the sea, but may also be closed during periods of high flow, to reduce the risk of fluvial (river) flooding in some areas of west London including Richmond and Twickenham. The Environment Agency (the agency responsible for the barrier operation) receives information on a potential surge from a variety of sources including weather satellites, oil rigs, weather ships, and coastal stations. At the onset of a predicted surge, the Thames Barrier will close just after low tide, or about 4 hours before the peak of the incoming surge tide reaches the barrier, a process that takes about 1.5 hours for all 10 gates. The Barrier will remain closed until the water level downstream of the Thames Barrier has reduced to the same level as upstream. As of March 2014, the Environment Agency has closed the Thames Barrier 174 times since it became operational in 1982. Of these closures, 87 were to protect against tidal flooding, and 87 were to alleviate river flooding.
Video: How does the Thames barrier protect London from floodings (00:43)
How does the Thames barrier protect London from floodings
The Thames barrier was built in 1982 on the River Thames on the eastern side of the capital at Woollett. The barrier made up of ten steel gates has a span of 520 meters across the river. Each gate is 15 meters tall. In an open position, the gates lie flat, allowing the Thames to flow freely and ships to pass through the gates. When the closed position is activated, it takes 75 to 90 minutes for the gates to rotate upwards and create a steel wall that blocks the river in an under-spill position. It allows a controlled amount of water to pass under the gate and up the Thames.

Case Study 2: The New Hondsbossche Dunes – Netherlands
Case Study 2: The New Hondsbossche Dunes – NetherlandsThe New Hondsbossche Dunes project – one of many examples of the Dutch government’s approach to smart building that utilizes natural processes – initiates and sustains continued dune nourishment. The principle of 'building with nature' is fully exploited to strengthen the Dutch coastline using a plan that couples smart building with layered protection. Superior to fixed solutions or hardscape approaches, the project employs nature to create a place with varied topography, complete with existing dunes overgrown with native vegetation, young drifting dunes and dune valleys, and a beach of varying width, all designed to be consistent with the existing dunes and to minimize dune erosion. The dunes offer natural mitigation from storm surges, with the added benefit of supporting a diverse population of plant and animal species. The plan is considered to be a dynamic solution because shifting sands and vegetation interact with the beach environment and continue to evolve organically and further bolster recreational activities.

Recommended Reading
For more information and project details visit: The New Hondsbossche Dunes
Case Study 3: The Sand Engine – Netherlands
Case Study 3: The Sand Engine – NetherlandsSimilar to dune restoration or creation, beach nourishment is a common soft approach to offset erosion. Sand can be mechanically pumped to replenish a beach following a storm or as part of a beach or barrier island restoration project. Alternatively, the natural process of longshore drift transports sand along the coast, not only eroding beaches but also accreting sand and building beaches. In either the mechanical or natural case, the addition of sand to the nearshore zone or beach increases local sediment supply. Mechanical spreading of pumped sand along the coast is common but can have a large ecological footprint and can be very expensive because the sand must be dredged, then transported, and finally distributed along the shoreline – sometimes over considerable distances. To minimize ecological damage and reduce cost, the Dutch developed an innovative way to let nature distribute the sediment instead, making the processes originally responsible for erosion now work on helping to accrete the beaches, at least locally. The concept is not new, but this was the first time that a natural nourishment project of this magnitude was carried out.
Recommended Reading and Viewing
- Please read the following article: How The Netherlands Became The Biggest Exporter Of Resilience.
- Please watch The Sand Engine Churns to Bring Sand to the Beach (3:08)

Case Study 4: MOSE flood barrier in Venice, Italy
Case Study 4: MOSE flood barrier in Venice, ItalyAlthough the threat is different from that in the case of the Thames Barrier, like London, the gated flood defenses of the MOSE project in Italy are designed to protect Venice from high tides and surges from the Adriatic Sea, thereby reducing flood frequency. The project takes advantage of the three main tidal inlets connecting the Venice lagoon to the sea, where a series of hollow gates on hinges initially resting on the bed will rise and close the inlets during periods of high tides. The MOSE barrier uses a completely different method than the approach used in the Thames Barrier. The idea, however, is similar in that for much of the time, when there is no imminent threat of flooding, the gates are filled with water and resting on the seabed; when floodwaters threaten Venice, the gates are closed in response to incoming high water. The smart building elements in this approach are in the design, the operation, and the utilization of processes and water properties to minimize operating costs, energy, and maintenance. The gates simply close under the influence of gravity by slowly filling up with seawater, and once fully open, the added weight of the steel when added to the weight of water keeps them submerged. To close the gates, the opposite of gravity, buoyancy, is used. Pumped air forces water out of the gates, and since the air density is more than a thousand times less than seawater, the gates are lifted into the closed position, rising above the water surface. The lack of mechanical infrastructure and arms to perform these steps keeps operating cost low, although, as we learned in earlier modules, the upfront capital costs for such projects can be in the billions of dollars.
Recommended Video: Venice - Lagoon: The MOSE System for the Defence Against High Waters (6:28)
Venice - Lagoon: The MOSE System for the Defence Against High Waters
Case Study 5: Protecting Tidal Flats and Marsh Edges with Artificial Oyster Reefs
Case Study 5: Protecting Tidal Flats and Marsh Edges with Artificial Oyster Reefs“Ecosystem engineers” use ecosystems whose species’ activities are able to modify the local physical environment, for instance promoting sedimentation or assisting in the self-organization of landscapes. Ecosystem engineers have found that salt marshes, mangroves, and other habitats that can be effective agents for enhancing coastal protection.
In one of the most versatile ecosystems used by ecosystem engineers, oysters transform soft sediments into hard to form complex 3D structures (i.e., reefs) that modify the near-bed water flow and dissipate wave energy, thus influencing sediment transport dynamics and promoting sedimentation in nearby environments. Oyster reefs offer additional ecosystem services, such as water filtration, and their aggregations and biogenic structures facilitate dense assemblages of invertebrate species, as well as provide shelter and foraging grounds for juvenile fish and crustaceans. Oyster reefs are among the most diverse marine habitats.
In one instance of ecosystem engineering, oysters are used in clusters within arrangements of rebar to provide the basis of what will eventually become a reef and help reduce wave energy transmission onto the marsh edge and platform. This approach helps reduce the direct breaking wave energy arriving at the marsh edge and ultimately reduces shoreline erosion. Applications using such solutions include navigation channels and natural waterways where commercial and/or recreational traffic produces above-normal wave energy. The area between the reef and the marsh experiences increased sedimentation, which helps deliver more sediment onto the marsh platform; over time, this sediment accretes to a shallow slope that helps dissipate energy further, and potentially offsets erosion.
Another application uses gabions filled with oysters and oyster substrate to protect tidal flats. Tidal flats provide a variety of ecosystem services, but sea level rise and human-induced stresses are causing widespread erosion. To combat this erosion, experiments in the Eastern Scheldt estuary in the Netherlands (which you saw earlier in this module) use oysters to help reduce wave energy during sub-tidal conditions, trap sediment, and reduce erosion of the tidal flats. Reducing erosion sustains the landform, thereby extending the longevity of the flats and their habitat.
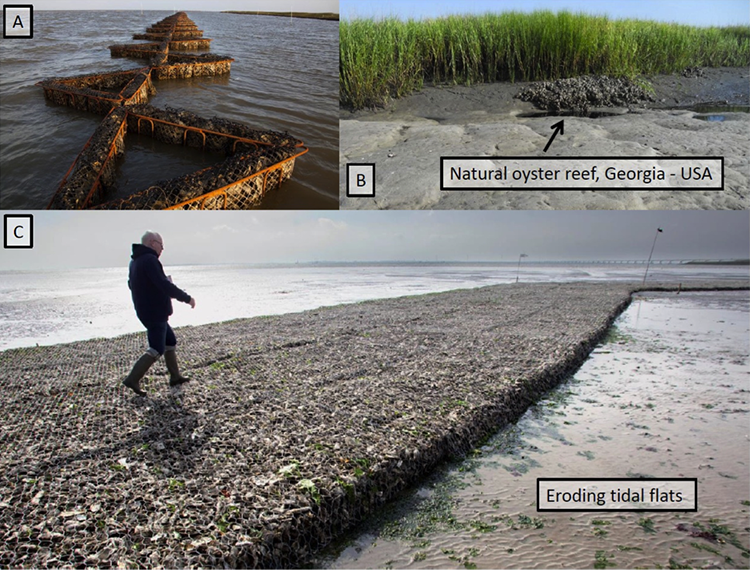
Learning Check Point
Learning Check PointTake a few minutes to think about what you just learned.
Objective: Understand the benefits of building with nature and distinguish smart building approaches.
Look at the image below.


Module 10 Lab
Module 10 LabDevelopment of Smart Building for a Rapidly Growing Coastal Community (Tampa Bay, FL)
Objective
The objective of this activity is for you to explore smart building measures for a city that is threatened by sea level rise and storms.
Background
A group of cities surrounds Tampa Bay, FL, a bay/estuary along a tectonically inactive, trailing margin coastline. The coastline surrounding the bay inlet is composed of sandy beaches and barriers, and elevations range from lowlands near mean sea level to Pleistocene uplands of over 10 m. This coastal region is exposed to tropical storms and hurricanes that can produce storm surges of several meters above mean sea level.
You will read more about the background of this Lab in the Module 10 Lab Worksheet.
Downloads/Resources
Statement of Use of AI on Exams, Quizzes, and Labs
Instructions
Before you begin the Lab, you will need to download the Lab worksheet. We advise you to either print or download/save the Lab worksheet, as it contains the steps you need to take to complete the Lab in Google Earth. In addition, it contains prompts for questions that you should take note of (by writing down or typing in) as you work through the Lab.
Once you have worked through all of the steps, you will go to the Module 10 Lab to complete the Lab by answering multiple-choice questions. The answers to questions on this Lab worksheet will match choices in the multiple-choice questions.
Summary and Final Tasks
Summary and Final TasksIn Module 10, you learned how smart building can help reduce the vulnerability of coastal populations exposed to increasing threats due to growth and global climate change. In case studies, the smart building of early settlers, cities, and communities was shown, where smart building methods included settling on natural levees, artificial mounds, and building floating cities. In recent times, the increasing coastal populations and economies have required more extensive protection works. The "Deltaworks" in the Netherlands protect the mostly-below-sea-level country from floods with massive engineering structures; however, later designs were altered to protect the vital estuarine habitat. Settlement in New Orleans was originally concentrated along the relative high-ground of natural levees; with advances in pumping technology, former backswamp areas could be settled, setting the stage for the Hurricane Katrina levee failures and flooding disaster. "Building with Nature" is a culmination of smart building principles, incorporating natural coastal processes and soft stabilization principles to reduce flooding risk, while enhancing recreation and ecology. As made clear in the assessments, smart building is often characterized by thoughtful development. If development doesn't create new risks, new risk mitigation measures will not be required.
Reminder - Complete all of the Module 10 tasks!
You have reached the end of Module 10! Double-check the Module 10 Roadmap to make sure you have completed all of the activities listed there before you begin Module 11.
References and Further Reading
- Campanella, R. (2006). Geographies of New Orleans: Urban Fabrics Before the Storm (p. 433). University of Louisiana at Lafayette.
- Campanella, R. (2007). Above-Sea-Level New Orleans: The Residential Capacity of Orleans Parish’s Higher Ground. CBR Whitepaper Funded by Coypu Foundation
- Campanella, R. (2010). Mapping and Interpreting the Human Geography of New Orleans, Louisiana, USA. Le Monde Des Cartes, (204), 29–41.
- Few, R. (2003). Flooding, vulnerability and coping strategies: local responses to a global threat. Progress in Development Studies, 3(1), 43–58.
- Hoep, F. S. (2002). Holland Compass: 2000 Years History of Water (p. 152). Communicatie Bureau Hoep & Partners.
- IPCC. (2007a). Climate Change 2007 - The Physical Science Basis: Working Group I Contribution to the Fourth Assessment Report of the IPCC. (M. Tignor & H. L. Miller, Eds.)Science (p. 1009). Cambridge University Press.
- IPCC. (2007b). Climate Change 2007: Impacts, Adaptation and Vulnerability. (M. L. Parry, O. F. Canziani, J. P. Palutikof, P. J. Van Der Linden, & C. E. Hanson, Eds.) The Intergovernmental Panel on Climate Change (Vol. 114, p. 976). Cambridge University Press.
- Seed, R. B., Bea, R. G., Abdelmalak, R. I., Athanasopoulos, A. G., Boutwell Jr, G. P., Bray, J. D., … others. (2006). Investigation of the Performance of the New Orleans Flood Protection System in Hurricane Katrina on August 29, 2005.
- United Nations Environment Programme. (2002). Assessing Human Vulnerability due to Environmental Change: Concepts, Issues, Methods and Case Studies
Capstone Project: Stage 4 Instructions and Examples
Capstone Project: Stage 4 Instructions and ExamplesYou are now in Stage 4 of the Capstone Project. We highly recommend that you work on Stage 4 during Modules 11-12 and complete and submit it early in the week of Module 13.
Directions
- Complete Stage 4 of the CVAT Coastal City Audit PowerPoint: Vulnerability, Planning and Action: (Orange Section). Include slides relevant to this stage for your City Slide presentation in indicated spaces.
- Make sure you insert references for your information sources as you go along.
- Submit your updated CVAT PowerPoint here by the due date. Please employ the following naming convention: Last Name_First Name Stage4.pptx
- After you have submitted Capstone Stage 4 with the City Slides and have received feedback from your instructor, you may make revisions to your City Slide figures. Remember they will be included in your end-of-semester presentation.
Statement on Use of AI in Capstone ResearchAI is a powerful tool for doing research and learning when used correctly. We allow the use of AI to research your Capstone city with the following strict conditions:
- You can use AI for research, but you cannot under any circumstances copy out of AI directly into the CVAT. You must rewrite everything in your own words. We can and will check all entries with a ChatGPT checker, which detects AI-generated text with 96% accuracy. There is no credit given for grammar, so please write everything from scratch and do not use Grammarly, as these can trip the AI checkers. Any direct copying will result in a ZERO for the assignment. You must cite all references that AI gives you.
- You will also include slides for your City Slides presentation relevant to Stage 4 for feedback. You cannot use AI for these under any circumstances for the City Slides, you can search for images using Google Images or any other search engine. Copying images or presentations out of AI is easily detected because and will receive a strict penalty.
Rubric
| Capstone Stage | Activity | Criteria | Points |
|---|---|---|---|
| CVAT Stage 4: Vulnerability, Planning, and Action | Complete CVAT Stage 4: Vulnerability, Planning, and Action, and submit by the due date. The instructor will grade your work and provide feedback where needed to help you improve your project. | Thoroughly describes all relevant vulnerability and resiliency planning strategies and policies the city currently uses to mitigate coastal hazards and outlines potential resiliency measures (policy and projects) that could be appropriate. Cites sources in references. (10 points). Describes vulnerability and resiliency planning and potential policies and projects, but detail or clarity could be improved. No references provided. (6 points). Description of vulnerability and resiliency planning and action items are sketchy, and details are missing. No references. (4 points). Very little information is provided regarding vulnerability and resiliency planning and action strategies. No references and AI sources not cited. (2 points). No information on these topics (0 points). | 10 |
Examples
Below are a couple of examples to help you get going. We stress that there are no correct answers, and these examples are for guidance, to help you with questions about the detail we expect in various components of the Capstone project. Also these were taken from a previous version of the CVAT which was more detailed. Every city is different, and there may be more information in one area or another for a specific city. For example, there is often more information, particularly in the engineering and policy areas, for U.S., European, and some Asian cities than there is for some cities in Africa. Again, please use these examples for guidance, along with the detailed directions for each stage, and let us know if you have any questions. Please note that there are slight differences between these examples and the current version of slides used in this course. The main thing we want to demonstrate with these examples, is the level of detail we are looking for.
Capstone Project Stage 4 Example: Bangkok, Thailand
Click on the expansion arrows at the bottom right of the slide show to view full-size images.
Capstone Project Stage 4 Example: Venice, Italy
Click on the expansion arrows at the bottom right of the slide show to view full-size images.
Capstone Project: Stage 5 Instructions
Capstone Project: Stage 5 InstructionsYou are now in Stage 5 of the Capstone Project. We highly recommend that you work on Stage 5 during Modules 11-12 and complete and submit it early in the week of Module 13.
Directions
- Complete Stage 5 of the CVAT Coastal City Audit PowerPoint: Site-Specific Concerns and Considerations (5a) and Recommended Resiliency Action Plans (5b): (Red Section). Include slides relevant to this stage for your City Slide presentation in indicated spaces.
- Make sure you insert references for your information sources as you go along.
- Submit your updated CVAT PowerPoint here by the due date. Please employ the following naming convention: Last Name_First Name Stage5.pptx
- After you have submitted Capstone Stage 5 with the City Slides and have received feedback from your instructor, you may make revisions to your City Slide figures. Remember they will be included in your end-of-semester presentation.
Statement on Use of AI in Capstone Research
AI is a powerful tool for doing research and learning when used correctly. We allow the use of AI to research your Capstone city with the following strict conditions:
- You can use AI for research, but you cannot under any circumstances copy out of AI directly into the CVAT. You must rewrite everything in your own words. We can and will check all entries with a ChatGPT checker, which detects AI-generated text with 96% accuracy. There is no credit given for grammar, so please write everything from scratch and do not use Grammarly, as these can trip the AI checkers. Any direct copying will result in a ZERO for the assignment. You must cite all references that AI gives you.
Module 11: Vulnerability to Coastal Hazards: Policy for Coastal Resilience
Module 11: Vulnerability to Coastal Hazards: Policy for Coastal ResilienceIntroduction
In the last three modules of this course, we will explore the policy related to coastal hazards. The first of these modules (Module 11) will focus on the ideas of risk and vulnerability and the question of why coastal hazards cause more damage and suffering in some places than in others – and how policy can address these disparities and increase the resilience of the most vulnerable places. In Module 12, we will look at the emergency management cycle as it pertains to coastal hazards, thinking about the four stages of mitigation, preparedness, response, and recovery. In Module 13, we will examine policy pertaining specifically to sea level rise.
Module 11
We will explore this complex question “Why do coastal hazards cause more damage and suffering in some places than in others?” while applying lessons learned in earlier modules. We will examine the concepts of risk and vulnerability to a range of coastal hazards in coastal communities around the world.
Take a moment to think about how you might quickly answer the question above. If you brainstorm answers to this question with a friend or partner now, you may first start by discussing the physical aspects that lead to one place being more vulnerable than another, such as topography, geologic and geographic location in relation to hazards such as hurricanes or tsunami. This would be the beginning, but to really get to the answer in-depth, we must consider how the hazard we are thinking about affects the human elements of the place we have in mind. Who lives there? How many people, and how do they make their living? Are they rich or poor? Is the population largely made up of many more vulnerable people such as minorities, poor, elderly, or the sick? What kind of housing is there in the community? Is it designed to withstand the hazard? Are there industries and businesses in the community that could be at risk or that may pollute the community if affected by a coastal hazard? All these questions are asking: How vulnerable are this community and its inhabitants to a coastal hazard?
When a storm does strike a populated area, the amount of harm caused will depend on a complex interaction among several local physical and social factors. Long, narrow bays may worsen storm surge (as was observed during Sandy on the Long Island Sound), while certain kinds of coastal vegetation (such as mangroves) may protect coastal property from rising water. As seen during Hurricane Katrina, evacuation orders can save lives, but only if people have access to transportation, housing, and other resources needed to leave their homes and live elsewhere. And, as Typhoon Haiyan demonstrated, devastation can be extreme when a strong storm hits an area where buildings are built-in hazard zones and are not designed to withstand high winds or surge. Thus, to assess vulnerability effectively, compare the vulnerability of different people and places, and allocate resources accordingly, our policymaker would first need a consistent way to integrate these many factors into an overall vulnerability assessment.


Goals and Objectives
Goals and Objectives- Students will assess the physical and social components of vulnerability to coastal hazards.
- Students will analyze worldwide case studies of coastal communities and their responses to coastal hazards in the context of vulnerability
Learning Objectives
By the end of this module, students should be able to:
- Identify the components of risk and vulnerability of coastal populations
- Assess and compare the exposure, sensitivity, and adaptive capacities of different coastal communities from an integrated earth systems perspective.
- Weigh the risks posed by coastal hazards and ways in which communities can adapt to increase resilience
Module 11 Roadmap
| Activity Type | Assignment |
|---|---|
| To Read | In addition to reading all of the required materials here on the course website, before you begin working through this module, please read the following required readings to make sure you are familiar with the content so you can complete the assignments.
Extra readings are clearly noted throughout the module and can be pursued as your time and interest allow. |
| To Do |
|
Questions?
If you have any questions, please use the Canvas email tool to contact the instructor.
Vulnerability's Three Dimensions Introduction
Vulnerability's Three Dimensions IntroductionLet’s break down the concept of vulnerability to a coastal hazard into its components.
What Exactly is Vulnerability?
In terms of social science and natural hazards, vulnerability can be thought of as a three-dimensional construct.
The three dimensions of vulnerability we will explore are exposure, sensitivity, and adaptive capacity.
- Exposure is the degree to which people and the things they value could be affected or “touched” by coastal hazards.
- Sensitivity is the degree to which they could be harmed by that exposure.
- Adaptive Capacity is the degree to which the community could mitigate the potential for harm by taking action to reduce exposure or sensitivity. This can also be thought of as a measure of resilience. See below.
Take a few minutes to watch at least the first 4-5 minutes of this short video focusing on the immediate aftermath of Hurricane Katrina in New Orleans and coastal Mississippi.
Video: Hurricane Katrina Survivor Clung to Trees as House Fell Apart: Part 2 (8:32)
Hurricane Katrina Survivor Clung to Trees as House Fell Apart: Part 2
Narrator: In the chaos of the rescues, Serena Johnson found herself living a nightmare.
Serena: We went to, it was a Louis Armstrong Airport. And when you walked into the airport, you saw all this, like, it smelled like a hospital. Some people were passing there.
Narrator: Desperation and despair were already hard to bear. But on top of that, many of evacuees, like Serena, were separated from loved ones. Hurricane Katrina caused the largest and most abrupt displacement in US history.
Serena: People allows businesses, people lost homes that they work hard on.
Narrator: A million people in the Gulf Coast were uprooted, scattered across all 50 states. Unsure of how to find her father, Serena and her mother had no option but to evacuate without him. Soon they were airlifted from New Orleans with no idea where they were going, where her father was, or if he was even alive.
Serena: I remember like looking to my mom like, with tears in my eyes, it was like I lost everything.
Narrator: Including the city she called home. And while a devastated New Orleans was drowning in unmerciful floodwaters, just 57 miles away on the Mississippi coast, Katrina had also left a trail of unimaginable destruction. More than 60,000 homes were destroyed back on August 29, when the eye of the hurricane made landfall directly over Waveland Mississippi. There, deadly storm surges, nearly 30 feet high, exceeded everyone's worst-case predictions, leaving an entire community trapped. That's when Howard Oh Quinn spring into action. This video shows Howard fighting the storm. As roads turned into raging rivers, and cars were completely underwater, he pulled aboard anyone needing his help.
Howard: We're driving the boat down the highway. I mean I never expected that in 100 years. Wind was screaming like you never heard it before. Rain was coming down it was like needles hitting us. We just started hearing people hollering, so we start picking up people. They were all strangers.
Narrator: A true life boat with 15 desperate people crammed into a vessel meant to hold only six.
Howard: I had to do something, I'm not gonna leave them there. People was hollering for help, help, you go help em. I was scared, but I wasn't gonna let everybody in that boat know I was scared because I'd had a panic attack.
Narrator: Soon he heard frantic screams coming from this house, which was almost totally submerged.
Betty Gillan: We couldn't get our door open to get out.
Narrator: Betty Gillan, 76 at the time, was trapped inside.
Howard: I jumped overboard. When I opened up the door and I put her and her son and his girlfriend in the boat.
Betty: it was very scary.
Narrator: Howard navigated the boat through two miles of treacherous water, finally reaching safety on a motel balcony just above the water level.
Betty: He saved my life. He was like a little cloud come down from heaven, just to see me. I love ya Howard.
Howard: I love you too.
Narrator: Strangers before Katrina, now lifelong friends.
Howard: I mean they called me a hero, but everybody was a hero that made it out of that storm.
Narrator: For one woman we met in nearby Pass Christian, my hometown, there was no hero to rescue her. She's been silent about her story until now.
Diane Brugger: I was incredulous. I just couldn't imagine it. We thought we were safe
Narrator: Diane and Tony Brugger did not evacuate from Harbor Oaks, the historic inn they had lovingly restored. They believed it's 33-foot elevation was well above the predicted 25-foot storm surge.
Diane: It was supposed to be going towards New Orleans.
News Reporter: The track of the storm has shifted to the east.
News Reporter 2: Capable of producing a tornado seven miles southeast of Pass Christiana.
Narrator: The Brugger's took refuge on the top floor of their inn.
Diane: We saw the water coming, the cars and floating, and everything, and the water was almost up to scenic drive. And it was like, oh this is serious.
Narrator: News stations around the world covered the storm, reaching out to eyewitnesses who still had phone service. At daybreak, a Canadian news anchor spoke to Tony Brugger.
Tony Brugger: We had a couple of windows we weren't able to get to from the outside. They've already broken, so we're gonna try and board them up from the inside.
Narrator: He had no idea what was coming. One block away, police captured video of an alarming sight.
Policeman: That's Sergeant Michael Ali's patrol car.
Narrator: And as the waters continued to rise, tornadoes touched down in Mississippi, one of which hit the Brugger's full-on.
Diane: We were sitting in the, sitting on the bed, and the dogs were just going crazy, and the house you'd feel it sort of well you know, like lift up like a boat, and then settle back, and lift up like a boat. And we just looked at each other and I saw a weird acceptance in his eyes that really unnerved me. He almost was acknowledging that this was it. And I understood it, but I didn't accept it. But we said nothing. We just held hands and just looked at each other. And then when the house went up and then it didn't quite go right back down the way it was supposed to, and we all got up and then that's when the walls fell away and the ceiling came down. Then it just covered him.
Narrator: The house literally just started breaking apart.
Diane: It just sort of flattened out into like just a field of debris. Tony, when part of the ceiling came down, it caught his head and just took him right under.
Narrator: Somehow Diane survived.
Diane: The only thing I remember is the trees, there were two together, and I had a foot in one and a foot in the other tree. It was all just, hang on.
Narrator: She clung to the tree limbs for six hours until the violent storm subsided and she was rescued. Having lost the love of her life, her home, and her communty, how could she possibly find the strength to carry on.
Narrator: A little later, how Diane discovers that determination. The amazing reinvention of a life. Also, a saint comes marching in.
Man: I needed somebody to believe in me just as much as New Orleans needed someone to believe in them.
Narrator: How Drew Brees and football win back the joy.
Knowledge Check Point
People and Things They Value
What is meant by the expression “people and things they value”?
This expression not only refers directly to people’s lives, livelihoods, and things of economic value, but also to places and to cultural, spiritual, and personal values. Also included are critical physical infrastructures such as police, emergency, and health services buildings, communication and transportation networks, public utilities, and schools, and daycare centers. It also refers to social infrastructures such as extended families, neighborhood watch groups, fraternal organizations, and more. The expression even includes such social factors as economic growth rates and economic vitality.
A community may be highly vulnerable to a low impact coastal hazard because of high sensitivity or low adaptive capacity – for example, a densely populated, impoverished neighborhood built on a low-lying shoreline could be easily inundated with a minimal flood from storm surge or tsunami and, due to the challenges imposed by poverty, they have great difficulty recovering from this event.
Another community can have a lower vulnerability to even high-impact coastal hazards because of low sensitivity or high adaptive capacity – for example, a wealthy tourist destination built to withstand flooding from storm surge may suffer a temporary setback when hit by a major hurricane but would be more likely to have the resources to rebuild than a low-income neighborhood would.
Therefore, coastal hazards can result in highly variable impacts because of these variations in vulnerability in time and space.
Disadvantaged groups of people are inherently more vulnerable to coastal hazards than others. The poor, the very old or very young, the sick, and the physically or mentally challenged are often vulnerable. Those lower educational attainment, or non-native speakers, are also often more vulnerable than native language-speaking people with higher levels of education. In the U.S., communities of color in coastal settings are often highly vulnerable, for example, this was true in New Orleans during Katrina and Puerto Rico during Maria. Vulnerable people may fit into more than one group. For example, the most vulnerable of a community could possibly be the minority, elderly, non-native speaking women.
Risk
What is Risk? Risk is the result of interaction between the components of the hazard and the vulnerability of the place that is impacted. Residents of a particular coastal community may weigh the risks of staying there versus relocating, or a person considering purchasing a house in a coastal community would definitely need to think about the risk to the property and his or her family and possessions. As we considered in our first exercise in Module 1, insurance companies account for all components of risk when determining insurance coverage. As the risk of devastating hurricanes has increased in the last decade, premiums have risen drastically in places such as South Florida. Below is a simple diagram summarizing the relationships between vulnerability, hazards, and risk.
Risk examples are obviously not restricted to coastal hazards. The descriptions above can be applied to other risks, such as serious illness during the COVID-19 epidemic. The risks of getting severely ill or dying vary greatly among different groups in a community, so that the elderly, those with underlying health conditions, and those living in group settings are at greater risk of severe illness from a COVID-19 infection than those who do not fit those demographics. Like other hazards, the disease has disproportionally affected minorities who tend to be poor and have more limited access to quality health care, so are more likely to suffer untreated underlying health conditions like high blood pressure and diabetes.

So, the question of why one place is more vulnerable to coastal hazards (or other types of hazards) relative to another does not have a simple answer. We must appreciate how the local frequency and intensity of these hazards interact with a diverse set of coastal processes, landforms, infrastructure, and social systems to harm people and things they value.
The question is important to policymakers because if governments and other coastal decision-makers are to make sound decisions to reduce the risk of all members of coastal communities to coastal hazards and prioritize spending to protect their most vulnerable people, places, and property, then they must understand where damage and suffering are likely to be greatest.
Resilience and Adaptive Capacity
The concept of resilience is important for understanding the adaptive capacity dimension of vulnerability to coastal hazards. The resilience of a community is its ability to use available resources to recover and grow from adverse situations, just as a resilient person can more easily bounce back from a setback than a less resilient person. Resilient communities can learn from past experiences and use that knowledge when confronting future problems. Systems with high adaptive capacity are therefore resilient and able to make the necessary changes to deal with coastal hazards. Systems with low adaptive capacity are much less resilient and much more vulnerable to coastal hazards. Later in the module, we will explore several examples of how communities with low adaptive capacity and poor resilience have coped with coastal hazards and how they have learned from these terrible experiences and are working to increase levels of resilience.
First, we will dig deeper into Vulnerability.
Assessing Vulnerability: The Vulnerability Scoping Diagram
Assessing Vulnerability: The Vulnerability Scoping DiagramFiguring out the vulnerability of a person, place, or thing is a surprisingly complex task. To simplify this task, scientists have developed an assessment tool known as the Vulnerability Scoping Diagram (VSD). Moving from the center outward, the VSD defines the system being studied, divides vulnerability into its three dimensions (exposure, sensitivity, and adaptive capacity), defines components of these dimensions, and then assigns measures of these components. Each of these pieces of the VSD is described in more detail below.

Examples of VSD Explained

The above figure shows an example of how the VSD can be used to assemble a holistic picture of the many different components that shape vulnerability to coastal hazards. This VSD shows the vulnerability of the elderly to storm surge in Sarasota, Florida, during the next decade. Starting with exposure, we see that the vulnerability of the elderly depends partly on the characteristics of the hazard itself – including storm surge, winds, and flooding – and partly on the location of the elderly relative to these hazards. The sensitivity of the elderly is a function of the age and income of the population, as well as their physical and mental health. The ability of the elderly to adapt to hurricanes – their adaptive capacity – is determined, among other factors, by how they perceive hurricane risks, the strength of their connections with family and friends (social capital), their access to living space outside of the hazard zone, and their education. Hence, elderly persons in Sarasota who are exposed to a large hurricane storm surge, are sensitive due to limited financial resources and poor health, and have few connections to friends or family, would be quite vulnerable. In contrast, elderly persons who are exposed to the same storm surge but are healthy and can draw on significant financial and social resources would be much less vulnerable. Note that while this example describes some important components of vulnerability to coastal hazards, a completed VSD will often include many more components than are listed here.
There are many ways to measure these components of the vulnerability of the elderly to storm surge. Computer models can simulate the likely extent and intensity of exposure to hurricanes’ rain, wind, and flooding; these simulations can be compared to observations from past storms, which can provide additional information about hurricane frequency and severity. Census data can show how many elderly persons are living in areas that are exposed to these hurricane hazards. Census data can also provide the measures of financial capital (household income), social capital, and living arrangement (number of persons per household), and educational attainment needed to assess these components of sensitivity and adaptive capacity. To measure other components (including physical and mental health or perception of hurricane risks), scientists may need to conduct their own surveys or request summaries of data sources that are not publicly available (such as the Sarasota County Registry of Persons with Special Needs).
Learning Check Point
Learning Check PointPlease take a few minutes to think about what you just learned and answer the questions below.
Dimension 1: Exposure
Dimension 1: ExposureExposure is the degree to which people and the things they value could be affected or “touched” by coastal hazards.
Think about your favorite coastal location. What are the aspects of the natural and built (human developed) environment in that location that affect the likelihood that people or things they value will feel the impacts of a natural hazard there?
If the location is a house built on a beach on a barrier island such as the Outer Banks of North Carolina or South Padre Island in Texas, it is highly exposed to a potential coastal hazard, but it may be in a small community and the hazard (storm) may be low intensity. In this case, the exposure is not as high as, for example, if the location is New York City, and the hazard is a storm like Sandy. In this scenario, millions of people and things they value (including complex infrastructure and things of great cultural value) are exposed. Also, the hazard is high intensity, so this amplifies the exposure. This scenario is one of very high exposure.
The components one needs to consider when assessing exposure are as follows:
Hazard frequency and intensity
In Modules 4 and 5 you covered both storm and tsunami hazards and read about the intense Hurricanes Katrina, Sandy, Maria, Harvey, Dorian, and several others. It is well established that climate change is resulting in storms of increased intensity, although there is less evidence that the frequency is increasing. However, in some locations in the world tropical cyclones are a relatively common occurrence, so can be considered frequent. The pattern of tropical cyclone frequency is illustrated in the animation shown here.
Video: Hurricane Tracks Animation and Cumulative Map (00:14) No narration.
Tropical cyclones have a wide range of wind speeds that are used to classify their intensities. NOAA’s National Climatic Data Center has assembled the best track data for 11,967 tropical cyclones into a single database, called IBTrACS, with information from 1842 to 2012. Included in that database are estimates of wind speeds along the tracks of the storms. This image shows the output of that data. By coloring the maximum sustained wind speed over the course of a storm’s life, certain patterns arise. In contrast to the similar image of storm frequency, the Northwestern Atlantic shows a much greater spread of strong storms, whereas in the Pacific the strongest cyclones seem to group near the Philippines. Credit: NOAA National Environmental Satellite, Data, and Information Service (NESDIS). NOAA Environmental Visualization Laboratory.Credit: NOAA SOSCoastal communities are increasingly exposed to extreme weather events including categories 3, 4, and 5 hurricanes and storms that generate extreme rainfall events. For example, you need only look at the 2017 hurricane season and consider Hurricane Harvey’s impact on Houston and Hurricane Maria’s impact on Puerto Rico.
Location and Landscape
 Oblique aerial photographs of Long Branch, New Jersey from before and after Hurricane Sandy. Note how the flood control structures (groins) have shaped the exposure to storm surge and beach erosion.Credit: USGS: St. Petersburg Coastal and Marine Science Center
The physical features of the coastal landscape play a major role in determining exposure. For example, the low-lying coastline of southeastern Louisiana exposes the city of New Orleans and nearby communities to hurricane storm surges from the Gulf of Mexico. Complicating the effects of low elevation features such a narrow bays and inlets that can amplify storm surge. In Module 6 you looked at many case studies of coastal hazards and their impacts, including Super Typhoon Haiyan (Yolanda) that devastated Tacloban City in the Philippines in 2013. Tacloban is another city with a large, dense human population situated close to the ocean on land that sits at a very low elevation. But in addition, Tacloban is in San Pedro Bay. Watch the storm surge simulation of Typhoon Haiyan below to see the effect of magnification of surge height as it enters the confines of the bay.
Video: Storm surge of Super Typhoon Haiyan making landfall (00:10) No narration.
This video is a simulation of the approach and impact in Tacloban of the storm surge of Super Typhoon Haiyan. It illustrates how the magnitude of the storm surge increases as it enters a shallow bay such as San Pedro Bay, where Tacloban sits. The result of this unfortunate combination of hazard intensity and location was the loss of 4,000 lives in Tacloban City alone.Credit: Maarten van Ormondt. Storm surge of Super Typhoon Haiyan making landfall. YouTube. Nov 10, 2013.Density of People and Property
Population density on Earth can be explored using this NASA Earth Observatory image. Take a minute to explore this interactive Night Light image from 2016. Consider how this imagery illustrates the distribution of the human population on Earth. It certainly shows the large urban areas well. But one thing to keep in mind is that some locations will show as brighter at night not only due to a greater or denser population, but because of the economics of the area. A wealthier country will have a better and more reliable energy supply.
We have already considered examples, such as Typhoon Haiyan, and Superstorm Sandy, where very densely populated areas are impacted by severe coastal hazards.
 Global population density.Credit: United Nations Environment Programme, Global Environmental Alert Service Center for International Earth Science Information Network - CIESIN - Columbia University, and Centro Internacional de Agricultura Tropical - CIAT. 2005. Gridded Population of the World, Version 3 (GPWv3): Population Density Grid, Future Estimates. Palisades, NY: NASA Socioeconomic Data and Applications Center (SEDAC). Accessed August 15, 2023. (Public Domain)
If this world population map and that of global hurricane intensity shown above are compared, we can see that the Atlantic seaboard of the U.S., as well as the east coast of China, are examples of places with high population density coinciding with high exposure to intense cyclones. Superstorm Sandy was unusual in size and intensity for a late-season storm hitting the northeastern U.S., but based on the map of storm intensity, it was not a complete anomaly. Adding the fact that Sandy, with its incredibly large diameter, impacted so many of the densely populated cities of the eastern seaboard, this was a perfect example of high exposure of people and property. In Module 6, you read about the circumstances of Sandy and the fact that these population centers (including New York, Boston, Philadelphia, ….) are home to 50 million people with an economic output of $3.6 trillion/year. The area definitely has a high exposure to hurricanes as the climate warms.
 A nighttime image of Hurricane Sandy, with lights of major cities on the U.S. east coast visible through its swirling clouds, overlaid on top of a map of the U.S. eastern seaboard.Credit: NASA: Sandy and OpenStreetMap
Learning Check Point
Learning Check PointUsing the satellite image and OpenStreetMap, identify three cities (bright spots) that were beneath Sandy’s circulation (evident here as a swirl of clouds) when this picture was taken. To identify specific cities, use the above satellite image overlay to identify the names of states that contain these cities. Then pan and zoom on the interactive map of the eastern United States to find the names of these cities.
Exposure Summary
Exposure SummaryThe maps on the previous page show how the severity of Hurricane Sandy’s impacts on the East Coast of the United States was a product of regional differences in not only the intensity of its wind, surge, rain, and snow but also in the distribution of people and property. One of the main reasons that Hurricane Sandy was so destructive was that it made landfall in a densely populated and developed region, exposing many people and the things they value to damaging wind and water. However, this is only part of the story. As the following sections on sensitivity and adaptive capacity will explain, other characteristics of the people who lived in Sandy’s path – including their demographics and their capacity to plan, prepare, and rebuild – also played an important role in shaping their vulnerability.
Dimension 2: Sensitivity
Dimension 2: SensitivityIntroduction
Sensitivity is the degree to which people and the things they value could be harmed by exposure to a hazard.
Sensitivity to coastal hazards is more difficult to assess than exposure, particularly before a disaster occurs.
In 2011, a 9.0 magnitude earthquake off the Pacific coast of the Japanese island of Tōhoku caused a massive tsunami that killed more than 15,000 people and destroyed or damaged hundreds of thousands of buildings. It also caused a nuclear disaster in the form of meltdowns at three reactors of the Fukushima Daiichi Nuclear Power Plant. However, other nuclear reactors within the path of this event’s tsunami waves were essentially unaffected.

Why did the Fukushima Daiichi plant experience catastrophic meltdowns while other reactors exposed to the tsunami did not? One explanation is that Fukushima Daiichi reactors were more sensitive to tsunamis than other reactors. Sensitivity, as defined earlier in this module, is the degree to which people and the things they value could be harmed by exposure to a hazard. It is important to assess sensitivity to a hazard before an event occurs to more fully understand the potential for adverse impacts. It is also important to assess sensitivity after an event has occurred to locate where the worst effects were felt and to identify lessons that might be applied to future hazard events.
Sensitivity to coastal hazards is more difficult to assess than exposure, particularly before a disaster occurs. Hurricanes and associated storm surge exposure are generally only possible in particular coastal areas globally, and are much more common in some areas than in others. Likewise, tsunamis are generally caused by undersea or volcanic seismic events, which limits the number of places they can physically occur. Because we have much historical experience and physical science knowledge about these hazards, we can often predict with reasonable accuracy which places might be exposed.
Sensitivity, however, is not always as clear. As depicted in the vulnerability scoping diagram presented earlier in this module, one needs to consider both the components of sensitivity to a hazard and measures of that sensitivity. Two components of sensitivity often considered to be important to understanding vulnerability to coastal hazards are infrastructure and demographics. Of these, infrastructure is the more straightforward of the two to assess. Typically, information is readily available on infrastructure’s date of construction, materials used, ability to withstand various hazards, and so on, particularly in developed countries. Understanding the condition and quality of infrastructure enables assessment of its sensitivity to hazards, and consequently the sensitivity of populations that rely on the infrastructure.
Demographic factors such as race, gender, and socioeconomic status can also play an important role in assessing sensitivity to coastal hazards. However, these factors are highly context-specific, and can also interact with one another.
The two aspects of a community most often considered in sensitivity assessments are the demographics of the population and the infrastructure of the built environment. Of these, infrastructure is the more straightforward of the two to assess.
Let’s think of an example we are already familiar with. With Hurricane Katrina, the infrastructure designed to protect the city of New Orleans from storm surges (the levee system) was not strong enough to withstand the surge and therefore failed and the city flooded. Many people living in the city had characteristics that lead to high levels of sensitivity. Poverty, sickness, and old age are three characteristics that were shared by many of the people who suffered the most as a result of Katrina’s flooding. This led to the shocking human catastrophe we witnessed, with thousands of people unable to evacuate and trapped, and some dying for lack of medical help or basic human needs. The city displayed a high level of sensitivity. This became painfully obvious after the storm, but was, perhaps, harder to assess before Katrina happened (although there had been many attempts to draw attention to the issue prior to the storm).
Similarly, but with far less impact on human suffering, with Sandy in New York, the infrastructure of Lower Manhattan, including the subway, was not designed to withstand a storm surge. This became painfully obvious after the storm, too. These lessons in sensitivity are (or should be) what drive communities to improve their resilience to coastal hazards by working to strengthen their adaptive capacity, as we will see in the next section.
Learning Check Point
Learning Check PointPlease take a moment to answer the following questions. It is not for credit, but the understanding is critical to the assessments in this module.
Sensitivity Summary
Sensitivity SummaryIn summary, sensitivity is the degree to which people and the things they value could be harmed by exposure to a hazard. To understand sensitivity, we need to consider both the components of sensitivity to a hazard and measures of that sensitivity. The two aspects of a community most often considered in sensitivity assessments are demographics of the population and the infrastructure of the built environment. Of these, infrastructure is the more straightforward of the two to assess. Understanding the condition and quality of infrastructure enables assessment of its sensitivity to hazards, and consequently the sensitivity of populations that rely on the infrastructure. Demographic factors such as race, gender, and socioeconomic status can also play an important role in assessing sensitivity to coastal hazards. However, these factors are highly context-specific, and can also interact with one another.
Dimension 3: Adaptive Capacity
Dimension 3: Adaptive CapacityIntroduction
What can community leaders and all community members do to build their resilience to coastal hazards?
The adaptive capacity of a community is its capacity to cope with, recover from, and adapt to hazard events. Coastal communities around the world are focusing on ways to adapt to increased risk in the face of amplified coastal hazards such as extreme weather and sea level rise.
The term resilience is often used to describe the ability to cope or bounce back after a setback such as a storm surge, or to cope with ongoing challenges such s more frequent tidal flooding. Resilience can be thought of as a measure of a community’s adaptive capacity. As we mentioned before, communities can increase their adaptive capacity and resilience by learning from a disaster or hazard event. New Orleans is certainly a good example that we will examine in a case study.
Our case studies of coastal hazard events around the world throughout this course have highlighted how the issues of social inequity in communities can impact the speed with which and how well certain groups of people are able to recover and bounce back from a setback such as flooding from Katrina or Sandy, or a tsunami such as the devastating 2004 Indian Ocean tsunami. Those things we mentioned in the section on sensitivity that make people more sensitive to the disruption and harm caused by an event such as these – age, health, poverty, and race all can be major obstacles to the ability to bounce back – recover and rebuild homes, lives, and livelihoods after a major setback.

Who are the most vulnerable?
As we have touched on already, there is a strong link between poverty and vulnerability. Why is this? First, the data show that lower-income Americans are more likely to live in neighborhoods prone to chronic flooding and to live in housing that is more susceptible to damage from storms. Second, lower-income people have lower levels of resilience because they do not have the economic cushions that help to reduce the shock when disaster hits. For example, poorer families are less likely to have flood insurance policies and have a harder time finding the resources to rebuild and get back on their feet. This has been clearly shown for families in New Orleans, who even a decade after Katrina were lagging behind wealthier counterparts in economic recovery. Adding to these facts, in many locations, including New Orleans after Katrina and Houston after Harvey, the communities of color were the ones of lower economical means and therefore have more difficulty recovering from the shock of these events. Longer-term effects of flooding also include health impacts and again, lower-income people and people of color tend to struggle more due to lack of access to high-quality healthcare in some cases. For example, after Katrina, houses that may not have been very badly flooded were rendered unlivable due to the black mold that grew in the hot, humid climate. It is much harder for a poor family to address more insidious long-lasting impacts such as these, and they can lead to chronic health issues such as high levels of childhood asthma.
As we work through the remaining modules of the course, keep in mind the need to find equitable solutions to the issues we are examining. If we, as a society, cannot address the need to increase resilience for everyone, the future is going to be very challenging for many people[d1].
[d1]Reference:
How to Increase Adaptive Capacity: Non-structural Measures for Strengthening a Community’s Resilience to Coastal Hazards
How to Increase Adaptive Capacity: Non-structural Measures for Strengthening a Community’s Resilience to Coastal HazardsWhat can be done so all members of a community can increase their adaptive capacity to reduce the impact of a coastal hazard event?
It’s important to draw a distinction between the actions of individuals, families, neighborhoods, municipalities, etc. to build the adaptive capacity of their community versus decisions on a governmental level to construct physical barriers such as flood walls and other engineering structures to protect the community, which were the focus in Module 7. In this module, we are focusing more on what is called non-structural adaptations and the policies that drive them, rather than on engineering or structural solutions. But of course, the two kinds of adaptations work together to reduce the risk of coastal hazards.
A community can take action towards increasing its adaptive capacity on many levels. These actions are designed to reduce or avoid risk or damage from hazard events or to reduce or avoid people’s or places’ exposure and/or sensitivity to hazard events. So, included in thinking about adaptive capacity and resilience is how everyone can become better informed and prepared for an event that could cause harm, whether it is a hurricane, tsunami, or another coastal hazard event. We will delve into this in detail below.
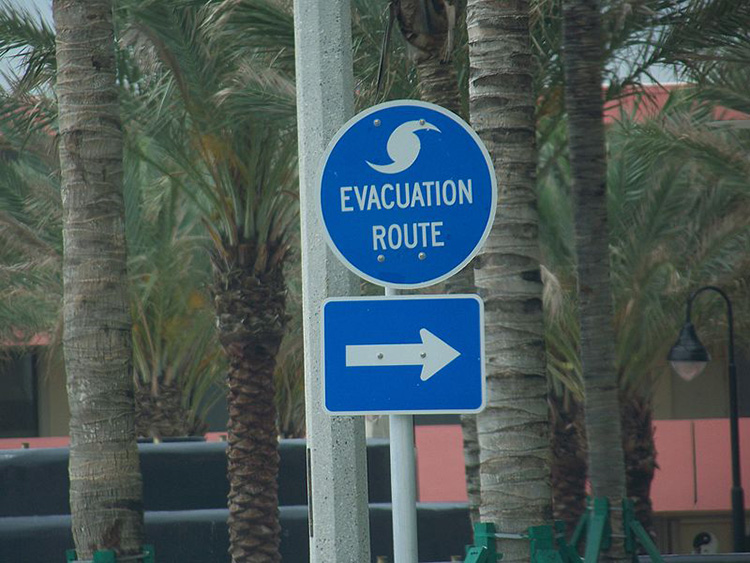
Increasing Community Resilience
A lot of work is taking place to address the need to increase coastal resilience or adaptive capacity. Work can be done at all levels of society - Individuals, families/households, communities, and local, state, and federal governmental units. There are many exemplary programs around the U.S. and the rest of the world that are working to reduce the vulnerability and increase the adaptive capacity of coastal communities. Each major coastal disaster we have looked at in this course has stimulated local and national policy changes in the communities affected so that greater protection and resilience is enacted. The questions you might ask are: Is enough being done? Is coastal resilience increasing at the same rate as the risk of harm from a coastal hazard is increasing? What can different levels of a community do to increase a community’s adaptive capacity and resilience?
What individuals and families can do:
As an individual, learning about hazards can help you prepare for the hazard event and know what to do during or after disasters. Families or households can buy hazard insurance, prepare a disaster supply kit, and develop an evacuation or shelter in place plan to protect themselves and their loved ones. As we noted above, families must have the means to buy insurance and execute plans such as evacuation. Those who don’t have the means are at an immediate disadvantage.
What community organizations and local government entities can do:
Communities and local governmental and non-governmental entities such as non-profit organizations in a community can play important roles in educating the community and working on various aspects of community resilience, including providing assistance to disadvantaged families.
In areas prone to coastal or other hazards there are usually educational programs offered to schools, churches, and other places where learning takes place to increase awareness and understanding of disaster preparation. An example in New Orleans is the Evacuteer program, which is a non-profit organization that started after Hurricane Katrina, filling an immediate need to help people plan an evacuation, but also to help New Orleans community members generally develop greater resilience or adaptive capacity. See Evacuteer. Another example is in coastal Washington state where schools prepare students to evacuate in the event of an earthquake and possible tsunami that would flood their school (see Module 7).
In addition, community organizations and local governments can work together with citizens to develop hazard mitigation plans to help community members before, during, and after hazard events. One important way communities can increase their resilience to flooding is to take mitigation steps that count toward the Community Rating System (CRS) of the National Flood Insurance Program (NFIP). CRS points are earned to reduce flood insurance premiums in a participating community. This is described later in the section on the NFIP. It is a very important tool for communities to take proactive steps towards addressing resilience to chronic flooding issues. Mitigation measures may include raising the elevation of homes and protecting critical infrastructure.
In Module 12 we will focus on the Emergency Management Cycle of Mitigation, Preparedness, Response, and Recover. The measures mentioned above will be explored further there.
What other levels of government can do:
Governments at various levels can work to increase resilience in several ways. These methods include the improvement of building codes and enacting new zoning and land-use plans to address issues arising from increased flooding. Emergency services, early warning systems, and communication of warnings are key to community resilience and rely on coordination at many levels to be effective, as we mentioned in the discussion on tsunamis. The Federal Department of Homeland Security, in which the Federal Emergency Management Administration (FEMA) resides has state offices that address emergency preparedness and disaster management. State Office of Homeland Security oversees all-hazard preparation, mitigation, and recovery. City and state governments in many coastal areas have emergency preparedness offices or agencies and many have coastal resiliency officers. Government agencies such as these also play an important role in disaster-reduction educational programs. Check out the links under Recommended Resources to find ways FEMA provides guidance to homeowners to prepare for potential flooding events. As you will read below, the federal government is overdue to address weaknesses in the NFIP, which, when enacted may change the way flood insurance works for homeowners and business owners.
Addressing Social Inequity Issues that Hamper Community Resilience
People in poverty may not have access to ways of coping in an emergency and therefore they suffer more. After the hazard event has passed, poor people may have fewer means during recovery. They may not be able to repair the damage to their house for a lack of funds and insurance. Programs that address disparities between the rich and poor when it comes to coping with coastal and other hazards are essential. Although policymakers recognize the importance of poverty reduction in enhancing people’s adaptive capacity, it is challenging to implement so it must be a long-term, ongoing strategy for building adaptive capacity.
Poverty reduction might be the most fundamental way to enhance people’s adaptive capacity. Working to increase educational and financial opportunities to lead people out of poverty in communities in need is one long-term strategy that is fundamental to decreasing poverty and thereby increasing adaptive capacity around the world as well as in the U.S.
In a 2018 article, “Echoes of Katrina: Post Hurricane Maria Public Health Threats and Trauma”, referenced in the Recommended Reading section of this Module, authors with the Center for American Progress discuss the disproportional impact of extreme weather events such as Hurricane Katrina on the Gulf Coast, and Hurricane Maria in Puerto Rico and the U.S. Virgin Islands have in communities disadvantaged by poverty and racism. Below we will look at the impact of Maria on Puerto Rico and the response by the Federal Government. In the article, the authors state,
“To prepare for and recover from increasingly strong and frequent extreme weather fueled by climate change, communities of color and families living in poverty are forced to overcome additional barriers set in place by historic discriminatory policies and practices. And, as in the aftermath of Hurricane Katrina, families with limited means, women, young children, older adults, and residents with disabilities are disproportionately affected.”
These “barriers” come in various forms, often related to public health, such as: being more likely to live in sub-standard housing subject to the growth of mold after a storm, which can cause serious lung ailments; living in neighborhoods more prone to flooding and environmental pollution, which compounds the impacts of the event from which the community is trying to recover; more likely to suffer trauma, which can lead to PTSD and other mental health issues. Therefore, on top of the financial strain of trying to recover from a major disaster, these many obstacles can compound the problems in disadvantaged communities. In addition, many poor families are forced from their homes permanently because of economic needs, whether it is a lack of funds for repairs or the need to move to find employment. This was a common scenario following Katrina in New Orleans and Maria in Puerto Rico. These factors hamper and prolong the recovery process. The authors of the above-mentioned article stress that disadvantaged communities such as those devastated by Hurricane Maria must receive ongoing financial assistance to be able to not only rebuild but increase the resilience of their community by making the needed changes and improvements to remove the obstacles mentioned above.
Cultural Sensitivity
In working to enhance community adaptive capacity, policymakers also need to be aware of the cultural differences among members of their populations, especially in regions or nations that have diverse cultural groups. These differences have major implications for developing community disaster reduction projects. For example, some cultures tend to work collectively while other cultures stress individual action. In another instance, some cultures may be inclined to believe in fate, making them less likely to prepare for natural disasters. It is worth mentioning here that cultures that have evolved in coastal settings also contain a level of local knowledge of the hazards that can be helpful in times of disaster or ongoing threat. Examples include many groups of indigenous people around the U.S. and in other countries. An example you met in Module 9 is the case of the tribal members of Isle de Jean Charles, Louisiana, who are descendants of Biloxi, Chitimacha, and Choctaw Indians. Their resettlement plan ran into obstacles related to misunderstandings due to cultural differences between the state policy experts and tribal leaders. To read more about the resettlement of Isle de Jean Charles, please visit Isle de Jean Charles: Tribal Resettlement.
Learning Check Point
Learning Check PointPlease take a few moments to think about what you just learned, then answer the following question to test your knowledge.
Adaptive Capacity Summary
Adaptive Capacity SummaryIn summary, adaptive capacity is the capacity of a community to cope with, recover from, and adapt to hazard events. Coastal communities around the world are focusing on ways to adapt to increased risk in the face of amplified coastal hazards such as extreme weather and sea level rise. Adaptive capacity involves any action taken either to reduce or avoid risk or damage from hazard events or to reduce or avoid people’s or places’ exposure and/or sensitivity to hazard events. There are several types of strategies that reduce or avoid exposure or sensitivity. They include the ideas of mitigation, adaptation, and resilience. While those terms mean slightly different things than adaptive capacity, all of the terms consider the capacity to cope with, deal with, and adapt to hazard events.
Case Studies: Exposure, Sensitivity, and Adaptive Capacity in Real Examples
Case Studies: Exposure, Sensitivity, and Adaptive Capacity in Real ExamplesTo help you understand Exposure, Sensitivity, and Adaptive Capacity, you will be introduced to several case studies.
2004 Indian Ocean Tsunami
2004 Indian Ocean TsunamiIntroduction
The Indian Ocean Tsunami of 2004, which we covered in Module 7, provides us with a case study to help understand how levels of sensitivity and adaptive capacity affected the level of impact and the recovery of the communities in the tsunami’s path.
The massive earthquake and tsunami that occurred on December 26, 2004, off the coast of Indonesia, was one of the most damaging disasters in recorded history. It caused at least 230,000 deaths and billions of dollars in damages in countries bordering the Indian Ocean. The tsunami impacted many countries including Indonesia, Sri Lanka, India, Thailand, the Maldives, and Somalia. Of the people who lost their lives, many vacationing westerners were included.
Following this severe hazard event, damages were unevenly distributed throughout the affected regions. The reasons for this inequity are complex and include variations in all three dimensions of vulnerability, exposure, sensitivity, and adaptive capacity. Let’s look at sensitivity and adaptive capacity.
Sensitivity
Variations in sensitivity were one of the major factors, driven by variability in economic resources and demographic factors.

Sri Lanka and housing sensitivity:
One heavily affected country was Sri Lanka, where 0.17% of the entire national population was killed and 2.5% were displaced. The Sri Lankan scholar Mohan Munasinghe observed that houses belonging to poorer individuals that were in the path of the tsunami were more likely to be destroyed due to the low quality of construction, suggesting a higher sensitivity of the physical property of poorer people. One clear way of reducing sensitivity to tsunamis in Sri Lanka would be stricter housing construction requirements at the coast. However, Sri Lanka is a poor country with limited economic resources, which could make implementing and enforcing such requirements difficult.

Adaptive Capacity
Importance of traditional family community networks for enhancing adaptive capacity:
Many community members in developing nations, despite lacking in economic resources, have access to strong traditional family and community networks. These networks are valuable, if not essential, for recovery by providing informal mutual help following a disaster, like a tsunami. In the case of Sri Lanka, Munasinghe noted that these networks improved survivors’ ability to cope with and recover from the disaster compared to wealthier groups. Therefore, in this instance, informal social ties reduced community sensitivity to the hazard event. This is an example of adaptive capacity, which will be described in a subsequent section.
Learning Check Point

Economic Recovery and Adaptive Capacity
Anthropogenic factors can sometimes exacerbate the losses from a natural hazard like a tsunami. Economic development patterns of South Asian coasts played a part in 2004, including tourist developments and shrimp farms, which had negatively impacted coral reefs and mangroves that otherwise might have diminished the intensity and inland reach of the tsunami. In some communities, the reliance on these types of economic development have limited local livelihood options to tourism-related or fishery-related jobs, instead of more traditional, diversified livelihood strategies. The damages to tourism and fisheries industries following the tsunami placed greater stress on communities that were heavily dependent on jobs in these sectors. Consequently, it was harder for local people in these communities to recover from the tsunami because of damages and the lack of other livelihood options.
Despite the widespread damage, some communities suffered less or recovered more quickly because they possessed higher adaptive capacities to this hazard event. One study found that fishing communities on Simeulue Island, Indonesia, and Surin Island, Thailand had fewer losses from the tsunami because they possessed traditional knowledge of tsunamis and had institutions in place that helped them prepare for and respond to the disaster.
Around the Indian Ocean basin, there were no early warning systems when the tsunami struck. In response to the disaster, governments almost immediately collaborated to develop the Indian Ocean Tsunami Warning and Mitigation System to reduce exposure to tsunamis. This aspect will be discussed further in Module 11.
1992 Hurricane Andrew and Housing Sensitivity in South Florida
1992 Hurricane Andrew and Housing Sensitivity in South FloridaAnother example of the role of sensitivity in creating vulnerability to hazards involves the impacts of hurricanes on mobile homes. As discussed in Module 6, in 1992, Hurricane Andrew struck the Florida coast as a category 5 storm. Many South Floridians still have vivid memories of Hurricane Andrew. It became the costliest storm in history at the time, causing an estimated $25 billion in damages and 17 direct deaths and many more indirect deaths, amounting to approximately 44 deaths. The storm came ashore just to the south of Miami, devastating the town of Homestead. Had it hit the coast just 20 miles to the north, it is estimated that the economic and human costs would have been multiplied more than ten-fold. In the case of Hurricane Andrew, the wind damage had the greatest impact. In the communities impacted, mobile homes received the most severe damage, and the severity of destruction was partially attributed to structural design that could not withstand the winds of a major hurricane. In fact, 90% of all mobile homes in Miami-Dade County were damaged beyond repair. In Homestead, 99% of mobile homes were completely destroyed. Many of South Florida’s poorer residents resided in this highly sensitive type of housing, so they were disproportionally impacted by the hurricane.
Many lessons were learned from Hurricane Andrew in terms of sensitivity related to insufficiently stringent building codes in general and mobile home construction codes specifically.
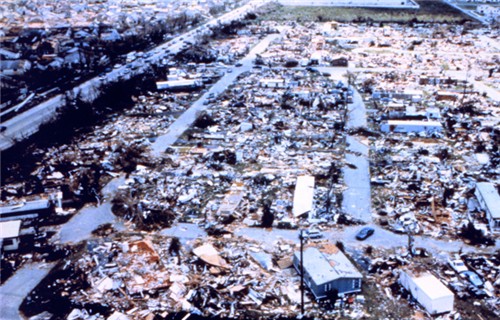
The production of mobile homes is regulated by the Department of Housing and Urban Development (HUD) building codes. At the time that Andrew struck, relatively lax building codes from 1976 were in place, making mobile homes especially sensitive to the major hurricane’s intense winds. After Hurricane Andrew, HUD significantly strengthened the building codes to enhance the structural integrity of mobile homes; these improved regulations went into effect in 1994. In addition, the Florida Department of Highway Safety and Motor Vehicles, which ironically treats mobile homes not as buildings but as vehicles, also placed several stricter rules on mobile home construction in 1996 and 1999.
The revised mobile home standards have had a dramatic impact on the sensitivity of these structures (Table 1). In the very active 2004 hurricane season, which saw four hurricanes make landfall in Florida, all damages to mobile homes occurred in units built before the federal regulations changed. No mobile homes built after 1994 were damaged. This is a clear example of variable sensitivity to the same hazards based on the quality of construction.
| Hurricane | Total number of mobile homes in storms' path | Mobile homes built before July 1994 | Mobile homes destroyed | Mobile homes built after July 1994 | Mobile homes destroyed and seriously damaged |
|---|---|---|---|---|---|
| Charley | 11909 | 9011 | 2413/26.8% | 2898 | 0/0% |
| Frances | 7089 | 6961 | 99/1.4% | 128 | 0/0% |
| Ivan | 1432 | 1246 | 82/6.6% | 186 | 0/0% |
| Jeanne | 8845 | 8001 | 989/12.4% | 844 | 0/0% |
| Total | 29275 | 25219 | 3583/14.2% | 4056 | 0/0% |
Learning Check Point
Fukushima Daiichi Nuclear Disaster
Fukushima Daiichi Nuclear DisasterLet us return to the example of the Tōhoku earthquake and tsunami and subsequent Fukushima Daiichi nuclear disaster. Fukushima Daiichi and several other Japanese nuclear plants were all exposed to tsunami hazard, in the sense that they were close enough to the coast that a tsunami could affect their operations. The plants are designed to automatically shut down during earthquake and tsunami events, but the shutdown process itself requires power, which is provided by diesel generators. They are also protected by seawalls that are designed to prevent flooding by waters up to a specified height.

There were two major sources of sensitivity at Fukushima Daiichi, one of which applied to all of the other Japanese nuclear facilities, and one of which was particular to Fukushima Daiichi. If the on-site diesel generators at any plant flooded and failed, no additional failsafe mechanism was available, and a meltdown became possible. This potential for failure greatly increased the sensitivity of these plants and the surrounding populated places and property. More importantly, in this example, if the seawalls were too low and could, therefore, be overtopped by a tsunami, then flooding might disable the generators. This is exactly what happened at the Fukushima Daiichi plant. Its seawall was 19 feet high. Despite warnings in a 2008 report suggesting that the plant could be exposed to a tsunami of up to 33 feet, the plant was still protected only by the existing 19-foot seawall when the tsunami struck. The tsunami that made landfall reached over 40 feet high, even larger than the earlier report had suggested was possible. Because the seawall was inadequately protective relative to the magnitude of the potential hazard, the plant was more sensitive to a catastrophic meltdown, which in turn increased the sensitivity of nearby populations to exposure to radioactive materials and long-term contamination of property and natural resources.

What lessons might we learn from the Fukushima nuclear disaster that could reduce sensitivity to similar future hazard events? This is a particularly tricky question in this case. Earthquakes of the magnitude of the Tōhoku earthquake, which was the initial hazard event that triggered the tsunami and subsequent nuclear disaster, are extremely rare. However, sensitivity to a hazard of this magnitude was sufficiently great that the result was a catastrophe. The extents to which countries should prepare for very rare events with potentially extreme consequences are difficult political and policy questions.
However, setting those questions aside, there are two main ways in which sensitivity could have been reduced in this situation. First, the seawall was far too short and could have been overtopped by a much smaller seismic event and tsunami. To reduce this sensitivity, seawalls protecting nuclear power plants should be built to withstand a tsunami of the highest possible levels. Second, any additional strengthening or redundancy in the electrical power system responsible for powering shutdown during a seismic event would further reduce reactor sensitivity to a tsunami.
Learning Check Point
Please take a few minutes to think about what you just learned then answer the question below.
Tacloban, Philippines, and Super Typhoon Haiyan
Tacloban, Philippines, and Super Typhoon HaiyanOn November 8, 2013, Super Typhoon Haiyan (locally known as Yolanda) swept across the Philippines, generating a storm surge of more than 5 meters in places and winds in excess of 190 mph. Fifteen million people felt the effects of the storm directly. Across the nation, approximately 4.1 million people were displaced from their homes, and more than 6,000 lost their lives. This made Haiyan the deadliest storm recorded in the Philippines. The nature of the storm itself, the geology and geography of the Philippine Islands, as well the population distribution and economics of the people living in the affected communities all contributed to the severity of the impact of Haiyan on communities. What made Tacloban so vulnerable? We can break it down into the components of vulnerability to understand this,
Exposure
Tacloban City is densely populated with more than 240,000 residents, many of whom are poor. Much of the city sits at low elevation, with many parts, including the airport, sitting below 5 meters above sea level. The storm surge was reported to be more than 5 meters (16 feet) in height. Population density, at 1200 people per square km, or about 3,000 per square mile makes for a densely populated urban area. The Philippines is highly prone to typhoon activity, with twenty tropical cyclones crossing the island chain per year on average, with ten of those reaching typhoon status, and five of these causing major destruction. These factors render the Tacloban city highly exposed to typhoon hazards.
To appreciate the level of destruction and conditions in the immediate aftermath of the typhoon in Tacloban City and some of the factors that combined to create such levels, please read the two articles (BBC and New York Times) linked below. In the BBC article, there is a short video that really helps to bring to life the misery following a catastrophe such as this of a densely populated city such as Tacloban.


Sensitivity
Remember that by using the term sensitivity, we are referring to such measures as poverty levels and the state of infrastructure. Because Tacloban was essentially destroyed by Haiyan, everyone in the city was impacted (see maps in linked articles). But the high level of poverty that exists in the Philippines accentuated and increased the scale of suffering. According to the Humanitarian Practice Network, the Philippines ranked 165th in world GDP in 2013, and approximately 2 million people in the country were living on $2 per day. Tacloban is a relatively wealthy city within the Philippines, so this rate of poverty is not as severe in the city as some parts of the Philippines. However, even though the government had a relatively good typhoon preparation program in place, poverty levels, coupled with the sheer size of the storm, rendered preparations ineffective. Houses were not designed for the power of the storm surge and winds and were completely destroyed, leaving people homeless. The sensitivity of the low-lying infrastructure of the airport is another case in point. It sits close to sea level and was overwhelmed by the storm surge. Of course, an airport in an island nation is essential for disaster relief, so this hampered relief from reaching the stricken city immediately following the storm. It was three days before flights could land with relief supplies, and even then, only small planes could land. This led to a lack of basic supplies such as food and water for the residents. Long lines formed for scarce supplies. Refer to the BBC article in the readings linked below, which describes in detail the scenes of deprivation that ensued in the days following the typhoon. In addition, not only were roads and other transportation routes blocked, there would have been no working electricity or modern methods of communication in the aftermath of such a huge storm.
Adaptive Capacity
The poor are at a disadvantage when it comes to recovery. Those with financial means are more able to get back on their feet or bounce back from a disaster than those with few financial means. Many of those who lost livelihoods to Haiyan worked in the fishing industry and were poor. Two major elements worked to help the people of Tacloban and other communities devastated by Haiyan. One is the strong community networks that are so important, in which community members and families help each other. The other is aid from domestic and foreign governments and non-governmental organizations.
Currently, after nearly one decade, Tacloban’s economy is growing and the poverty rate has been lowered. This economic rapid bounce-back may be a phenomenon of a city that has to start from scratch. New Orleans also went through a rapid growth phase in the 10 years after Katrina. Sustaining this healthy economy will be the challenge and if Tacloban is successful, then it will prove its strong resilience and high adaptive capacity.

References and Recommended Reading
References
- Humanitarian Practice Network: Typhoon Haiyan: pushing the limits of DRR?
- Humanitarian Practice Network: Assessing early warning efforts for Typhoon Haiyan in Leyte
- The Guardian: Two years after typhoon Haiyan, leaders have a duty to act on climate change
Recommended Reading
- Tacloban: City at the center of the storm (BBC). This article contains both images and video. Please note that the video contains disturbing images.
- Mapping the Destruction of Typhoon Haiyan (New York Times) This article includes maps showing the path of the storm across the Philippines.
Module 11 Lab: Discussion
Module 11 Lab: DiscussionReflecting on Coastal Community Vulnerability
Overview
In this module, you learned about the components of vulnerability as defined by coastal policy experts. You read many case studies that helped to illustrate the components of vulnerability: exposure, sensitivity, and adaptive capacity.
For the Module 11 lab, we will spend time reflecting on what makes one coastal community more vulnerable than another and how they might reduce their vulnerability to coastal hazards. You will read the following statement and respond appropriately based on your knowledge of module concepts. You will respond to at least one other student's response throughout the week.
Discussion Prompt
Using one or two of the case studies from Module 11 (and listed in Required Resources), in this discussion, consider how adaptive capacity may be increased to reduce the vulnerability of a coastal community. Be specific in terms of location and coastal hazard.
Instructions
- Use Word or another text editor to respond to the prompt with your thoughts backed up with evidence from the Module 11 case studies. The length of your response should be about 200 to 400 words. (Typing your response in Word or another text editor and then copying/pasting from Word or similar to the discussion forum is recommended to avoid losing your work midstream in the event of an accidental browser closing, intermittent Internet connectivity, etc.)
- Go to Module 11 Lab (Discussion) and type or copy/paste your response to the prompt into the text box marked 'reply' and select Post Reply by 11:59 p.m. on Thursday to allow time for responses. Your response is now visible to your classmates and your instructor.
- Read through others’ responses and write a thoughtful reply to at least one other student by 11:59 p.m. on Sunday. These replies should be either a rebuttal in which you add your ideas in the form of a persuasive argument (written with respect for the originating author), or a response that agrees with, supports, and builds upon the original response. Because a timely response to the conversation is part of your grade, subscribing to the forum is required. Check in to the discussion forum often throughout the week to post and respond to comments.
Statement of Use of AI on Exams, Quizzes, and Labs
Grading
The grading rubric will help you understand what constitutes an appropriate level of participation on your part. The instructor reserves the right to not award any credit (including points for timing and interaction) if the content of the posts, however on-time they may be, are off-topic, offensive, or otherwise inappropriate. Such posts may be deleted at any time by the instructor as well.
| Content | Addresses all facets of the assigned discussion prompt, with accurate supporting detail where necessary. Response post is at least 200-400 words of substantive content addressing the prompt. Posts are appropriately cited as needed. To earn full credit in this category, your comments and replies to classmates must demonstrate thoughtful consideration of the topic and go well beyond, "I agree with you." | 6 Points |
|---|---|---|
| Formatting and Mechanics | Posts should be edited and cited appropriately as needed. While a discussion forum has an informal tone, please refrain from foul or offensive language, texting abbreviations, etc. | 2 points |
| Timing | This assignment is deliberately structured to allow you to participate throughout the week. Your initial response to the statement should be shared by 11:59 p.m. on Thursday and your response to at least one other classmate by 11:59 p.m. on Sunday to allow for authentic discussion to occur. | 2 points |
Summary and Final Tasks
Summary and Final TasksWe have introduced the three dimensions of vulnerability – exposure, sensitivity, and adaptive capacity – with a focus on coastal disaster contexts. In addition to showing how to quantify these dimensions of vulnerability, we have also shown how this model of vulnerability can be used to assess and compare the physical and social vulnerabilities of different coastal settings and populations. In the activity at the end of this module, you explored how the vulnerability model can be used to compare the vulnerability of three coastal communities to hurricanes. The case studies were meant to help you think about sensitivity as a component of vulnerability. Sensitivity can be related to physical factors, such as age and quality of infrastructure, as in the Fukushima Daiichi nuclear power plant and Florida mobile home examples, or it can be related to social factors, as in the Indian Ocean tsunami example. Although lessons from each of these examples are generalizable in the broad sense, it is important to think about vulnerability, including sensitivity, in a place-specific, localized manner. For example, issues related to mobile home sensitivity to hurricanes, although relevant in many parts of Florida, are not relevant to all places exposed to hurricanes. Likewise, many countries that are exposed to tsunami hazards either do not use nuclear energy or do not have any plants in tsunami hazard zones. In these places, the lessons of the Fukushima Daiichi disaster are only applicable in the generalized sense, i.e., that seawalls should be high enough to protect key resources from the highest waves likely to occur based on current science, and that critical resources requiring electrical power incorporate redundancy.
In the following modules, we will apply the concept of vulnerability to three kinds of coastal hazards: tsunamis, hurricanes, and sea level rise. We will also discuss policies in relation to those hazards. While tsunamis and hurricane hazards are short-term hazards that exist a few hours to several days, sea level rise is a medium- to long-term hazard that shows its impacts slowly over decades. We will discuss tsunamis and hurricane hazards, the two short-term hazards in the next module, and discuss sea level rise, the medium- to long-term hazard, in the following module.
Reminder - Complete all of the Module 11 tasks!
You have reached the end of Module 11! Double-check the to-do list in the Module 11 Roadmap to make sure you have completed all of the activities listed there before you begin Module 12.
References and Further Reading
- Frazier, T. G., N. Wood, B. Yarnal, and D. H. Bauer. 2010. Influence of potential sea level rise on societal vulnerability to hurricane storm-surge hazards, Sarasota County, Florida. Applied Geography 30 (4):490–505.
- Polsky, C., R. Neff, and B. Yarnal. 2007. Building comparable global change vulnerability assessments: the vulnerability scoping diagram. Global Environmental Change 17 (3):472–485.
- Yarnal, B. 2007. Vulnerability and all that jazz: Addressing vulnerability in New Orleans after Hurricane Katrina. Technology in Society 29 (2):249–255.
Module 12: Emergency Management Cycle for Coastal Hazards
Module 12: Emergency Management Cycle for Coastal HazardsIntroduction
We have demonstrated in previous modules just how destructive coastal hazards like storm surges and tsunamis can be. In Module 11 we focused on the vulnerability of coastal communities around the world to tsunamis and storm surges. In Module 12 we will explore the four stages of the emergency management cycle – mitigation, preparedness, response, and recovery – and examine policies related to tsunami and storm surge impacts.
Ever-greater numbers of people are migrating to coastal areas, thereby increasing exposure to these hazards. Consider these statistics – from Gaul, 2019.
- Population: In 1940 the population of the Atlantic and Gulf coasts of the U.S. was 16 million. In 2017, it was 70 million. That is more than a four-fold increase (Gaul, 2019).
- The costs of hurricane damage have escalated over recent decades as population density has increased along the coastlines of the U.S. In the past 20 years, coastal storms have cost $750 billion in damages. This is a six-fold increase from the prior two decades (Gaul, 2019).
- Seventeen of the most expensive hurricanes occurred since 2000.
- A warming ocean is fueling more intense storms, which in turn is leading to greater costs in terms of damage and human suffering.
These trends are likely to continue into the future. So the problems we have witnessed in our favorite coastal cities along the U.S. coastline in the past couple of decades are likely to increase in magnitude as the oceans warm and rise and the population of coastal cities continues to grow.
Meanwhile, over half of the United States' economic productivity is centered in the coastal zones, and almost all of these areas are vulnerable to storm surge or tsunami. Airports, too, are vulnerable: the U.S. National Climate Assessment reports that 12 of the 47 largest airports in the United States are vulnerable to storm surge hazards. During Superstorm Sandy, all three major New York area airports – LaGuardia, JFK, and Newark, NJ – experienced storm surges of up to 14 feet. The Pentagon is also well aware of the threat of sea level rise. The Naval Station in Norfolk, Virginia floods over ten times a year, a trend that will certainly get worse.
Sound coastal emergency management policies can reduce the vulnerability of residents to coastal hazards. In the case of tsunami policy, the United States is a world leader, with the nation’s public policy initiatives significantly reducing tsunami vulnerability in the United States and across the world. Coastal communities around the U.S. have recently experienced frequent and devastating flooding from storm surge. Policy addressing vulnerability to this type of coastal hazard may not be keeping pace with the climate factors behind these events. We will consider this dilemma in Module 12, among other policy questions.
After exploring the stages of the emergency management cycle, we will visit several case studies to better understand how the emergency management cycle works in real examples and to determine how policies may be improved as the threat of coastal hazards and disasters increase.
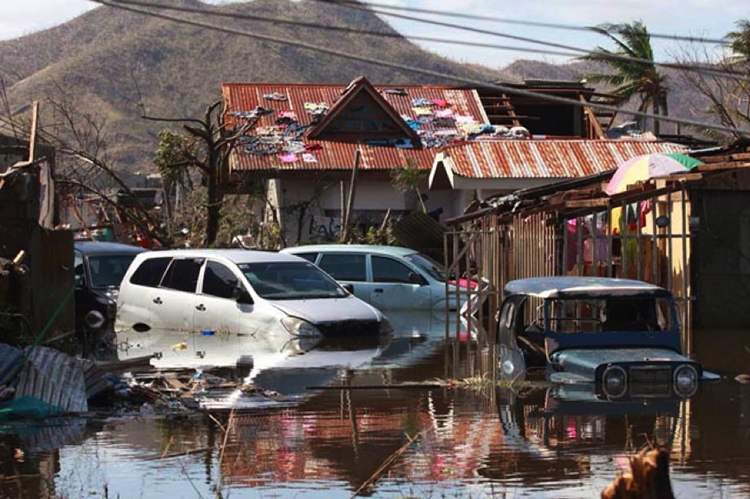

Goals and Objectives
Goals and ObjectivesStudents will assess how government and stakeholders can plan for and respond to coastal hazards.
Learning Objectives
By the end of this module, students should be able to:
- examine the stages of the disaster management cycle and its application;
- identify and compare policy options for preparing for and responding to immediate coastal hazards;
- critically assess the implementation of the emergency management cycle in real disaster case studies.
Module 12 Roadmap
| Activity Type | Assignment |
|---|---|
| To Read |
|
| To Do |
|
Questions?
If you have any questions, please use the Canvas email tool to contact the instructor.
Policy, Natural Hazards, Disasters, and the Emergency Management Cycle
Policy, Natural Hazards, Disasters, and the Emergency Management CycleLet’s go over some emergency management terminology to begin.
Policy
A policy is a principle or set of principles that guides decisions and tries to produce sensible, positive outcomes or to avoid the negative effects of some behaviors. A policy can apply to governments, businesses, other groups (such as sports teams or college courses), and even individuals. Policies are often established by governing bodies and implemented by executive officers. Many levels of government, schools, etc., have recently developed policies to help guide people through the COVID-19 pandemic.
Policies can only suggest ways for people or groups to do the right things or to avoid doing the wrong things, while rules or laws can use punishment as enforcement. We have all become familiar with the heated debates about mask-wearing during the pandemic. These arguments underline the difference between policy and rule of law.
So, tsunami and hurricane storm surge policies aim to help the public avoid or minimize harm from these natural hazards and recover quickly and efficiently from them when they strike.
Natural Hazards
Natural hazards are geophysical events that pose threats to human life or health, to the natural or built environment on which people rely for life support, and to things that people value, such as economic wealth or material possessions. Natural hazards are potentialities; that is, they have not yet happened but could occur at some time in the future.
Disasters
When a natural hazard such as a tsunami or hurricane does become active, it can trigger a disaster. Natural disasters are the major adverse human events resulting from natural hazards. Disasters are typically associated with loss of life, impaired human health, destruction of the natural and built environment, financial damage, and loss of land and possessions. The severity of the disaster is a function of the magnitude of the geophysical event coupled with the vulnerability of the people and place, which was the topic of Module 11.
Emergency Management Cycle
The emergency management cycle is used to understand appropriate human preparation for, and response to, disasters, including those resulting from a coastal hazard. The emergency management cycle can be divided into four stages: mitigation, preparedness, response, and recovery.
Mitigation
Mitigation includes all efforts that a person, household, community, or any other social unit takes to make a disaster less likely to happen or to reduce the negative effects if a natural hazard were to occur. Mitigation activities occur well before a natural hazard strikes and can be structural, such as building a seawall, or non-structural, such as developing a warning system.
Preparedness
Preparedness, in contrast to mitigation, can take place right before the natural hazard strikes. Its goal is to make sure that the individual or community knows which tools to possess and how to use those tools, what actions to undertake. The actions can also continue during the hazardous event, or immediately after disaster strikes. In preparing for a hurricane, for instance, important preparedness activities may include planning for evacuation, including knowing when to evacuate, which destination to evacuate to, and what evacuation route to take.
Response
Response is the emergency assistance that takes place during or immediately after a disaster. Its purpose is to save lives, treat injuries, and reduce property damage while meeting the most fundamental needs — water, food, shelter, and medical aid — of the people affected by the event. The response period is stressful both to emergency managers, who face limited time, information, and resources, and to the public, who face evacuation, family separation, and the loss of property and loved ones.
Recovery
Recovery is the stage during which individuals, families, communities, and governments repair and reconstruct what has been damaged by or lost in the disaster. At the same time, recovery presents an opportunity to reduce the risk of a similar catastrophe in the future – in other words, to start mitigation activities and thereby start the emergency management cycle again.
In reaction to the disaster, governments usually provide substantial resources for recovery, including economic recovery, housing recovery, and individual, family, and social recovery, and possible mitigation of potential future natural hazard events. In addition, funds and assistance come from many other sources, including non-profit organizations, faith-based organizations, and volunteers.

Mitigation
MitigationIntroduction
Mitigation involves taking action to reduce risk. Mitigation is a long-term planning activity, unlike preparedness, response, and recovery, which are more immediately part of the emergency itself. But mitigation can begin following a disaster, during recovery, to mitigate the effects of any future disaster. In the mitigation phase of the emergency management cycle, activities aimed at decreasing the likelihood of disaster or reducing its negative impacts can either be structural or non-structural. Examples of structural mitigation activities include building physical infrastructure such as sea walls or retrofitting existing buildings to withstand the hazard, or to serve as shelters. Instances of non-structural mitigation activities include developing storm surge warning systems, post-disaster recovery plans, and educational programs. Other non-structural mitigation measures include flood insurance programs (although some consider this as part of preparedness), and land use planning activities like zoning. As you can see, mitigation activities are wide-ranging and can overlap with other phases of the emergency management cycle.
Learning Check Point
Please take a few minutes to think about what you just learned and answer the question below.
Structural Mitigation
Structural MitigationConstructing levees and seawalls is probably the most obvious mitigation measure to protect a community against disaster. Seawalls can be very effective in physically impeding the progress of a tsunami and are common in tsunami-prone parts of the world, such as Japan. However, as the case of the Fukushima Daiichi disaster, which we covered in Module 11) demonstrates, cost considerations or inaccurate estimates of potential tsunami heights may result in seawalls of insufficient height to serve their intended purpose. Additionally, structures like levees require maintenance, and it was a lack of attention to the structural integrity of the levees protecting New Orleans that lead to the disaster of Katrina’s flood there.
In Module 8, we looked at the various hard structures and their designs for protecting coastlines and communities. In Module 10 we looked at smart building measures – both traditional and newly innovative. These measures are all methods for mitigation, and many have been used for centuries. The managed retreat strategies we explored in Module 9 are also considered mitigation measures.

Another structural mitigation measure is constructing or retrofitting buildings for use as shelters. As hurricane storm-surge risk zones expand as sea levels rise, so the location of existing shelters in hurricane-prone regions must be reevaluated over time. It is also important to note that tsunami shelters are only useful if a community is far enough from the tsunami source to allow sufficient warning for residents to get to the shelter. On the northeastern coast of Japan, for example, residents may have only minutes to respond between the time of the earthquake and the arrival of the tsunami.
Non-Structural Mitigation
Non-Structural MitigationWarning Systems and Community Education
Developing effective warning systems is an essential non-structural mitigation activity. Hurricane forecasts typically provide a few days’ advance notice of the potential for a hurricane affecting a particular area; While not perfect, storm surge forecasts can provide enough time for emergency managers to issue warnings. After Superstorm Sandy, a storm surge warning system was developed for the Meadowlands District in New Jersey that can provide storm surge forecast maps at least three hours in advance. When a hurricane is approaching the shoreline of the U.S. the National Hurricane Center issues regular advisories which give graphic information about storm surge, as well as estimates of the height of the storm surge for an area (form of estimates for certain stretches of coastline). Local authorities can take this information and use it to warn residents, for example, if a certain roadway is likely to flood, or if a levee is likely to be topped. Each storm is unique and, due to the many factors driving the impacts in a particular location (say, your house), storm surge forecasting is still tricky to predict on a small scale, especially because it is affected by even small changes in the landfall location as was the case in Hurricane Laura in August 2020. On a neighborhood or larger scale, the National Storm Surge Hazard Maps provide an interactive mapping tool to estimate storm surge based on the hurricane category on the Saffir-Simpson Scale.

Establishing detection and warning systems are particularly essential to tsunami policy, as we have mentioned in previous modules. After a 1946 tsunami killed 160 people in Hilo, Hawaii, and 5 in Alaska, the United States established its first tsunami warning center in Ewa Beach, Hawaii. This center, now known as the Pacific Tsunami Warning Center (PTWC), is responsible for issuing most tsunami warnings for areas bordering the Pacific Ocean. A center in Palmer, Alaska, currently known as the National Tsunami Warning Center, provides warnings for Alaska, the Pacific coast of Canada, and the Pacific coast of the continental United States.
Following the 2004 Indian Ocean tsunami, which cost hundreds of thousands of people their lives, the United States spearheaded an effort to establish regional warning systems worldwide for coastal regions vulnerable to tsunamis. Initial responsibility for managing the Indian Ocean and Caribbean Sea systems fell to the PTWC, but the Indian Ocean system is now administered by national government organizations in Australia, India, and Indonesia, while a Caribbean Sea center opens in Puerto Rico in early 2021. Together with the North Atlantic and Mediterranean Tsunami Warning System, a European partnership, these organizations provide critical early warnings for tsunami events that serve an important preparedness function for regions exposed to tsunamis. See more details about the Global Tsunami Warning and Mitigation System in the Banda Aceh Case Study in this module.
In addition to having a sophisticated warning system in place and multiple ways to communicate warnings to residents, including phone texts, email, local TV news, as well as announcements via other broadcasting methods such as mosque loudspeakers in Islamic communities, and community group messenger networks, public education about what to do when an alert is broadcast is essential. This need is articulated in the case study in this module on the 2004 Indian Ocean tsunami and its impacts in Banda Aceh, Indonesia.
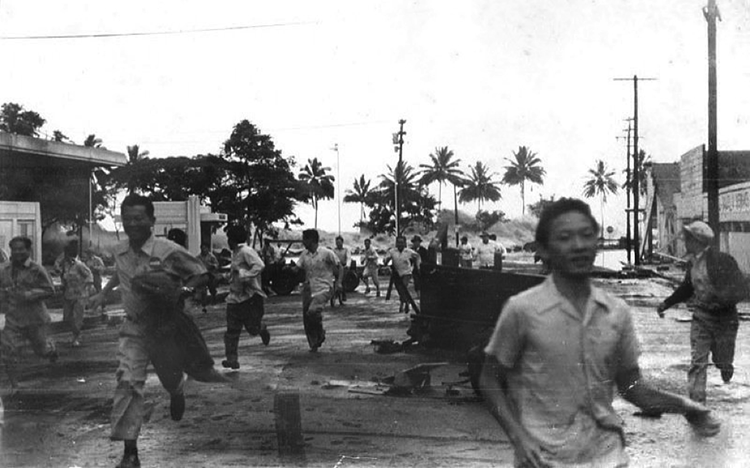
Other Non-Structural Mitigation Activities
Post-Disaster Recovery Plan
After disasters occur, the recovery process can be complex and overwhelming, so a post-disaster recovery plan is another helpful non-structural mitigation measure put in place by community-level government agencies. There are many aspects of recovery – economic, housing, environment, and social recovery – that should be considered. There are also many stakeholders who need to be involved in the recovery process. Developing a post-disaster recovery plan can identify and prioritize tasks and can recognize and engage stakeholders before an event takes place, thereby assisting recovery and minimizing chaos during a stressful time.
Zoning
Another non-structural mitigation measure is zoning. Zoning enables local or regional governments to set restrictions on the types of structures that can be built in various locations within their jurisdictions. This tool can be used to prevent critical infrastructures such as power plants and hospitals from being built in tsunami or storm surge inundation risk zones. It can also be used in conjunction with development restrictions to prevent projects that would damage natural habitats, such as mangroves, that can mitigate tsunami or hurricane damage.

Education and Outreach
As we noted above, educating the public about mitigation measures are essential so that residents know what they can do to protect themselves, their families, and their property. So, education about tsunami and storm surge planning can fall under mitigation, but it is also part of preparedness.
Mitigation Summary
Mitigation SummaryPolicies that promote mitigation are crucial to reducing the threat of disaster caused by natural hazards. In the United States, the National Tsunami Hazard Mitigation Program (NTHMP), run by NOAA in cooperation with USGS, FEMA, and the coastal U.S. states, has been developed to encourage tsunami mitigation practices. For more information, see the Tsunami Risk Reduction for the United States: A Framework for Action. NOAA also manages the Storm Ready and Tsunami Ready programs, which recognize thousands of counties, communities, universities, and other members that meet a set of mitigation and preparedness criteria. Such programs and the policies advancing them are foundational to protecting people and places from disaster.
Preparedness
PreparednessThe goal of the preparedness stage of the disaster management cycle is to enhance people's capacity to respond to natural hazards and recover from a disaster. The basis of preparedness is planning, whether that planning takes place at the household, local, state, national, or international level. Thus, policies from a local to international scale that guide sound hazard and disaster planning are essential. Emergency planning and communication of plans for their successful execution when a hazard occurs, happens at many levels of society, from the federal level down to the individual. Therefore, for organizational units including state, county, and city governments, to schools, universities, hospitals, and many other organizations, a clear plan is essential.
Insurance Challenges
Insurance ChallengesInsurance coverage for homeowners in hurricane prone areas is becoming one a major policy challenge. As it turns out both instructors have their own insuance nightmare stories to tell.
The recent and ongoing cost increases for homeowner’s and flood insurance coverage in coastal Louisiana (including metro New Orleans), coupled with collapse or relocation of some insurance companies, is negatively impacting ordinary, working people who live in the area. Dinah’s experience may be “average” compared to her neighbors, some of whom have suffered much greater heartache and loss following Hurricane Ida in 2021. Ida hit the Louisiana coast as a category 4 storm, wrecking the Gulf town of Grand Isle and leaving a wide swath of flooding and wind damage in its wake as it traveled inland. Jogging close to New Orleans, it wreaked havoc in the western suburbs of the city, leaving tens of thousands of damaged roofs, not to mention cutting power and water for weeks. Then came the insurance nightmares, playing out over the next couple of years. Dinah had a homeowner’s policy with a company that left Louisiana because of Ida’s losses. Although this insurance company did cover the cost of the repairs, including a new roof, a new homeowner’s policy had to be found. As of 2023, the cost of the new homeowner’s policy is approximately 3 times the cost of the original one at over $3,000 annually. Many families cannot afford these policies, and some go without. This results in neighborhoods sporting blue tarps for years after a storm as repairs are unaffordable for many families.
Meanwhile, flood insurance has increased steadily each year (FEMA's updated Risk Rating 2.0 is allowed to impose an 18% annual increase to existing policies). Dinah’s house is in flood zone X and does not require a flood insurance policy, but recent experiences in Louisiana mean it is wise to carry flood insurance in this location. The house is a few blocks from the Mississippi River levee and close to much lower ground and flood zone AE. Dinah’s family also has a small home in coastal Mississippi (flood zone AE), built recently and elevated to 20 feet (3 feet above the required base flood elevation). Flood insurance on this property under the new National Flood Insurance Policy is $4,000 annually. Again, this is a modest house and built with flood mitigation in mind. Other properties are much more costly to insure or are uninsurable because they do not meet minimum elevation requirements. In some cases, families use cash to purchase homes and go without insurance. It is clear as Dinah looks around and talks to neighbors that these increasing costs are having a deep impact on the housing market, changing what were previously modest neighborhoods in coastal areas into places only the wealthy can afford, and many properties are bought by companies that make rental money from them. This is happening all around the coastal areas of the U.S. and impacting millions of people.
Tim’s insurance nightmare started after hurricane Fran sent a 150 foot red oak tree onto his Chapel Hill house at 2AM on September 6th 1996. The tree caused extensive roof damage and water damage in the house. Ceilings were wrecked and carpet was damaged. He contacted his insurance companies, one of the largest insurance companies in the country, and they came out to the house within days and promised to help restore the damage. It was a shock when a letter from the adjustor arrived with estimates of what the company would pay. 54 cents a square foot for ceilings to be repaired, a few hundreds of dollars for the roof. This was insult to injury for Tim and his family who had endured to trauma of a massive tree hitting their roof followed by 10 days without power in sweltering heat.
This anecdote is sadly very common for home and business owners who have been impacted by storm damage and the situation seems to be getting worse as coastal areas have become increasingly developed and storms more devastating. In fact, insurance companies themselves have been faced with major financial losses resulting from major hurricanes. Homeowners’ premiums have risen sharply, and in several cases, insurance companies have left states such as Florida and Louisiana because business is not profitable. This leaves states in a real bind as these two videos show.
Video: Florida Faces Insurance Crisis From Hurricane Ian (7:56)
Florida Faces Insurance Crisis From Hurricane Ian
Initially, insurance carriers will come in. We'll probably have somewhere between 20 and 25 carriers ago and they'll probably set up an RVs and they will start writing checks initially that will be living expense money this will be the dollars just to help people go find a place to live sustenance dollars uh then you'll be signed up where adjusters will come and inspect the damage sounds easy but it is not so easy a real estate data company estimates 28 to 47 billion dollars in losses from that hurricane are expected it is the costliest Florida storm since Hurricane Andrew back in 1992. many hard hit by the hurricane simply don't have the insurance they're going to need to rebuild the New York Times reports in the counties whose residents were told to evacuate just 18.5 percent of homes have coverage through the national flood insurance program as our own Kerry Sanders has more on how Florida insurance companies are facing their own massive challenges they can't afford to stay in business anyone with a mortgage in a flood zone is required to carry Federal flood insurance but wind damage is covered by your homeowner's policy in Florida six insurance companies have claimed insolvency just this year homeowners complain those that are still in business here have jacked up premiums I'd say probably about a 30 increase for myself others I've seen them you know rise 50 percent 100 percent and some have just been canceled altogether Insurance Crisis in Florida the hardest hit counties in the storm's path experienced huge population booms in the last three decades joining us now to discuss Alex Harris climate change and hurricane reporter for the Miami Herald and our dear friend David Jolly a former Republican congressman from the state of Florida who is fortunately safe in Pennsylvania tonight Alex just how complicated is insurance in Florida right now is it that they are jacking their premiums or can they just not afford to stay in business given the amount of storms and damage that state faces yeah the insurance Market is really tough in Florida right now we have uh all of these companies going Belly Up and flipping their uh their clients over to Citizens our state friend insurer of Last Resort and that's stressing people out but also I mean these companies are forced to raise these rates because of things like fraudulent uh claims and assignment of benefit fraud there's a lot going on in the financial Market insurance right now and Florida isn't the only place struggling but up until this week one of the reasons we weren't struggling was that we hadn't had a storm and now we expect that to be a domino that really sets off some crisis over here and David you've been a How do you solve for this beneficiary the Florida real estate market has been hot hot hot you've got pretty LAX zoning laws there and things are built in all sorts of areas that maybe shouldn't be so how do you solve for this especially the insurance problem is it the state that you get involved these are private homes yeah it's a fascinating question Stephanie who Bears the risk of a homeowner's home ownership if you will and as Alex just mentioned the homeowners are home insurance industry in the State of Florida is really collapsing and without Federal intervention to Bear much of the loss of this storm we would further see the collapse of the homeowners insurance industry in Florida so what do you do who bears that risk the reality is in flood zones there is no private sector product to absorb the risk of a homeowner so the federal government has a national flood insurance program which in your earlier statement only 13 15 percent of of those in this in the strike zone had that that's because only 13 to 15 percent of mortgage companies required it for those those areas so do we subsidize the risk of them rebuilding that is the public policy question right should people actually be able to build in areas where we know we have had in the last five years three major hurricanes Michael Irma and now Ian should private home builders be able to build homes in those areas with the government subsidizing that risk that's a real policy question the one thing I would point out though Stephanie is when we ask questions about floods and hurricanes we also have to aggregate the risks of wildfires in the west of of ice in the Midwest of tornadoes and Tornado Alley how do we handle natural disaster risk is that truly going to be a private sector risk product or is the government going to play a role in that Communities hardest hit Alex let's talk about the communities that were hardest hit they were among the fastest growing in the state is that going to change after Ian think about all the people who moved to Florida in the last few years right Florida has seen an incredible population boom especially after the pandemic uh people really just wanted to come be in this state and Punta Gorda one of the places where the eyewall came ashore was one of the fastest growing cities in the country the last couple of years, so we've seen a massive influx which means there was a lot of people who've never experienced a storm maybe didn't realize the problems of going with the cheapest Insurance you could possibly get maybe didn't realize that they were outside a flood zone the importance of maybe just having flood insurance just in case something like this happened so we're expecting to see you know there's a lot of people that are going to be lining up asking for a lot of money from the federal government from their insurance companies from Charities there is going to be so many billions of dollars of damage here but I have no doubt like people will rebuild back here at Florida really has never learned not to build in places that are scary and dangerous and are going to get walloped year after year after year with storms we see it everywhere you mentioned Irma all those neighborhoods are full backup Mexico Beach where hurricane Michael came ashore a couple years ago all the way full again these communities people do not shy away from them after they're hit in fact they come back, and they build taller houses they build more they build more dents we are clustering our risk around the coast despite the risks of climate change and stronger storms well that is also Who doesn't evacuate because real estate development is one of the most lucrative businesses in this country that has the most in one of the most tax-friendly businesses that get hooked up by our tax code year after year David quickly before we go Florida also has one of the highest percentages of senior citizens people living with disabilities did Florida do a good enough job helping these vulnerable people in vulnerable communities evacuate they can't just hop in their cars and drive yeah listen Florida is very prepared for storms and I think the risk of life would be much greater if we did not have such an experienced infrastructure in the State of Florida uh for storms but I your question is a very good one because I got the question in the last 24 hours who doesn't leave who doesn't evacuate, and the reality is there are a lot of reasons but the most important one is those without means those without opportunity those without the communication that sometimes we take for granted municipalities make public shelters available but how do we make sure that people can get there the the economic disparity is a pressing question in moments like this and I think it's one that should be investigated coming out of Hurricane Ian leaving is a privilege we need to remember that mother nature hits the poorest communities the hardest Alex Harris thank you so much for your work really important reporting down there David Jolly I'm glad you and your family are safe [Music]
Video: Louisiana's Insurance Crisis: Homeowner's policy rates by ZIP Code (7:22)
Louisiana's Insurance Crisis: Homeowner's Policy Rates by Zip Code
The state senate is scheduled to talk about bringing homeowners insurance companies back to the state. This comes after a number of companies have either folded or left the state. The house passed two bills yesterday funding the ensure Louisiana incentive program. This program is designed to learn more insurers to the state, giving you more options and hopefully lower cost. The Senate finance committee approved the bills today. Last year many homeowners are dropped by their insurance companies or their premiums went through the group now as the legislature works on lowering homeowners insurance costs eyewitness investigator David Hammer got some exclusive data and found some very big differences and the insurance rates that homeowners pay depending on where they live yeah look for the QR code on your screen during David's story you can scan a photo of it with your mobile device that will pull up an interactive map where you can check out the rates in your zip code and compare them here's our David Hammer investigation not for sale we did a walk-in closet, and then we did darwinda cook was so proud when she finally became a homeowner in her mid-50s this was my dream she brought this house in New Orleans East when it was still damaged and rotting from Hurricane Katrina and turned it into this cozy loving home and that's your bedroom in this movie room but now three years into her dream her homeowners insurance company Americas has folded Cajun Underwriters took over the policy and Cook's insurance agent told her the premium would go from twenty-one hundred dollars to 6700 for the same level of coverage I can't even put into words how how devastating it was the agent found cook of 5300 premium by slashing her contents coverage, but that still takes her monthly mortgage payment from eight hundred dollars to more than fourteen hundred dollars now fourteen hundred dollar house no debt it's not looking good for me Louisiana had back to back devastating storm seasons in 2020 and 2021 to protect themselves from multiple disasters like that insurance companies actually buy insurance themselves it's called reinsurance and it's sold by big companies some with familiar names like Lloyd's of London, but now the cost of that reinsurance has skyrocketed some smaller insurers didn't buy enough reinsurance and went Belly Up others left the state a hundred thousand Louisiana homeowners couldn't get insurance from a private company last year they were forced to go instead to the state-run insurer of Last Resort Louisiana citizens seated premiums written 124 citizens asked Louisiana insurance commissioner Jim Donovan to approve an average rate increase Statewide of 63 percent, and he did because the rates are set by law at 10 percent higher than the highest private insurance rate in each parish and so it varies widely all across the state of Louisiana, and now we've uncovered evidence that the crisis is hitting homeowners in poorer areas even harder we got the premiums Louisiana citizens charged on 19 000 individual homeowner policies last year through a public records request we looked at only about half the policies the ones with two percent hurricane deductibles and twenty-five hundred dollar all perils deductibles and calculated the average premium paid in each zip code for every thousand dollars of insurance coverage purchased, and we found major variations across zip codes for example the average citizens policyholder in darwinda cook zip code 70127 paid 80 percent more for every thousand dollars of dwelling coverage in 2022 than someone in the Lakeview zip code 70124 where property values are significantly higher that makes no sense to cook, and I'm asking like what do you think do you know my address do you know what the darker Reds on the map are the zip codes paying 24 or more in premiums for every thousand dollars in dwelling coverage that's areas near the coast in wafush and Terrebonne parishes Eastern plaquemines parish and Shell Beach in Saint Bernard Parish but it's also New Orleans East and Kenner and the entire West Bank of Jefferson Parish 24 dollars per thousand of coverage really adds up at that rate of one hundred fifty thousand dollar house costs thirty six hundred dollars a year to insure with citizens and that's just the dwelling garages and other structures cost more now the yellows on the map are zip codes that paid less than 16 dollars per thousand on average last year including Lakeview Broadmoor and much of Uptown in downtown New Orleans and remember those are citizens rates for 2022 when citizens raised its rates 63 percent Statewide the average premium in Orleans Parish went up 82 percent meaning that 30 3 600 dollar policy will cost more than sixty five hundred when it renews in 2023. it's where New Orleans East has seen the most increases and that is more because due to open winds coming from two different ways to hit them Cook's insurance agent Stephen wavecchio shows how insurers use models to determine where the risks of storm damage are higher where unblocked winds could hit New Orleans East from the lake and the gulf for instance closer to the river we can get much better rate because the wind modeling is not as bad but Florida State University professor Charles nice says the details of the modeling process are kept secret it is a forward-looking statistical exercise in how frequent are storms how bad are they going to be how much damage and it's it's a simulation that runs thousands and thousands of times Well Vecchio also said insurance companies usually charge more for the first one hundred thousand dollars of dwelling coverage because that amount is usually enough to repair damage from storms fires and other disasters that means someone with a four or five hundred thousand dollar house pays a lower rate to cover most of their homes value than what cook pays for all 1 hundred fifty seven thousand dollars in dwelling coverage she has insurers are not allowed to consider race or income while setting rates but nice analyzed Florida data to see if the methods they use have an unintended discriminatory impact and the answer is yes we do find some statistical evidence it's yet another obstacle for cook by one this grandmother vows to overcome to keep her dream alive this is something that I want that I've always wanted, so I'm I'm not going to just you know let somebody come in and just sweep it away from me David Hammer Eyewitness News again you can check out David's story on wwltv.com and use the interactive map to see the insurance rates in your zip code and compare them with other areas of Louisiana tomorrow night at 10 in part two of not for sale David looks at how State leaders are trying to lower those rates and why some think they're missing the mark.
The National Flood Insurance Policy (NFIP)
The National Flood Insurance Policy (NFIP)If you purchase property in a flood zone, and you have a mortgage, you are required to purchase a flood insurance policy in addition to a homeowner’s policy. The National Flood Insurance Program, (NFIP) was created by legislation in 1968 and has maintained the affordability of insurance for homeowners in flood-prone (both inland and coastal) areas since then. This sounds like a great idea on the surface, but there are some problems with this policy that need to be addressed by Congress.
The NFIP was created to protect property owners in flood-prone areas from disastrous losses in the event of flooding. NFIP, which is managed by the Federal Emergency Management Administration (FEMA) is federally subsidized and kept affordable by borrowing money from the U.S. Treasury in order to keep the program solvent. It is currently in “deep water” so to speak, in fact, it is in debt to the tune of $40 billion. Climate change is complicating the picture. Because of the increase in the frequency of catastrophic flooding in the past 20 years, NFIP has become deeper in debt and in danger of lapsing coverage for property owners. For example, in 2017, many Houston residents whose property flooded in Harvey were not required to have insurance based on their flood zones. This raises further questions about how to manage flood loss in the coming years. The NFIP is no longer a sustainable way to protect property, and it is clear that changes are needed.
Also, although it was not originally intended to do so, the affordability of flood insurance through the NFIP has encouraged development in flood-prone areas, creating an even bigger problem. Homeowners have become accustomed to the availability of affordable flood insurance for their primary residences as well as their second homes on the coast, the number of which has ballooned since the NFIP first came into existence. According to a 2013 study, about one-third of all properties insured under NFIP are second homes (Gaul, 2019).
Without government subsidies insurance rates are likely to increase dramatically, so attempts to change the NFIP have so far been unsuccessful. However, FEMA is in the process of updating the NFIP with the Risk Rating 2.0 Program, which went into effect in 2021.
The overhaul is designed to help address some of the inequity issues with the NFIP and to update the process using current data and technology. New maps are replacing the older FIRM maps and properties are assessed based on their proximity to a water body as well as other features of the property. Raising your property’s height to an additional elevation above the standard base flood elevation* no longer reduces flood insurance premiums, however. You can read about these changes at FEMA: RiskRating 2.0: Equity in Action.
The 21st-century rating system, Risk Rating 2.0—Equity in Action, provides actuarially sound rates that are equitable and easy to understand. It transforms a pricing methodology that has not been updated in 50 years by leveraging improved technology and FEMA’s enhanced understanding of flood risk. (fema.gov)
Video: Defining a Property’s Unique Flood Risk (1:15)
Defining a Property's Unique Flood Risk
[Music] Flooding. It's the most common and most expensive natural disaster in the United States. And, flood risk varies no matter where you live. FEMA has spent decades investing in high-quality mapping data to help inform flood risk and set flood insurance rates. Today we're leveraging that data, along with cutting-edge technology, to get a better understanding of your property's unique flood risk and how that risk can be reflected in the cost of your insurance. FEMA will consider your home's distance to a flooding source, the type and frequency of flooding, and property characteristics, such as the cost to rebuild. With more data going into assessing your flood risk, you'll have a more complete picture of what goes into the cost of your flood insurance. We're making flood insurance fairer and easier to understand to help you protect the life you've built. Learn more about this effort and the benefits of flood insurance by visiting fema.gov forward slash NFIP transformation.
However, there is still work to be done, as in some cases flood insurance has become unaffordable. Lower-income families are having to forego insurance, placing them further at risk. The changes have the potential to change where people choose to build or buy, and the changes are also affecting the livelihood of people who live and work in communities that are flood-prone.
According to the Natural Resource Defense Council (NRDC) in It’s Time to Fix Our Water-Logged National Flood Insurance Program (nrdc.org):
Congress must act to create a means-tested flood insurance option that helps lower-income families purchase flood insurance, and that prioritizes those same families for flood adaptation assistance. (nrdc.org)

More on Flood Insurance Rate Maps and Base Flood Elevation
Flood Insurance Rate Maps are used to determine a property’s flood insurance. A potential homeowner can access these maps before deciding to purchase property in a flood zone. The maps are also designed to help residents of coastal communities plan for and mitigate the flood risk to their properties by delineating flood zones and identifying Base Flood Elevations (BFE). The BFE is the height to which a location has a 1% annual chance of being flooded. A house must be built at or above the BFE to be eligible for flood insurance.
The FIRM zones are based on elevation and proximity to water, as well as several other factors that determine a property’s risk of flooding. Visit this site to read about the flood zones shown on a Flood Insurance Rate Map (FIRM).
Emergency Operation Plans
Emergency Operation PlansFor state and local governments as well as entities such as hospitals, universities, and school districts, developing Emergency Operation Plans (EOPs) is a vital task. An EOP helps everyone who is involved in the disaster management cycle know what he or she should do from the point at which a natural hazard threatens to strike, all the way to the final recovery from the ensuing disaster. It explains who will do what, when, with what resources, and by what authority. Included in these responsibilities is the need to transmit hazard preparedness information and last-minute hazard information to the public. In the response period, when time is in short supply and everyone – from the highest government official to individual householders – is under stress, an EOP helps people respond appropriately and use resources efficiently. See an example of part of an EOP in Box 1.
Box 1: An example of an Emergency Operation Plans (EOP)
Brunswick County is located on the Atlantic coast of North Carolina and is often assaulted by hurricanes. It suffered several direct hits from hurricanes in the 1990s and most recently received a direct strike from category 2 Hurricane Arthur in July 2014. In response to this annual threat, the county in 2008 developed a long and detailed Emergency Operations Plan (EOP) for multiple hazards, including an annex designed specifically for hurricanes.
Presented here are modified excerpts of the hurricane annex to help you understand what an EOP looks like. The first part of this example defines Operating Conditions, or OPCONs, that trigger emergency management actions. There are 5 OPCONs: OPCON 5, Hurricane Season; OPCON 4, Alert; OPCON 3, Stand-by; OPCON 2, Preparation; and OPCON 1, Evacuation. The second part of the example lists important actions to take during the OPCON 2 Preparation phase.
OPERATING CONDITIONS (OPCONs)
The Control and Support Groups will be located in the Brunswick County Emergency Operations Center (EOC) at the Brunswick County Government Center. In the event that it becomes necessary to move the groups to an alternate EOC, the new location will be announced.
OPCON Triggers: To ensure that all activated personnel in the county have a coordinated hurricane response activities approach, the following OPCON levels will be utilized throughout the event.
- OPCON 5: Hurricane Season
This OPCON indicates that hurricane season is open. Brunswick County will stay at OPCON 5 as of June 1st, the start of the hurricane season. At this time, all hurricane plans and procedures should be reviewed. Alert Rosters should be updated and verified. Storms will be monitored and tracked at this level. - OPCON 4: Alert
If the Brunswick County Emergency Management Director determines that a storm could possibly threaten Brunswick County, the County will be moved to OPCON 4. The primary events that will take place at this level are the notification of key personnel of the threat, and initiation of preparatory activities. The EOC (Emergency Operation Center) will not be activated at this stage. - OPCON 3: Stand-By
Once the Brunswick County Emergency Management Director has sufficient information that a storm poses a significant threat, the County will move to OPCON 3. This decision will be based on each of the storm’s specific characteristics. The EOC will be activated at this level, either at a partial or full status. The primary events that will occur include discussing evacuation and conducting pre-evacuation conferences and other preparatory activities. - OPCON 2: Preparation
Once a decision is made to recommend a Voluntary Evacuation or Mandatory Evacuation, the OPCON level will automatically move to OPCON 2. The EOC will be under Full Activation at this level. At this level, shelters will be prepared for opening. Public notification will be coordinated and press conferences coordinated. It is understood that once the County moves to OPCON 2, the County is prepared to commit substantial amounts of money and resources to the effort. - OPCON 1: Evacuation
Once a Voluntary Evacuation or Mandatory Evacuation order is announced to the public, the OPCON automatically moves to OPCON 1. At this level, the primary activity will be the evacuation of the vulnerable population. The EOC will remain at full activation throughout the evacuation and landfall.
EMERGENCY SERVICES
- Manage the EOC Operations in accordance with the Brunswick County EOP.
- Notify the following agencies of the current situation:
a. EOC Operations Personnel
b. North Carolina Emergency Management EOC
c. National Weather Service, Wilmington
d. County Administration / Elected Officials
e. Municipalities
f. Utilities and other stakeholders
g. Adjoining County Emergency Management Divisions - Monitor the weather situation.
- Be available for media interviews and press conferences.
- Install Variable Message Signs at designated locations.
- Begin monitoring traffic patterns and prepare to adjust traffic signals, as appropriate.
- Prepare to implement the traffic assistance plan.
- Complete the establishment of the Amateur Radio Network.
- Position equipment to support evacuation.
- Take appropriate actions to protect critical Brunswick County facilities.
- Coordinate for the movement and/or protection of Fire/EMS equipment during the storm’s impact.
- Assist with status information concerning Law Enforcement Management.
- Prepare to open shelters.
- Coordinate with the PIO for a press release once the evacuation decision is announced.
- Prepare to open Special Medical Needs Shelters if needed. Coordinate with the PIO for a press release once the evacuation decision is announced.
- Position resources to assist with the management of the evacuation traffic. Resources must be in place prior to the start of the voluntary relocation.
- Prepare to conduct “evacuation warning” in the evacuation zones, within the unincorporated portions of the county.
- Implement the security plan in the evacuated areas.
Educating the Public about Tsunami and Storm Surge Preparedness and Warning Systems
Educating the Public about Tsunami and Storm Surge Preparedness and Warning SystemsEducating the public about the existence of warning systems, how they work, and how to react when it is activated are essential components of the preparation.
Tsunami Warning and Public Readiness
In the parts of the United States' most vulnerable to tsunamis – that is, the coastal zones of Hawaii, Alaska, Washington, Oregon, and California – this primarily takes the form of evacuation planning. Anyone driving through low-lying coastal areas of these states is likely to notice tsunami hazard zone and tsunami evacuation route signs lining the roads, and warning signs in beachside hotels and motels.

The National Weather Service’s Tsunami Ready website provides a wealth of guidance for the public about what readiness for a tsunami involves and how to achieve it. Communities can organize tsunami ready training through the NWS program with the goal of achieving community-wide tsunami readiness.
Residents and visitors on the Oregon coast have several location-specific tools to use to learn about tsunami risk in their area and to receive messages about tsunami threats. The State of Oregon Department of Geology and Mineral Resources Oregon Tsunami Clearinghouse is a web site where you can go to get detailed evacuation maps, smartphone apps to aid evacuation, and an interactive evacuation zone map viewer at NVS Tsunami Evacuation Zones.
Learning Check Point
Hurricane Storm Surge Warnings and Public Readiness
When a hurricane is approaching the United States and threatens to make landfall, Emergency Operation Plans go into action in the areas likely to be affected. As we mentioned above in the mitigation section, forecasting local storm surge levels can be challenging as it depends on several factors, including the track of the storm, exact landfall location, the timing of the tide cycle, water depth, and the angle and slope of the shoreline, complicating accurate predictions. This, in turn, affects preparation communication.
Therefore, hurricane preparation in a community that may receive a storm surge must start well before the magnitude of the threat is certain for that location. Evacuation orders should be made 72 hours in advance of a storm’s landfall. Many mandatory evacuations have been communicated to the public, only to see the path of the hurricane turn elsewhere. This means that city or county leaders must decide several days out to close schools and businesses, mobilize transportation for those without, prepare shelters, etc. Additionally, all communities within the “cone of uncertainty” of forecast tracks based on modeling, must be on alert and be making preparations. A storm’s track can change significantly during the approach, depending on the steering factors. Hurricane Sally in September 2020 is a good example. Greater New Orleans and Southeastern Louisiana were under a hurricane warning and evacuations and preparation well underway but within 36 hours of landfall, the track moved significantly to the east, so that Mississippi, Alabama, and western Florida received the brunt of the storm surge effects and hurricane warnings were downgraded to tropical storm warnings in New Orleans. Residents of the storm-aware Gulf coast must stay vigilant for these kinds of changes in the forecast.
On a family level, preparedness begins with making a hurricane supply kit (see below) and making a plan for the event of a hurricane. Within 72 hours of landfall, multitudes of decisions must be made, and actions taken. A very abbreviated list of things to be considered in a coastal community threatened by storm surge is: Securing or moving all moveable/ floatable items to a safe place; Securing boats in dock; fueling and moving vehicles, boats, trailers, etc. out of harm’s way; securing the house, by boarding up windows or closing hurricane shutters, and turning off water and power; planning evacuation route and accommodation while away; and communicating with neighbors and family members to ensure everyone has a way to evacuate and a place to go.
Information driving preparedness is broadcast in many ways. A resident in a storm surge zone can best track the storm via local TV news stations and weathercasts to find details about the storm’s impacts in their community. These are often pushed as notifications to mobile devices. The National Hurricane Center provides many kinds of useful graphics that are updated every 4 hours. Mobile Apps are available to access this information too.

Challenges with Communicating Emergency Plans
Challenges with Communicating Emergency PlansIt is easy to recognize the importance of communicating emergency plans to the public, but many problems can occur in the process. In reality, when emergency information is sent out by a city or state governmental entity, some people will not receive this information, or they may not respond appropriately to it. For example, if the information is broadcast only in English, then non-English speakers in the United States may not fully understand the messages. Poor households in developing countries may not have radios, televisions, smartphones, or other devices needed to receive the information.
Due to many factors (cultural, language, economic, psychological, and social), some people who do receive and understand the government’s communications will choose not to heed warnings and follow instructions given by the government. In the case of Hurricane Katrina, many long-time New Orleans residents chose to stay in New Orleans despite dire evacuation warnings. Among many reasons used for not evacuating, some included: financial constraints on their ability to evacuate the city (typically lack of transportation and no funds for traveling); frequency of hurricane evacuation warnings in recent years (evacuation fatigue); misconceptions about the severity of the storm; perceptions that they were not vulnerable to hurricane risks; worries about leaving pets; and concerns about the need to protect their property from criminal activity.
In many communities in the U.S. and elsewhere in the world, cross-cultural communication has been adopted to ensure all residents receive important messages for preparation for hazardous events. Cross-cultural communication recognizes the diversity of target populations in terms of language and culture, and emergency managers must take these factors into account so that messages are broadcast in the multiple languages spoken in the community in question. Using multiple media platforms and methods for disseminating messages is also essential. The technology available to many people such as texting and social media has helped greatly in recent years. Traditional media like television, radio, newspapers, the Internet, and printed flyers are still important, but other ways of communicating, such as through multiple social media platforms, have become more and more important. Modern communication tends to depend heavily on the mobile or cellular telephone network. In cyclone and tsunami conditions, communication towers can be toppled and rendered useless. In 2005, when cellphone use was common, but texting was less common, loss of communication was an enormous problem across the Gulf Coast following Hurricane Katrina, rendering cellphones useless and greatly hampering search and rescue and preventing people from locating loved ones.
Learning Check Point
Please take a minute to answer the question below. It will not be graded, but it may help you on the Module Summative Assessment.
Creating an Emergency Supply Kit
Creating an Emergency Supply KitThe Department of Homeland Security’s website: Ready gives guidance to Americans on readiness for all types of emergencies. The section focusing on hurricane preparedness includes this engaging video to catch the viewer’s attention.
Please watch the following short video on hurricane preparedness from Ready - Hurricanes.
Video: When the Waves Swell (1:30)
When the Waves Swell
Narrator: When the waves swell, the wind blows, and rain starts to pour you'll ask yourself, how prepared or unprepared are you? Did you board your windows? Protect you home? Secure loose objects so they won't blow away? Bring large items in, and low items up? If you're properly prepared it will help in a big way. Does your family have a plan? Do they know what to do? Is your emergency kit packed waiting by the door for you? Just because you're not on the coast doesn't mean you're okay. Heavy winds and flooding can wash things away. When a hurricane is near, you need to stay safe. Turn on the radio, wait for updates. Only leave your home if told so. Grab your bag and go, go, go. Now if you're home and the heavy wind blows, get away from the windows. Watch out for flooding and protect yourself. You may be without power for a couple days, but your emergency kit should help you to stay. Once the storm is gone and it is safe to go home, be cautious of what's going on. If water is in your path you have to turn back. Dangerous electricity and things you can't see can hurt you very badly. So before the waves swell, the wind blows, and rain starts to pour get prepared. Make a plan, and protect yourself each and every way. America's PrepareAthon. Be smart. Take Part. Prepare. Get started today. Go to ready.gov/prepare

A basic emergency supply kit suggested by ready.gov includes the following recommended items to prepare in case of evacuation:
- Water, one gallon of water per person per day for at least three days, for drinking and sanitation
- Food, at least a three-day supply of non-perishable food
- Battery-powered or hand-crank radio and NOAA Weather Radio with tone alert and extra batteries for both
- Flashlight and extra batteries
- First aid kit
- Whistle to signal for help
- Dust mask to help filter contaminated air and plastic sheeting and duct tape to shelter-in-place
- Moist towelettes, garbage bags, and plastic ties for personal sanitation
- Wrench or pliers to turn off utilities
- Manual can opener
- Paper local maps
- Cell phone with chargers, inverter, or solar charger
I am adding a couple of items to this list from the article in the Tampa Bay Times linked below:
- Camping equipment – Sleeping bags, pillows, and propane stove
- Plenty of cash to tide you over a period of no power for digital payment transactions
- Prescription medications and medical records if health conditions warrant
- Personal documents such as government ID, passport, birth certificate (latter should be stored in a dry box in a safe place if not included in evacuation kit)
Emergency Supply List
Building an emergency supply kit is an important hurricane preparedness activity. Go to Ready and find a document called Emergency Supply List. This is a list that helps you build an emergency supply kit. The document identifies recommended basic items and additional items for adding to the kit. Answer the questions below, identifying the items listed either as a “basic item” or an “additional item” based on this document.
Learning Check Point
Check all that apply for each question
Additional Emergency Preparation Considerations
Additional Emergency Preparation ConsiderationsExample of Community Hurricane Preparation – Tampa Bay Times
Tampa Bay Times provides readers with very thorough guidance on hurricane preparation:
- Hurricane 2019: The gear you need to stay safe - and comfortable - for the storm
- Hurricane 2020: Protect your home, business, documents, and photos
These two articles cover hurricane preparation – including protecting property and preparing for evacuation. The article covering protecting homes and businesses makes some very important points relevant to any hurricane season, but particularly relevant to 2020, with the extra complication of the COVID-19 pandemic. It emphasizes the importance of planning ahead and making preparations such as purchasing supplies for securing homes and businesses (generators, plywood, storage bins, etc.) early in the hurricane season, and not waiting until a storm threatens.
It also details important tips on storing important documents in waterproof containers ready for evacuation and having a supply of prescription medications on hand for the event of a long period without pharmacy service. The importance of these details may easily be overlooked until the event. Many New Orleanians can attest to this, having neglected to prepare ahead of time and protect essential documents like birth certificates and medical records, which had to be replaced after Katrina. Another really important tip is to have cash on hand. Without power, normal methods of card payment and bank ATM machines and the like do not work. Without cell phone service and power, the ability to access information and to do online banking and shopping is severely curtailed.
In addition, the importance of preparing digital copies of important documents cannot be overemphasized. But this also brings up the importance of taking care of computers and other digital devices and office equipment. File backup onto portable hard drives is essential and once this is completed, if a storm is threatening your area, desktop computers, larger devices, and machines should be powered down and unplugged. All valuables should be moved to the highest points of homes, such as upstairs, if possible. Tablets, phones, etc. should also be backed up but they should be included in the to-go list. It’s important to remember that although you hope you will be able to return in a couple of days after evacuation, this may not be possible. So, preparing for at least one week is important. After Hurricane Katrina, most New Orleans residents could not return for 6 weeks or longer and returned only to survey destroyed properties.
Learning Check Point
This activity will not be graded, but the Module Summative Assessment requires you to have the skills and knowledge it applies. Please take a few minutes to think about what you just learned and answer the questions below.
Summary: Preparedness
Summary: PreparednessIn short, policies that encourage emergency planning, including effective communication of warnings and evacuations, are foundational to protecting people and places from the ravages of tsunamis and hurricane storm surge.
Response
ResponseResponse policies guide actions undertaken during and in the immediate aftermath of a tsunami, storm surge, or other natural hazard events. The most immediate response is activating warning systems, evacuating residents, and activating the emergency plan (if there is one available). With sufficient warning time, it may also be possible to pre-position personnel and supplies that will be needed for recovery efforts in areas adjacent to those likely to be affected by the tsunami or storm surge.
Immediately following the passing of the hazard event, the scope of the disaster becomes evident, and response activities expand considerably. It is important for governmental staff and others to follow their assigned responsibilities according to the EOP. For emergency managers, the most urgent need is search and rescue. Locating victims and providing medical treatment needs to be accomplished as quickly as possible. Search and rescue teams also may be responsible for addressing dangerous conditions left in the aftermath of the disaster, such as dangling live wires and gas leaks. The emergency needs to be assessed and updated regularly as new information becomes available and the situation on the ground changes.


Overcoming Response Challenges
Overcoming Response ChallengesWhile many people and organizations are eager to help in search and rescue activities, numerous challenges occur during this tense period. For example, volunteers from outside the area might have a hard time locating victims or knowing the most urgent needs of local people or communities. Using real-time tools can help address this issue. Disaster victims and other local people should be encouraged to use Twitter, Facebook, or other social media to post search and rescue information. The GPS locations of these social media posts can then be used to create real-time crisis maps, which can help inform rescue personnel which areas to concentrate on. Lack of coordination among organizations from both inside and outside the locale might also occur, and this can waste valuable time – for example, by searching the same place several times for victims. To address this problem, large-scale disasters need an operations office to coordinate the rescue teams. An example of the challenges of search and rescue during the response to Hurricane Katrina is shown in Box 2, taken directly from the White House archives.

Box 2: Search and rescue in the Hurricane Katrina disaster
Critical Challenge: Search and Rescue
After Hurricane Katrina made landfall, rising floodwaters in New Orleans stranded thousands on rooftops, requiring a massive civil search and rescue operation. The Coast Guard, FEMA Urban Search and Rescue (US&R) Task Forces, and DOD forces, in concert with State and local emergency responders from across the country, courageously combined to rescue tens of thousands of people. With extraordinary ingenuity and tenacity, Federal, State, and local emergency responders plucked people from rooftops while avoiding urban hazards not normally encountered during a waterborne rescue.
Yet many of these courageous lifesavers were put at unnecessary risk by a structure that failed to support them effectively. The overall search and rescue effort demonstrated the need for greater coordination between US&R, the Coast Guard, and military responders who, because of their very different missions, train and operate in very different ways. For example, Urban Search and Rescue (US&R) teams had a particularly challenging situation since they are neither trained nor equipped to perform water rescue. Thus, they could not immediately rescue people trapped by the floodwaters.
Furthermore, lacking an integrated search and rescue incident command, the various agencies were unable to effectively coordinate their operations. This meant that multiple rescue teams were sent to the same areas while leaving others uncovered. When successful rescues were made, there was no formal direction on where to take those rescued. Too often, rescuers had to leave victims at drop-off points and landing zones that had insufficient logistics, medical, and communications resources, such as atop the I-10 cloverleaf near the Superdome.
Lessons Learned
The Department of Homeland Security should lead an interagency review of current policies and procedures to ensure the effective integration of all Federal search and rescue assets during disaster response.
Credit: Whitehouse Archives
As the tsunami or storm surge disaster unfolds, emergency workers need to help make sure survivors have access to water, food, shelter, medical care, and sanitation. Depending on the scale and location of the disaster, each of these needs may present significant logistical challenges. People displaced from their homes have no access to these essential needs, and even families whose homes were not destroyed may not have water (due to contamination or pipeline disruption) or food (due to supply chain interruption and loss of refrigeration from electricity outages). The number of injured may exceed the capacity of existing medical care facilities, and those facilities themselves may be damaged, destroyed, or without power in the wake of a tsunami or storm surge. Damage to water and sewage infrastructure may also create a risk of outbreaks of diseases such as cholera, which emphasizes the need for repairing critical infrastructure as quickly as possible.

Response Examples from 2020: Hurricane Laura in S.W. Louisiana
Response Examples from 2020: Hurricane Laura in S.W. LouisianaIn the early hours of August 27, 2020, Hurricane Laura made landfall as a category 4 storm on the coast of Southwestern Louisiana, near the Texas border. This coastal area is sparsely populated, with the town of Cameron (population around 400) close to the shoreline and in the direct path. The industrial city of Lake Charles (population 80,000+) sits just 30 miles inland across flat, marshy terrain with direct water connections to the Gulf. Laura hit Lake Charles almost directly, packing winds of close to 150 miles per hour and leaving a path of destruction. Lake Charles and neighboring Westlake are home to several oil refineries and chemical plants. Oil refineries must be shut down with the approach of a storm to prevent hazardous results such as explosions, fires, and leaks. A chlorine manufacturing plant did catch fire and leak gases into the air. Laura’s storm surge was predicted to be up to 20 feet, and the warnings used words like “unsurvivable” to try to convince coastal residents to heed the evacuation warnings. It appears that: 1. Most residents did heed the warnings, and 2. Laura’s measured surge did not reach the predicted height at landfall.
NOAA’s water level gauges available on the site: NOAA Tides and Currents - Inundation Dashboard registered close to 10 feet at Calcasieu Pass. There were no operable gauges immediately east 0f the Calcasieu Pass gauge, so the actual maximum storm surge will be determined by analyzing high-water marks using field methods. This will probably reveal higher water levels to the east of the eye of the hurricane. There have been no drowning deaths reported to date, although 14 deaths have been attributed to Laura, with 8 of those due to carbon monoxide poisoning when gas-powered electrical generators were used in closed spaces. An additional 4 deaths were attributed to falling trees. There is no doubt that it could have been worse, but many harrowing tales are emerging. Perhaps the most vivid have been told by the fishermen who stayed with their boats sheltering in the bayous near Lake Charles, connected to Calcasieu Pass. These seasoned watermen feared for their lives and helped each other survive as they watched boats come apart and sink, even as they sat in port. Amazingly, everyone survived. Meanwhile, thousands of families evacuated ahead of the storm, heeding the mandatory evacuation orders.
Due to the COVID-19 pandemic, which has hit Louisiana hard, the state provided a system by which evacuees were provided shelter in hotel rooms, rather than congregate settings of traditional shelters. Baton Rouge and New Orleans were the two main destinations. In New Orleans, evacuees, some arriving by state-chartered buses, and others in private vehicles, had to register at a central location before being assigned a room. Phone and text numbers were made available to obtain information. Electronic message boards on the I-10 entering New Orleans displayed a number to call for assistance. By Monday after Hurricane Laura’s Thursday landfall, all rooms were filled, with more than the 9,000-person capacity in New Orleans having been reached. Other people found shelter with relatives, friends, or found their own accommodation elsewhere.
It is worth noting here that Louisiana’s emergency planning and response has had plenty of practice in recent years. In our case studies, we look at the aftermath of Hurricane Katrina, almost exactly 15 years before Laura. In September 2005, Hurricane Rita also hit the same communities as Laura did 15 years later. Not only have the state, parish, and municipal government Emergency Operation Plans been refined and developed over these years, but the residents of coastal Louisiana have lots of experience in planning and response on a personal and family level. This does not diminish the trauma and hardship felt when displaced from your home, not knowing if it has been destroyed or not.
In addition to helping people get out of the way of a major hurricane, what does the immediate response look like when the state EOP is put into practice? The first step is to mobilize first responders from around the state to perform search and rescue in the affected communities. This includes many units, including fire-fighters, EMS and other medical personnel, and state agencies such as the Department of Wildlife and Fisheries, with boats, aircraft, and helicopters available. On a federal level, the National Guard and the Coast Guard are deployed. In addition, non-governmental organizations including the Red Cross are on the ground to distribute needed supplies to survivors.
Typically, the hurricane leaves large areas without power. This is highly predictable, so power companies deploy personnel before the storm makes landfall and stage thousands of trucks and linemen from within the state and neighboring states to secure electrical lines and begin repairing them as soon as the storm has passed. In addition, other infrastructure such as water supply and sewerage must be repaired before a community is livable again.
Private citizens also participate in the search and rescue operations, with Louisiana’s fleet of private boats pressed into service by the now-famous “Cajun Navy”, who made their debut in 2016 after the devastating floods in Baton Rouge and assisted in Houston after Hurricane Harvey’s floods in 2017. Private citizens can also help by making donations of needed items and money to charities assisting those affected by the storm. The importance of charitable and non-profit organizations at these times cannot be overstated, as it takes time for government funds and relief to be released.
Cultural Norms and Religious Laws
Cultural Norms and Religious LawsAs in the preparedness phase of the emergency management cycle, emergency managers, rescue team members, and medical service providers must be sensitive to the cultural norms and religious laws of the victims to avoid adding further stress during disaster response. For instance, some cultures require unmarried men and women to live separately, so disaster emergency staff could create significant trauma by asking men and women to stay in the same quarters. Emergency workers could also cause stress if they provided pork products to strict Muslim or Orthodox Jewish victims, whose religions strictly forbid the consumption of pork. Racial and ethnic issues might also come into play during disaster response. Emergency shelters also need to be sensitive when sheltering people of different races and ethnicities. In these and other potentially difficult cultural and social circumstances, emergency managers, staff, and volunteers must be ready to coordinate among people with varying backgrounds, needs, and expectations.
Summary: Response
Summary: ResponseIn sum, all disaster responses require coordination, cooperation, and cultural sensitivity, but the complexity of, and challenges presented by, the response effort increases significantly with the size of the disaster. The case of the 2004 Indian Ocean tsunami – one of the greatest disasters of all time, with an enormous, unprecedented response required of the international community to address a disaster that affected numerous developing countries with varying languages, cultures, religions, and levels of development – demonstrates this complexity. Emergency response policies at all scales need to recognize and account for complexity.
Recovery
RecoveryIn the recovery phase of the emergency management cycle, policymakers aim to repair, reconstruct, and restore what has been lost during a disaster. Recovery policies and activities also ideally aim to reduce future vulnerability to natural hazards, so that renewal might result in a physical and socio-economic environment that looks and functions somewhat different when compared to the original community. This is where recovery and mitigation may overlap in the cycle. During recovery, for example, city planning experts may call for rethinking how a community wiped out by a storm surge or tsunami is designed so that it has greater resilience than the original. Rebuilding employing methods designed so that the buildings can better withstand a storm surge – such as elevating the buildings above base flood elevation - would be the simplest example. Moving buildings to a safer location is also an option. There are many other details and considerations that can be incorporated, some of which were discussed in the Managed Retreat and Smart Building modules of the course. Consensus is recently being reached that building back communities exactly as they were is not the wisest path to take.
Funding Recovery
Funding RecoveryEffective recovery requires financial resources, usually in the form of cash or loans. Cash can come from a variety of sources, depending on the context and circumstances of a particular disaster. The local and national governments of affected countries are typically the first source of funds. In some countries, including the U.S., there are funds reserved for disasters but – particularly in poorer countries – funding available from these sources may be insufficient to cover a large disaster or multiple smaller disasters.
Donations of various kinds are a second major source of funds, particularly in major international disasters, such as the 2004 Indian Ocean tsunami or the 2011 Tohoku earthquake and tsunami in Japan. Donations can come from other governments (as in the case of the United States Agency for International Development’s efforts in countries affected by the Indian Ocean tsunami), from non-profit, non-governmental organizations like the International Red Cross/Red Crescent, from direct donations by private citizens and businesses, and from various other sources. Insurance payouts are a third source of funding for recovery.
Individuals and businesses in developed countries are often required by governments and lenders to carry insurance, but insurance is far less common in developing countries. In those countries, loans typically make up the remainder of recovery funds. These loans are often offered by major international financial institutions, particularly the World Bank and the International Monetary Fund. Such loans are sometimes controversial because they usually come with political and economic strings attached that policymakers and citizens of recipient countries dislike. These lending institutions played a major role in financing recovery in nations affected by the Indian Ocean tsunami. In summary, internal government transfers, donations, insurance, and loans typically provide local governments, institutions, emergency managers, and private citizens with needed financial resources to pay for recovery.
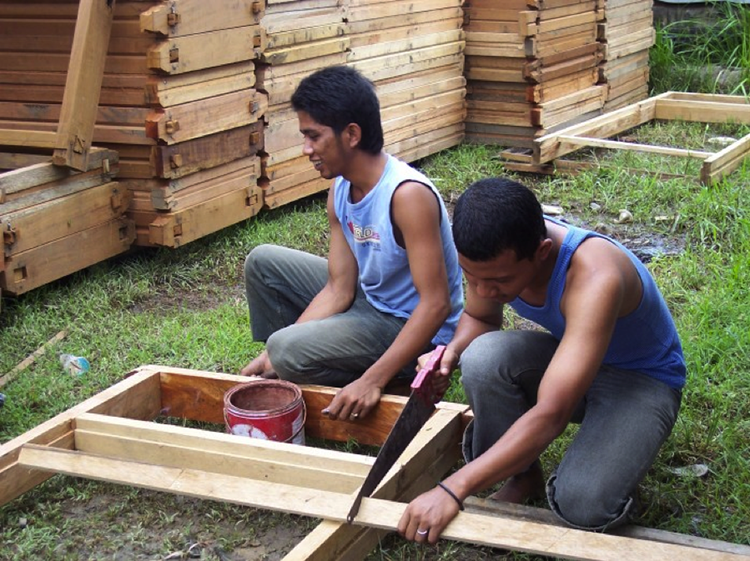
Reconstruction of Basic Infrastructure and Buildings
Reconstruction of Basic Infrastructure and BuildingsTsunamis and storm surges are tremendously destructive to the built environment of coastal communities, and the aftermath is overwhelming as houses and businesses are wrecked and infrastructure is crippled. Restoring basic infrastructure is the first line of business after the water recedes. This includes restoring water, sewerage, roads, electricity, and telecommunications. The funds come from a combination of local government funds, utility company coffers, and state and national government aid. Local government funds rely on property and business tax receipts, but if much of the tax base has been destroyed in the disaster, then sufficient local funds for rebuilding infrastructure cannot be sustained. Consequently, in most cases, funds for the reconstruction of water, sewer, and roads must come from state and national government aid.
The task of rebuilding homes and businesses – all the buildings damaged by the event also must be funded and typically, building reconstruction is funded with a combination of insurance payouts, government aid, and other funds from private and non-profit sources. For private homeowners, this is a very stressful and often expensive process and can take a great deal of time, during which your family may need to be living elsewhere. As we have noted in Module 11, it is a process that proves much easier for people with strong economical means and can be very hard for people who have few resources.
Ideally, rebuilding should not be done in a business-as-usual way, using the same locations and with construction techniques led to damage in the initial disaster. However, meeting higher standards and building in a different, safer location can be expensive. Following a hurricane disaster in the United States, insurance payouts and government aid are contingent on rebuilding houses with hurricane-resistant designs to reduce future hurricane risk. This can include elevating the house to a new level required for insurance coverage and using materials and methods that make the building more resistant to hurricane damage.
After Hurricanes Katrina and Rita in Louisiana in 2005 many homeowners were unable to rebuild to the new standards and had to move to different communities further inland. Communities such as Cameron, Louisiana, which was devastated by Hurricane Laura in 2020 had only 400 residents at the time. The census data show that Cameron’s population diminished by 79% between the years 2000 and 2010 during which it was impacted by Hurricanes Rita and Ike. Another phenomenon is the change in demographics in certain communities over time after multiple storms impact them. For example, Grand Isle, Louisiana, Dauphin Island, Alabama, and other barrier island and beach communities which were home to modest fishing camps and year-round housing prior to the multiple storm events that have occurred over the past few decades, now boast many more very large, expensive structures belonging to wealthy business-people or corporations. They are now often rented for short-term vacations. This trend has changed who can enjoy coastal areas.
The photo below shows a typical elevated, storm surge-resistant house in Charleston, South Carolina. The first floor of the house is designed not for living, but instead for parking, storage, and building access. Special construction designs, like elevated slab and elevated crawlspaces, and use of non-water-sensitive materials, are also important. Eventually, all buildings in storm surge-prone locations of the United States will be replaced by similar surge-resistant designs.


The Complex Nature of Community Recovery
The Complex Nature of Community RecoveryThere are many other aspects of recovery besides the reconstruction of infrastructure and buildings. Economic recovery is obviously vital because a strong local economy can help residents recover more quickly than a weak economy. At the same time, social and psychological recovery must be emphasized and not overlooked. Every aspect of peoples’ lives are disrupted by disaster, and many people suffer from psychological issues such as PTSD in post-disaster situations. The stress of the recovery process, including financial strain, separation of families, and other stressors can have very negative effects on a community.
Environmental recovery is also fundamental because the natural environment provides essential ecosystem services, so recovery cannot be complete without a healthy environment. Storm surge can cause severe environmental damage as many spills occur as a result, including overflows of sewerage treatment plants, oil and gas storage facilities, and wells, among others. After Katrina, whole neighborhoods near New Orleans were contaminated with petroleum from a refinery. These types of environmental impacts take a great deal of time to resolve. Additionally, agriculture and fisheries in an area impacted by a storm surge or tsunami can be devastated.
The combination of infrastructure, building, economic, environmental, and social recovery demands input from many stakeholders. For example, building recovery plans require input from local planning departments, homeowner associations, contractors, utility companies, and many others. As a result, it is important to adopt policies that identify stakeholders in building recovery – as well as in economic recovery, environmental recovery, and socio-psychological recovery – and ask them to join with government actors to participate in creating a post-disaster recovery plan during the mitigation phase of the emergency management cycle.
Expanding on these ideas about recovery, a hurricane-related disaster can have tremendous impacts on a local economy. For example, although Hurricane Charley in 2004 brought no significant storm surge, the storm’s category 4 winds severely affected the City of Punta Gorda, Florida. Many of the buildings in the downtown area were destroyed. The unemployment rate for the city rose 2.2 percent in the following month, and it took more than a year for the unemployment rate to return to pre-disaster levels. Thus, coastal disasters are huge drains on local economies and – if the scale of the disaster is big enough, as in the cases of Hurricane Katrina and Superstorm Sandy – on national economies, at least in the short- to medium-term (see case studies).
In the business sector, industries that are affected by a coastal disaster are often specific to the country and locality, but typically include at least some combination of tourism, health care, agriculture, fishing, and manufacturing. In 2020, Hurricane Laura ruined sugar cane and rice crops, killed hundreds of cattle, and sank fishing boats in southwest Louisiana. Farmers and fishermen have a long road to recovery after these types of impacts.
Tsunamis, hurricane storm surge, and other coastal hazards can destroy important tourist and health care infrastructure, including hotels, restaurants, and eldercare facilities. Recovery of the tourism and healthcare sectors is a priority for many coastal local governments. The health care sector is particularly important in many coastal communities of the southern United States, which have a high proportion of elderly residents that have retired from colder climates to warmer beach communities.
Environmental Recovery
Environmental RecoveryThe environment provides many services to humans and wildlife, and our lives are intricately linked with our environment. So, when a major disturbance to the environment occurs, such as a tsunami or storm surge, the natural environment – the natural ecosystems - in the affected area can be severely impacted, and the ecosystem services may be destroyed or disrupted. For tsunami and especially hurricane protection, coastal ecosystems like mangroves, barrier islands, wetlands, and coral reefs can absorb and reduce wave energy and water height, thereby protecting the land from erosion, but at the same time, they can sustain heavy damage from the energy of the water. For these and many other reasons, environmental recovery and restoration are important elements of disaster recovery. Some of the examples of environmental restoration after tsunami and storm surge disasters include beach and sand dune restoration, wetland restoration, and water and soil protection, and recovery. Other environmental recovery activities include the restoration of urban forests, habitat recovery for wildlife, and debris recycling.

An example of the importance of coastal ecosystem services and the damage caused by hurricane storm surge can be found in Louisiana at the time of Hurricane Katrina. The US Geological Survey estimated that a loss of more than 200 square miles of coastal wetlands was attributed to Katrina’s storm surge in Louisiana, an area representing approximately eight times the annual land loss rate already taking place (remember a football field of land on the Mississippi delta disappears every 100 minutes, so this is a lot of land!). The protection and economic benefits afforded coastal communities in Louisiana by these fragile and rapidly declining ecosystems were already well documented and recognized by the state. Following Katrina’s devastation, the state stepped up its existing coastal restoration program, creating a new State Coastal Master Plan and a new state agency to oversee and monitor restoration activities. As a result of devoting a new level of human and monetary resources, today Louisiana is a world leader in the science and engineering of coastal restoration and protection.

Other forms of environmental damage that must be remediated after a disaster include spills and other kinds of pollution resulting from the destructive forces of tsunamis and storm surges. The article The Indian Ocean Tsunami and its Environmental Impacts outlines environmental impacts from the 2004 tsunami.
Psychological and Social Recovery
Psychological and Social RecoveryFinally, recovery is not complete without psychological and social recovery. After a disaster, many people suffer from post-traumatic stress disorder or PTSD. Among other symptoms, people with disaster-related PTSD can relive the hazard event repeatedly, feel in danger constantly, have difficulty sleeping, and refuse to return to places associated with the disaster. Victims’ psychological well-being and social life can therefore be severely affected by PTSD. As a result, PTSD and other psychological conditions of victims must be addressed as part of recovery. Social recovery is critical, too. Loss of jobs can lead to migration away from a community, and deaths of key community figures can change social dynamics. Although there is little that responsible organizations can do to directly influence these outcomes, it is important to be aware of these impacts in recovery efforts. Cultural recovery efforts, such as the rebuilding of religious landmarks and institutions, also improve the overall recovery.
Summary: Recovery
Summary: RecoveryIn conclusion, it is important to note that the recovery period provides governments and emergency managers with a special opportunity to develop a more disaster-resilient society. Many of the older buildings with dated building codes and outmoded infrastructure have been destroyed, and people have become more aware of the risks associated with natural hazards. Thus, policies that mitigate by updating building codes, replacing obsolete infrastructure, and developing hazard-conscious land-use plans in the recovery phase will face fewer obstacles. At the same time, families will be more willing to mitigate by purchasing insurance and engaging in household preparedness activities.
Learning Check Point
Learning Check PointPlease take a few minutes to think about what you just learned then answer the questions below.
Case Study: Sumatra and Thailand and the 2004 Tsunami
Case Study: Sumatra and Thailand and the 2004 TsunamiThe Importance of Tsunami Warning Systems and the challenges of warning communication.
Think back to the video you watched in Module 7 – which included scenes of the 2004 tsunami event in Indonesia. The beginning of the video focused on the Banda Aceh area of Sumatra, where fishing communities and small coastal cities were completely destroyed, and the end of the video featured the Phuket area, where more tourist beaches were affected.
Through your reading and watching the videos, you hopefully gained an idea of what it is like to be caught in a tsunami with no advanced warning, and how frantic the attempts to get out of the way must be. Imagine what it would be like to try to move small children, sick or elderly people out of the way of a tsunami with before the wave strikes and with no time to spare!
In Module 7, the events in Phuket, Thailand, are described, with tourists enjoying their vacation on the beach at Christmas 2004. Many are oblivious to the dangers of the approaching tsunami. What could have been done differently? If this were to happen again, would these communities be better informed and prepared?
In Module 7 we also mentioned that early warning systems are very tricky because of the challenges of getting the message out soon enough after the earthquake and before the tsunami waves arrive at a particular shoreline. For example, the towns on the west coast of Sumatra are so close to the Andaman fault that they had almost no time to react, so a warning may not have worked, regardless of how well it was transmitted. Banda Aceh, on the northern tip of Sumatra, was devastated in 2004 because people did not have time to react, while there is evidence that some small nearby island communities fared better where traditional knowledge of the natural warning signs such as the sudden receding of the tidal waters was employed, and residents were able to flee to higher ground. Meanwhile, the tourist destinations of Phuket and Phi Phi, and nearby locations in Thailand had 2 hours, but the warnings were lacking. Visitors lacked necessary knowledge of nature’s warning signs and how to react, and may not have felt the earthquake, so many lives were lost.
In response to the enormous loss of life in the 2004 Indian Ocean tsunami, the Global Tsunami Warning and Mitigation System was put in place. The Indian Ocean tsunami warning system now integrates the signals from seismographs and DART Buoys and transmits data to 26 national centers. Warnings at the local level are generated in the form of SMS messages, mosque loudspeakers, sirens, and other methods to warn citizens. How well the warnings translate into lives saved due to rapid response and appropriate behaviors by the citizens depends on each step working properly. The failure of one of the steps can lead to disaster. If the citizens do not have the knowledge needed to take effective action, then the process will not work, and lives will be lost.
In 2012 another earthquake occurred near Banda Aceh in the Indian Ocean, so the newly implemented warning systems were put to the test. In this case, no tsunami was generated by the earthquake, but unfortunately, the weaknesses in the system were revealed. Despite the efforts expended to increase levels of tsunami preparedness since 2004, including new tsunami evacuation shelters and education programs, chaos ensued. Hearing the tsunami warning, people panicked and tried to flee by car, resulting in gridlock on the roads. It was clear that better guidance from the local government was needed, including clear evacuation route signage and regular drills. For more detail on this topic, read the National Geographic article Will Indonesia Be Ready for the Next Tsunami? Clearly, more work is still needed and ongoing to address these weaknesses.


Learning Check Point
We will spend a few minutes also revisiting the accounts of historic tsunami events – in particular, the 1960 event and its effects in Chile and Hilo, Hawaii, and the important messages about how to survive a tsunami. Please re-read some of the accounts of survival during tsunami events in Heed Natural Warnings.
Case Study: Puerto Rico and Hurricane Maria
Case Study: Puerto Rico and Hurricane MariaDifferential response and recovery times across U.S. communities hit by 2017 storms
The 2017 Atlantic hurricane season went down in history as having the most named storms since 2005. In 2005 there were 28 named storms and 15 of them becoming hurricanes, while in 2017 there were 17 named storms and 10 of these became hurricanes. The three most notable out of these storms – Harvey (landfall on August 25 in Texas), Irma (Landfall September 10 in Florida) and Maria, (Landfall on September 20 in Puerto Rico) followed in close succession and broke records for their intensity in the places they impacted.
The U.S. federal government, represented by FEMA, responded by supplying funds, aid, supplies, and personnel following the storm impacts in each of these places, but there were many concerns raised about the disparity in response after Maria in Puerto Rico, a U.S. territory, compared to the mainland states impacted by Irma and Harvey. So, what really happened following Hurricane Maria in Puerto Rico? Were the Puerto Rican people, who are American citizens, neglected by the federal government following this major natural disaster? Let’s take a closer look at the impacts of and responses to Hurricane Maria in Puerto Rico.
Maria achieved its peak intensity over the eastern Caribbean and made landfall in Yabucao, southeastern Puerto Rico as a strong category 4 storm, where winds of 175 mph (280 km/h) were recorded. It was the first Category 4 hurricane to directly impact the island in 85 years, and it caused widespread damage that was felt for months, if not years.
Prior to Maria’s landfall, hundreds of shelters were set up, and evacuation orders were given. An uptick in travel from the island just before the storm was indicative of the numbers of people fleeing to the U.S. mainland to stay with family.
Compounding the impacts of Maria on the island was the damage from Category 5 Hurricane Irma just 2 weeks prior, especially to the electrical grid, which was crippled by Maria, leaving all 3.4 million residents without electricity for an extended period. Six months after the storm, many were still without power and had not been able to repair their houses. In fact, the combined impacts of hurricanes Irma and Maria resulted in Puerto Rico Electrical Power Authority (PREPA) filing for bankruptcy. Imagine all the functions that are impossible without power, besides the misery of living in a tropical climate without any means to refrigerate food or enjoy air-conditioning. All means of modern communication are impossible because cell phone towers are one of the first things to be destroyed by the high winds of a major storm.

The number of people killed by Hurricane Maria proved challenging to count. An initial number of 65 deaths directly attributable to the storm was officially recorded by the federal government. This number did not account for those whose deaths were from indirect causes linked to the hurricane, due to deprivation caused by things like lack of power and medical services and a multitude of other causes during the response and recovery phases. Six months after Maria’s landfall, an estimate of 2,975 indirect deaths was made by examining the mortality rate for that time period compared to the same period during previous years. The sensitive populations – the elderly, the very young, and the sick - suffer the most in the immediate aftermath of a disaster like a hurricane, and it is among these groups that the most deaths occurred in Maria.

Residents of the U.S. territory were able to apply for aid through FEMA, but reports indicated that supplies moved slowly to destinations, hampering recovery. In November 2017, two months after the storm, 60% were still without power and perhaps 20% without water, so that many had to collect water from streams and rainwater. Many stories in the media at the six-month mark highlighted the misery of a slow recovery. There was a lack of adequate infrastructure repair, medical services, and the simple availability of supplies throughout this time, although many charity organizations supported the effort.
An objective study by BMJ Global Health: Quantifying inequities in US federal response to hurricane disaster in Texas and Florida compared with Puerto Rico, investigated the question of whether the federal response to Hurricane Maria in Puerto Rico was significantly smaller and slower than the responses to Hurricane Irma in Florida and Hurricane Harvey in Texas. Their conclusion was that the response to Maria was indeed lacking and did not align with the storm severity or the needs of the affected communities. They note that,
“Increases in mortality and adverse health outcomes due to differentiated disaster response and recovery efforts may promote inequity among populations that receive less aid.”
In other words, Puerto Rico did not receive the same level of aid as Texas and Florida after Harvey and Irma respectively, and the people of Puerto Rico suffered as a result. They go on to suggest reasons for this in this way:
“There may be many different reasons why the federal response varied in each case. Ability to access the affected area based on geography and distance, existing infrastructure aiding or acting as barriers to response efforts, disaster fatigue, as well as issues of racial bias and perceptions of differential citizenship all may have affected the appropriation and delivery of resources and funding to affected areas in each hurricane. Different mechanisms for the varied responses may be more or less justified. However, what cannot be contested is that the responses were in fact different across critical time points, and these differences have serious consequences for acute and long-term health outcomes and recovery efforts.”
The data in the report clearly show a disparity in the amount of aid received and the time taken for aid to be received. This article highlights the critical nature of getting aid to its target in a timely manner. Slow responses lead to serious negative outcomes, as Puerto Rican residents can attest. Be sure to read Echoes of Katrina: Post-Maria Public Health Threats and Trauma.
Case Study: New Orleans and Katrina
Case Study: New Orleans and KatrinaKatrina in New Orleans - Economic Recovery Case Study
Hurricane Katrina in 2005 was a precursor to many similar events to come, and has become a yardstick by which to measure other storms impacting the U.S. since then. Katrina was and still is the deadliest and costliest storm to make landfall in the United States in 100 years. Hurricanes Harvey and Maria follow closely behind in costs and loss of life. Katrina impacted coastal communities in five Gulf Coast states - Florida, Alabama, Mississippi, Louisiana, and Texas. The greatest impacts were felt in Louisiana and Mississippi, while the greatest media attention focused on New Orleans. Katrina’s death toll was approximately 1,500 in Louisiana alone. The economic impacts were complex and enormous. If measured by insurance claims alone, the disaster generated more than 1.7 million claims across six states, to a total of more than $40 billion. Estimates of the overall economic impact of the storm in the Gulf states put the damage at approximately $200 billion!
The New Orleans economy is based on three main sectors: tourism, port operations, and educational services (Monthly Labor Review, 2007). All these sectors were essentially shut down after the storm for several months, and up to years in some cases. Many operations did not fully recover until a full year after the storm. The University of New Orleans and all other schools were closed except for online learning for the fall semester or longer. The Port of New Orleans is essential to the nation, as the Port of South Louisiana (of which New Orleans port is a component) handles the most bulk tonnage of any port in the world. About 5,000 ships from nearly 60 countries dock at the Port of New Orleans each year (Monthly Labor Review, 2007). The tourism service industry, for which New Orleans is best known, is the major employer in the city and, of course, that was also shut down for many months after Katrina. So, as well as being displaced, many New Orleans residents lost their source of income until the city could recover sufficiently, which took years.
These examples do not tell the whole story of a complex natural disaster such as Hurricane Katrina. Some have described it as a man-made disaster because of the failure of the flood control system surrounding the city of New Orleans, much of which sits at below sea level elevations. Meanwhile, a short distance away, unprotected coastal communities on the Louisiana and Mississippi coasts were also devastated. Some areas were never rebuilt, but most have been rebuilt, and this rebuilding has been a complex process driven by economic resources. Insurance payments; federally funded programs such as the Road Home Program, as well as people, organizations, and companies willing to invest in rebuilding the city all contributed to the patchwork of means by which the region recovered, house by house, neighborhood by neighborhood.
View the following image: a summary of the changes in population in the Greater New Orleans area in the eight years following Hurricane Katrina from The Times-Picayune.

Recovery by the numbers since Hurricane Katrina
Population metro area
Orleans Parish
| Year | Population |
|---|---|
| 2005 | 455.188 |
| 2006 | 198,893 |
| 2007 | 267,658 |
| 2008 | 305,336 |
| 2009 | 327,883 |
| 2010 | 343,829 |
| 2011 | 256,512 |
| 2012 | 369,250 |
Jefferson
| Year | Population |
|---|---|
| 2005 | 451,652 |
| 2006 | 418,908 |
| 2007 | 423,410 |
| 2008 | 432,017 |
| 2009 | 433,168 |
| 2010 | 432,552 |
| 2011 | 432,029 |
| 2012 | 433,676 |
St. Tammany
| Year | Population |
|---|---|
| 2005 | 217,407 |
| 2006 | 223,062 |
| 2007 | 226,315 |
| 2008 | 229,384 |
| 2009 | 231,498 |
| 2010 | 233,740 |
| 2011 | 236,915 |
| 2012 | 239,453 |
St. Bernard
| Year | Population |
|---|---|
| 2005 | 64,951 |
| 2006 | 11,133 |
| 2007 | 26,727 |
| 2008 | 32,032 |
| 2009 | 33,670 |
| 2010 | 35,897 |
| 2011 | 37,540 |
| 2012 | 41,635 |
St. Charles
| Year | Population |
|---|---|
| 2005 | 50,116 |
| 2006 | 54,338 |
| 2007 | 54,257 |
| 2008 | 54,063 |
| 2009 | 53,527 |
| 2010 | 52,780 |
| 2011 | 51,367 |
| 2012 | 52,681 |
St. John the Baptist
| Year | Population |
|---|---|
| 2005 | 45,597 |
| 2006 | 48,556 |
| 2007 | 48,494 |
| 2008 | 47,679 |
| 2009 | 46,956 |
| 2010 | 45,924 |
| 2011 | 44,896 |
| 2012 | 44,758 |
Plaquemines
| Year | Population |
|---|---|
| 2005 | 28,549 |
| 2006 | 18,150 |
| 2007 | 23,190 |
| 2008 | 23,391 |
| 2009 | 23,010 |
| 2010 | 23,042 |
| 2011 | 23,394 |
| 2012 | 23,921 |
Unemployment
| Year | Unemployment in New Orleans Metro Area | Unemployment in the U.S. |
|---|---|---|
| 2005 | 5.3% | 5.0% |
| 2006 | 3.9% | 4.7% |
| 2007 | 3.8% | 4.7% |
| 2008 | 4.5% | 5.8% |
| 2009 | 7.2% | 9.5% |
| 2010 | 7.8% | 9.5% |
| 2011 | 7.7% | 9.0% |
| 2012 | 7.3% | 8.2% |
Addresses Receiving Mail by Parrish
| Parish | Pre-Katrina Mail | 2013 mail | Total Change |
|---|---|---|---|
| Orleans | 198,232 | 174,566 | -11.9% |
| Jefferson | 187,612 | 184,291 | -1.8% |
| St. Tammany | 83,467 | 95,452 | +14.4% |
| St. Bernard | 25,604 | 15,769 | -38.4% |
| St. Charles | 14,847 | 16,527 | +11.3% |
| St. John the Baptist | 14,555 | 15,938 | +9.5% |
| Plaquemines | 8,439 | 8,164 | -3.3% |
Longer-term Recovery and Mitigation Experiences for a Socially Vulnerable Community
Longer-term Recovery and Mitigation Experiences for a Socially Vulnerable CommunityThe response to Katrina was inadequate and in retrospect revealed a need for improvements to all levels of emergency planning – from evacuation to caring for the vulnerable, to providing for equitable recovery – and more. Today we look back on Katrina as an example of poor disaster planning and New Orleans as a city with very low adaptive capacity at the time. Why was the response so poor, and how have things changed since then? Is the Gulf Coast and New Orleans in particular, better prepared for a major storm, and has it increased its adaptive capacity? In other words, have each component of the emergency management cycle – mitigation, preparation, response, and recovery been addressed to ensure another "Katrina experience" does not happen?
Immediately after Katrina broke the flood defenses of the city, with 80% of the city underwater and a crippled infrastructure, New Orleans had to be completely evacuated. Those who could not or did not evacuate ahead of the storm were temporarily trapped in a hellish scenario for days before an organized response could evacuate everyone. People were gathered at the New Orleans Superdome, Convention Center, and New Orleans International Airport where conditions were deplorable. Triage and evacuation centers were set up in locations that were above water in the flooded city and those rescued from the flood were processed and transported out. It was a chaotic and sometimes violent situation. The temperatures were in the 90’s Fahrenheit and there was no power at all. There was a deep level of suffering and trauma as families were separated and individuals sent far away from home to places where they had no family or friends. Many older people who were in poor health succumbed to the heat, lack of food and water, and extremely poor sanitation. Many did not know the fate of their family members and communication was almost impossible with all cell towers having been toppled. It was obvious to even a casual observer that the majority of the stranded citizens were disadvantaged by poverty and most were African American.
The introductory video in Module 11 showed some of the immediate aftermath of Katrina.

Even though the flood itself affected 80% of the city in a way that crossed socio-economic boundaries and did not discriminate, some of the lowest-lying areas were also the areas where there was more poverty so that the disadvantaged residents of the city were significantly more likely to be displaced by the flooding than those with greater wealth.
A great deal of attention was given by the press to the poor, predominantly African American neighborhood of New Orleans, the Lower Ninth Ward. This area was flooded by a break in the floodwall of the Inner Harbor (Industrial) Canal, a shipping canal that cuts through the heart of the city and at that time (incredibly) was directly connected to the Gulf of Mexico via the Intracoastal Waterway and The Mississippi River Gulf Outlet and Lake Borgne. The flood wall was broken by the force of the water, and a loose barge pushed its way through. Water poured through the break, washing houses off their foundations, and drowning many residents. To this day, fifteen years after Katrina, many blocks of this neighborhood still sit vacant after houses had to be demolished and families were unable to return and rebuild. This is even with organizations such as Brad Pitt’s Make it Right Foundation pouring money into rebuilding and trying to “make it right” for the local residents. This can be considered a forced relocation by a natural disaster.
It was the aftermath of the flood and the recovery process that really shone a spotlight on the disparity of fortune. The suffering did not end when the floodwaters were finally pumped out of the saucer-shaped city, against the force of gravity - this “dewatering” took most of the month after the flood. Nobody could return until the infrastructure – power, water, sewage, etc. was functioning well enough to make it minimally livable, and as the city slowly reopened, people who could return found their houses completely wrecked and their neighborhoods almost unrecognizable. Those lacking financial resources, could not get back to the city for months or even more than a year. Families had to find ways of making a living wherever they had landed after the flood. People with stronger financial resources were able to return and take care of the myriad tasks of recovery much more easily than those in poverty. This and other factors and financial obstacles meant that it was the wealthier neighborhoods that were rebuilt more quickly than the poorer neighborhoods.
Please watch this 9.54 minute CBS Sunday Morning video: “New Orleans After Katrina: A Tale of Two Cities” that examines the inequity of the rebuilding process in which it is mentioned that black homeowners were more than 3 times more likely than white homeowners to have lost their home in the flooding and that the Road Home Program, the state’s policy for funding rebuilding through grants to homeowners, was found to be discriminatory. The flaw in the policy was that it used the home’s value before the storm to determine the amount the homeowner received. So, the homes of much lower value in poorer, predominantly black neighborhoods such as the Lower Ninth Ward, were eligible for significantly less funding for rebuilding, failing to meet rebuilding costs.
Video: New Orleans after Katrina: A tale of two cities (9:54)
New Orleans after Katrina: A tale of two cities
NARRATOR: As if we needed reminding, even after 10 years, how terrible Katrina really was, and what a colossal fiasco.
YOUNG GIRL: We are going to die out here if they do not send somebody out here right now.
NARRATOR: The horror show at the Superdome. Close to 25,000 people were trapped there for days in the heat and stink.
WOMAN 1: We need to feed our babies. We need to give our babies some water.
[INTERPOSING VOICES]
NARRATOR: Thousands more baked on overpasses along the interstate.
WOMAN 2: This man jumped to his death because he just couldn't take it anymore.
NARRATOR: More than 1,800 people died across the Gulf Coast. How could this be happening in the United States of America? Who seemed more out of touch-- President Bush or FEMA director Mike Brown?
GEORGE BUSH: And Brownie, you're doing a heck of a job.
NARRATOR: New Orleans mayor Ray Nagin let loose on a radio broadcast.
RAY NAGIN: Now get off your asses and let's do something, and let's fix the biggest [BLEEP] damn crisis in the history of this country.
NARRATOR: 80% of New Orleans was flooded. Billions and billions of gallons of water swept over the city, not so much because of the storm itself, but because the levees gave way. The floodwalls broke.
GARY RIVLIN: Being there in those first months, it felt like, am I witnessing the death of a great American city?
NARRATOR: Gary Rivlin covered Katrina for the New York Times. His new book, Katrina:After the Flood, has just been published by CBS-owned Simon & Schuster.
GARY RIVLIN: People talk about Katrina being an equal opportunity storm. Didn't make a difference if you were black or white, rich or poor, but it wasn't exactly an equal storm. If you were a black homeowner, you were more than three times more likely to have lost your home in the flooding than if you were a white homeowner. And just like it wasn't an equal opportunity storm, it has not been an equal opportunity recovery.
This was one of the first things I saw when I came into Lakeview for the first time, and there was a mound 10 stories high of debris. And I just remember pulling to the side stunned, and I just began to weep.
NARRATOR: Connie Udo's house a few blocks away looked like this after Katrina. When the water finally drained away, what had been her middle class overwhelmingly white neighborhood looked like this.
CONNIE UDO: We were fortunate because my home is a triplex. Because we lived on the second and third floor, we didn't lose everything.
NARRATOR: After moving six times, Udo, her husband, and two children dared to go home in January 2006, four months after the storm.
CONNIE UDO: It was a very sad place to be. As long as I was in my house, I was OK. When I walked outside, I would feel myself just kind of slide. And got to the point where I told my husband I don't think I can do this. And so he said, you know, I think you have to find a purpose.
NARRATOR: A few months later, the former tennis teacher had become a combination Angie's List and Mr. Clean, a whirlwind running the St. Paul's Homecoming Center. Her job-- connecting people to resources, marshaling volunteers to get her Lakeview neighbors back in their houses.
CONNIE UDO: I realized we were in a fight for our life to save our neighborhood, to save our city.
NARRATOR: How did you go about this assault on the storm?
CONNIE UDO: Do not wait for the government-- that became our motto. People would say, well, I'm going to wait for this. I'm going to wait for my-- the government's going to do this, right? I was like, no, I don't think so. The government didn't even show up when we were stranded at the Dome for five days. Why do you think they're going to show up to help guide our schools, churches, and businesses? Why do you think that? We need to do this.
This is one of our success stories, actually.
NARRATOR: And they did, Connie Udo's organization and others. There are reminders of Katrina. The high water line is immortalized at Starbucks, but Lakeview is back. A supermarket opened in 2010. The St. Paul's Homecoming Center has moved on.
[MARCHING BAND PLAYING]
In New Orleans, happy or sad, you dance to the music. And yesterday on the actual anniversary of Katrina, people danced in the Lower Ninth Ward, where the most damage was done. This is what it looks like still. Almost entirely African-American before the storm, only 37% of its pre-Katrina residents have returned.
Brad Pitt's Make It Right and other charities have built hundreds of homes, but thousands were destroyed. The closest thing to a grocery store opened last year. More on that later.
BETTY BELLE: And this was the front door.
NARRATOR: Someone else's roof was on top of Betty Belle's house when the retired social worker finally was allowed back for a look a month after Katrina. The city demolished it.
BETTY BELLE: You know, I just tried to be strong and not let it really affect me too much because I don't want to run my blood sugar up.
NARRATOR: Her insurance settlement, nowhere nearly enough to rebuild. The bank took most of it to pay off her mortgage, anyway.
BETTY BELLE: This was the bathroom.
NARRATOR: Construction is about to start on Betty Belle's lot, but it's taken 10 years of fighting and the intervention of a local advocacy group to get her barely enough money for a house one third the size of her old one.
BETTY BELLE: It's not what I had, but at least I'm getting something. And it took a long time to get to this point.
NARRATOR: For Belle, the problem was Road Home, Louisiana's nearly $10 billion federally-funded program intended to bridge the gap to provide homeowners enough money to rebuild. For many, many Katrina victims, it ended up a bureaucratic nightmare, a symbol of incompetence, but for residents of African-American neighborhoods such as the Lower Ninth Ward it was a symbol of something else-- discrimination. Road Home based its payment formula on the value of a property before Katrina.
In New Orleans, historically, homes in African-American neighborhoods have been valued significantly lower than similar homes in white neighborhoods. Never mind that construction costs are the same regardless.
GARY RIVLIN: It was just a fundamental flaw in the program. In fact, it's not just me saying that. A federal judge ended up concluding that the Road Home program did in fact discriminate against black homeowners.
It's not that they were not made aware that it was not a good policy. Myself and others personally appealed to the powers to be to not use that policy.
NARRATOR: One of the city's most prominent African-American leaders, Alden McDonald, heads Liberty Bank and Trust Company. After Katrina, his headquarters, his branches, and his own home were all devastated, but he managed to keep the bank open.
ALDEN MCDONALD(VOICEOVER): We're Louisiana made, Louisiana proud at Liberty Bank.
NARRATOR: And has in the past 10 years built it into one of the largest minority-owned banks in the United States, but this speaks volumes. The Liberty Bank building in African-American New Orleans East marooned, surrounded by what was a million square foot mall before Katrina.
ALDEN MCDONALD: When I take a look at what happened and what didn't happen, you could see that the ability of money helped communities to rebuild faster and bigger and to do things that perhaps the African-American community with less wealth was not able to do.
MITCH LANDRIEU: We're ready. Nearly 10 years after Katrina, we're no longer recovering. We're not rebuilding. Now we're creating.
NARRATOR: The current mayor, Mitch Landrieu, likes to talk about a new New Orleans.
[JAZZ MUSIC]
All you have to do is look around. The Superdome rebuilt, a new state of the art hospital, new schools. A new $14.5 billion flood protection system reduces. It doesn't eliminate the risk of catastrophic flooding. The tourists have returned, but nearly 100,000 African-American New Orleanians gone.
[CLARINET MUSIC]
The new New Orleans looks familiar but may never quite be the Big Easy again.
[CLARINET MUSIC]
MAN: Only in New Orleans!

Geographer Richard Campanella, in his book Geographies of New Orleans, addresses the question, were poor, black neighborhoods impacted by flooding more than more affluent white neighborhoods, due to the fact that the poor tend to occupy the lower, less desirable land areas? His analysis showed, through mapping the demographics and the levels of flooding together, that the answer is more complex than you may expect. He looked at the distribution of ethnic groups, distribution of flooded land, and the length of time an area remained flooded after Katrina. If only the city of New Orleans itself is considered (and not the suburbs), his data shows that the pre-Katrina population consisted of 67% African American and 28% white, while 76% of persistently flooded properties were of African American families, 20% were of white families. So African American neighborhoods did suffer greater persistent flooding. The maps below illustrate the complex nature of the distribution of social vulnerability in relation to the more intense flooding. The neighborhoods of Gentilly, New Orleans East, the Lower 9th ward, Chalmette, and Lakeview experienced the deepest floodwaters. The distribution of wealth and poverty in these communities is complex, with New Orleans East, the Lower 9th Ward, and Gentilly being predominantly black neighborhoods, while Lakeview is an affluent, mostly white part of the city. Chalmette is a mostly white suburb of mixed-income.


So, in summary, Hurricane Katrina negatively affected the poorer citizens of the city, who were represented heavily by the African American community, more than the affluent members of the community. The poor are the most vulnerable citizens due to their sensitivity. They are also the least resilient, having lower levels of adaptive capacity, due almost entirely to a lack of financial resources. Without the incredible generosity of non-profit and non-governmental organizations, faith-based groups, and volunteers, many people would never have been able to return home. In addition, insurance payments, various federally funded programs such as the Road Home Program, and the migration to the area of people and companies willing to invest in rebuilding all contributed to the recovery of New Orleans house by house, neighborhood by neighborhood.
Would New Orleans fare better if another “Katrina” hit the city? Many improvements have been made. Preparedness and response, including evacuation plans with transportation for those without a vehicle, and response plans are all greatly improved. The city’s overall adaptive capacity and resilience have made strides and the economy of the city has stabilized, but poverty is still a major problem for the city. The system of engineering structures, designed to protect the city from a surge from - up to category 3 level “100-year" (1% chance in a given year) storm, has been rebuilt and greatly improved. But projections indicate that this system will deteriorate over time and it is very expensive to maintain. New Orleans may be in a good position at this time if a category 3 hurricane were to hit the city. But there are too many variables to say for sure what the outcomes would be in terms of long-term recovery in the future or for a larger storm. For example, an event with precipitation of the magnitude of Hurricane Harvey would quite likely prove to be equally devastating to New Orleans as Katrina.
New Orleans - One Decade of Recovery: 2005 - 2015
New Orleans - One Decade of Recovery: 2005 - 2015What has happened since Katrina?
The process of recovery from a major disaster such as the flooding of New Orleans by Hurricane Katrina is long and complex. Today, the city functions normally again, bearing scars in the form of hundreds of large empty lots, a smaller population, and many examples of increased resilience. Lessons can and should be learned and applied to other disasters, such as Houston's flooding in 2017 by Hurricane Harvey.
The article, Building Back the Big Easy: Lessons from New Orleans’ Recovery from Hurricane Katrina, provides an overview of the changes that have taken place in the city of New Orleans through the eyes of an outside observer with a background in urban resilience and disaster risk management. Artessa Saldivar-Sali is a Resilience Engineering Specialist, World Bank. The article outlines several aspects of the recovery process, including the rebuilding of neighborhoods worst hit by the flooding, and repairs to the vital infrastructure that drives the economy. It also points to the changes in disaster management and the improvements in the flood defenses surrounding the city, including a surge barrier that is the largest of its kind in the world, and raising of the 133 miles of levees that surround the entire city.
Shortly after Hurricane Katrina, there was much debate about the wisdom of rebuilding New Orleans and the vision of what New Orleans would look like ten or twenty years later was elusive. The article, New Orleans, Louisiana Population 2020, from the World Population Review website, examines the demographic changes in the decade following Katrina. It outlines the steady growth in population since Hurricane Katrina literally emptied the city of every single resident and killed 1,500 in southern Louisiana. In 2006, the population was only 223,000, down from the 2000 census level of 484,000. In the decade following, the population steadily grew back to a level of 343,800 in 2010 and 391,495 in 2016.
When Hurricane Isaac approached New Orleans in 2012, the city’s residents were advised not to evacuate as the repairs to the hurricane protection system were complete. This was sound advice at that time and for that particular storm, which flooded communities on the outside of the levees. For those who know New Orleans now, with its rebuilt levees, rising housing prices, and seeming amnesia – reminders about the struggle to rebuild are important. It may also be helpful to keep an awareness of the continued vulnerability of the lowest-lying city in the U.S. and most of the world.

Learning Check Point
Houston, Harvey, and Flood Policy
Houston, Harvey, and Flood PolicyHouston’s topography and geography make it a very flood-prone city, as much of it sits in a sprawling floodplain. A glance at a map of Houston reveals a network of waterways – bayous - connected to the tidal water of Trinity and Galveston Bays. As the Washington Post video linked below explains, Houston is more at risk for rainfall and runoff flooding than storm surge flooding from the Gulf of Mexico, although the latter is not out of the question. The other factor that makes Houston vulnerable to flooding is its urban sprawl. The Houston Metropolitan area has more than 6 million residents, and its population is increasing. It has seen a six-fold increase in population since 1960. The lack of comprehensive planning and zoning during those decades has led to a loss of natural, permeable surfaces and a growing propensity for flooded neighborhoods. As the video mentions, the bayous can serve to conduct water away from built areas and help reduce flooding, but they can also back up and overflow when a storm like Harvey occurs. Hurricane Harvey hit the eastern Texas Gulf coast as a category 4 storm, devastating coastal communities such as Rockport, to the west of Galveston. However, the storm is much better known for the rainfall it dumped on the greater Houston area and southwestern Louisiana. Many communities, including Houston, received more than 40 inches of rain in four days (isolated locations received over 60 inches) and the damages amounted to $125 billion. Many lives were lost in the flooding, which displaced 30,000 people, flooded hundreds of thousands of homes, and closed Interstate 10, which is the main route for commerce across the southern United States.
Please watch the Washington Post video, Here's why Houston is flooding so badly (3:19)
Houston has experienced three “500-year floods” between 2015 and 2017. A 500-year flood is NOT a flood that is expected to occur every 500 years, in spite of its misleading name. It is, in fact, a flood that has a one in 500 or 0.2% chance of occurring in any particular year. So, it is possible to experience a flood of this magnitude two years in a row. However, these types of floods have been occurring more frequently along the Gulf Coast in the past decade.


Prior to Harvey, Houston’s building codes required new construction and renovated buildings to be elevated above the “100-year” floodplain” – or the areas susceptible to floods that have a 1% chance of occurring in any given year (or 100-year floods).
After Harvey, the city of Houston and surrounding Harris County enacted new ordinances under which any building under construction or re-construction, must be raised two feet above the 500-year flood plain. This is an expensive undertaking, but the city and county leaders are taking a proactive approach in putting an improved policy in place that will avoid putting people and their property back in harm’s way after each flood. The Mayor of Houston, Sylvester Turner, notes that although some oppose the new rules due to the increased costs of construction, it is essential to the future prosperity of the city and will save lives. According to the FEMA website, many homes that flooded in Harvey met the minimum FEMA requirements and were not required to have flood insurance, but a Houston Public Works study shows that if the new rules had been in place at the time, 84% of the homes that were flooded by Harvey’s rainfall would have been covered.
The new rule is explained in the ABC News video Houston's New Building Codes.
If we look at Hurricane Harvey Recovery: A Progress Report, it is clear that the plan includes policy and legislation addressing mitigation and resilience so that going forward, disasters like the flooding following Harvey are not repeated. These planning documents offer a valuable guide for other cities facing recovery.
After Hurricane Harvey, homeowners could apply for rebuilding assistance through the city of Houston’s Harvey Homeowner Assistance Program. Other forms of assistance were found through non-governmental organizations such as the non-profit Saint Bernard Project, which was created to assist in rebuilding after Hurricane Katrina. Post-disaster recovery often involves a patchwork of government, non-government, and corporate partnerships, and a lot of community volunteers.
Harrison County residents (including the city of Houston) have access to a valuable interactive mapping tool for determining the flood potential for a neighborhood: Harris County Flood Education Mapping Tool The map provides color-coded spatial information based on the 1% and 0.2% flood zones.
Learning Check Point
Module 12 Lab
Module 12 LabObjectives
- Analyze FEMA Flood Insurance Rate Maps (FIRM) for a coastal area in Hanover County, NC., near Wilmington, to gain an understanding of the various coastal flood zones and their relationships to coastal hazard mitigation.
- Use evidence to consider the future of flood mitigation and insurance measures in coastal areas such as New Hanover County.
Background
Please revisit The National Flood Insurance Policy (NFIP) page in Module 12, which provides general background on the National Flood Insurance Program (NFIP).
The National Flood Insurance Program (NFIP): Historically, the NFIP has provided affordable flood insurance policies to homeowners through government subsidies. As we discussed in Module 12, the NFIP in its current state is deeply in debt and unsustainable after the past two decades of extreme weather, including more frequent hurricanes and river floods. To try to address this problem, FEMA is in the process of updating the NFIP to make it more equitable (to assess properties based on their true flood risk) by rolling out the Risk Rating System 2.0. The goal is to “enable FEMA to deliver rates that are actuarily sound, equitable, easier to understand, and better reflect a property’s flood risk”. The overhaul in the process now is designed to help address some of the issues with the NFIP. Flood insurance premiums will increase for properties that are at high risk of flooding.
You can read about these changes at FEMA: Risk Rating 2.0 Equity in Action.
Flood Insurance Rate Maps are used to determine a property’s flood insurance. A potential homeowner can access these maps before deciding to purchase property in a flood zone. The maps are also designed to help residents of coastal communities plan for and mitigate the flood risk to their properties by delineating flood zones and identifying Base Flood Elevations.
The FIRM zones are based on elevation and proximity to water, as well as several other factors that determine a property’s risk of flooding. Visit FEMA Risk Maps to read about the flood zones shown on a Flood Insurance Rate Map (FIRM). For this lab, you will need to know about Zones AE, VE, and X.
Briefly, the BFE is the calculated height to which a location statistically has a 1% annual chance of being flooded. A 1% annual chance flood is sometimes called a 100-year flood, but this is misleading because a flood of this type could happen in any given year. A house must be built at or above the BFE to be eligible for flood insurance. Adding extra height further reduces the rate. The Flood Insurance Rate Maps (FIRM) show the Base Flood Elevation for each zone on the map.
To be covered by flood insurance under the NFIP a house must be built at an elevation at or above the BFE for the location. For example, if the FIRM indicates a BFE of 14ft, the first living floor must be at or above 14 ft above the base water level (as determined by FEMA) to receive affordable insurance. The insurance rate is calculated using this and other metrics. By employing additional mitigation measures such as elevating heating and cooling systems and other infrastructure, a homeowner can reduce their flood insurance premiums.
Statement of Use of AI on Exams, Quizzes, and Labs
Instructions
- Go to FEMA Risk Map site
- In the search bar, enter “New Hanover County, NC”. This will take you to the coastal area near Wilmington. Note the coded zones on the map and the legend below the map. Now click on the “Go to NFHL Viewer button”. We will zoom in on a couple of neighborhoods to analyze the flood zones. Enter the following address: 912 Tarpon Drive, Wilmington. Note the flood zone that the property is in. Now search 7101 Grouper Ct., Wilmington. Note which zone this property is in. What is the Base Flood Elevation (BFE) shown for each location?
- Open Google Earth Pro and use the search bar to find the same properties you just found on the flood map. Zoom in to less than 500 ft. eye altitude to make a note of the following measurements: The distance between the two properties; The elevation at the driveway of each of the properties. Note the amenities that these two properties have in terms of water access. Which property has direct water access? Which property has a higher flood risk? If you zoom out to at least 13,000 ft., can you identify any natural features that would protect these two properties in the event of a storm surge?
- Zoom to an eye altitude of less than 500 ft. Go to street view at each of the properties. What flood mitigation measures can you identify by looking at the two houses? Based on all of your observations using the FIRM and Google Earth, which property is likely to have a higher rate of insurance?
- Return to the Flood Map (FIRM) and look at the zone to the east of Grouper Court. This is a CBRS Area. Google this term. What does this mean?
- Now we will examine the nearby community of Carolina Beach and check out two more properties for comparison. On the NFHL Viewer search for 1201 Carolina Beach Ave N. Find its flood zone and BFE. Observe details of its design and construction in relation to storm surge flood protection.
- Compare this property with the one directly across the street (1202 Carolina Beach Ave. N.) Find its flood zone and BFE. Observe details of its design and construction in relation to storm surge flood protection. What stands out regarding the differences between these two properties. Which property is newer? Explain why the newer one is built differently.
- Use Google Earth Pro or Google Maps to analyze the elevation of the land where these properties sit. Is there any feature protecting them from a storm surge from the Atlantic Ocean?
- What factors would have been considered in the newer property’s design and construction – based on what you know about flood mitigation and insurance?
- Based on your knowledge of the NFIP and the changes currently in progress, if there was a major hurricane this year with a storm surge of 15 ft (or more), what would you expect to observe for these two properties? Which of these two properties is more likely to be eligible to receive insurance funds to rebuild after the storm? Explain.
Lab Questions
- Match Flood Zone descriptions with flood zone designations: Zones AE, VE, and X.
- Areas along coasts are subject to inundation by the 1-percent-annual-chance flood event with additional hazards due to storm-induced velocity wave action. BFEs derived from detailed hydraulic coastal analyses are shown within these zones.
- Areas subject to inundation by the 1-percent-annual-chance flood event are determined by detailed methods. BFEs are shown within these zones.
- Minimal risk areas outside the 1-percent and .2-percent-annual-chance floodplains. No BFEs or base flood depths are shown within these zones.
- Currently, the NFIP is being modified. It is considered flawed in its original form because:
- It is too expensive.
- It has encouraged building in flood-prone areas because of its affordability
- It is in debt to the federal government and is unsustainable in its present form
- B and C are true.
- Of the possible outcomes of the NFIP changes, which one is NOT likely?
- It will increase flood insurance costs for most homeowners
- It will be based on a more accurate flood risk assessment and therefore more equitable
- It will fuel increased building in coastal hazard zones
- All of these are likely.
- Of the first two properties, you compared, which one is likely to have a higher flood insurance premium?
- Grouper Court because it is built at a significantly lower elevation than the Tarpon Drive property.
- Tarpon Drive because it is closer to the shoreline than the Grouper Court property.
- Grouper Court because it is in a higher risk flood zone than the Tarpon Drive property.
- There would be no difference in their flood insurance premiums.
What is the purpose of a CBRS Area and in what way does this benefit the homeowners in the neighborhood we analyzed in question 4? (2 points)
____________________________________________
- Of 1201 and 1202 Carolina Beach Ave. N., which is the newer property? What evidence backs up your assertion? Explain why the newer one is built differently. What factors would have been considered in the newer property’s design and construction – based on what you know about flood mitigation and insurance? (5 points)
- Based on your knowledge of coastal geomorphology, the NFIP, and the changes currently in progress, if a major hurricane hit Carolina Beach this year with a storm surge of 15 ft, what would you expect to observe for 1201 and 1202 Carolina Beach Ave. N? Does any natural or man-made feature protect the properties? Which of these two properties is more likely to receive NFIP insurance funds for rebuilding after the storm? Provide evidence to back up your claim. (5 points)
Summary and Final Tasks
Summary and Final TasksIn this module, you have learned about how policies in the four stages of the emergency management cycle can reduce coastal zone residents’ vulnerability to tsunamis and hurricane storm surge hazards. Tsunamis and hurricanes are short-term coastal hazards: that is, people learn of the occurrence of these two hazards only days, hours, or even minutes before impact, and they exist only for a short period. But coastal residents also face chronic, long-term hazards. Among these, sea level rise is one of the long-term coastal hazards that some governments and people are inadequately prepared to face. In the next module, you will learn about how policies can mitigate vulnerability to sea level rise.
Reminder - Complete all of the Module 12 tasks!
You have reached the end of Module 12! Double-check the to-do list in the Module 12 Roadmap to make sure you have completed all of the activities listed there before you begin Module 13.
References and Further Reading
- Center for American Progress, 2018, Echoes of Katrina: Post-Hurricane Maria Public Health Threats and Trauma
- Willison CE, Singer PM, Creary MS, et al. Quantifying inequities in US federal response to hurricane disaster in Texas and Florida compared with Puerto Rico. BMJ Global Health 2019;4:e001191. doi:10.1136/ bmjgh-2018-001191.
- The Heritage Foundation, 2013, After Hurricane Sandy: Time to Learn and Implement the Lessons in Preparedness, Response, and Resilience
- Campanella, Richard, 2006, Geographies of New Orleans
- The City of Houston, TX, 2019, Hurricane Harvey: A Progress Report
Capstone Project: Stage 6 Instructions and Examples
Capstone Project: Stage 6 Instructions and ExamplesInstructions
You are now in Stage 6 - the last stage - of the Capstone Project.
- Complete your City Slide presentation.
- Submit your updated City Slide PowerPoint here by the due date. Please employ the following naming convention: Last Name_First Name City Slides.pptx
- Submit your City Slide Narration in MP4 format: Last Name_First Name City Slide Narration.MP4
- The completed City Slide presentation should contain:
- Your Coastal City Slides PowerPoint downloaded from Canvas in Stage 1 includes the different required elements consisting of approximately 12-18 slides collected during Stages 2-5 as well as a few others outlined below.
- You will follow these minimal guidelines to complete your presentation (see template):
- A title slide.
- A map annotated with text and symbols in PowerPoint, and conveying the most important points about the city (assembled in Stage 4).
- At least twelve(12) figures on 8 separate slides (photos, graphics, graphs of data) that help the viewer understand the details about your chosen city collected during Stages 2-4. Include captions for all figures and reference the source of the image. Figures should include graphs or other kinds of data, as well as photos.
- Summary pages (3) with bullet points summarizing the most important takeaway messages you want to get across about your city.
- One (1) page outlining your site-specific concerns (from CVAT Stage 5a).
- One (1) page outlining your Recommended Resiliency Actions for your city (from CVAT Stage 5b).
- A list of references for all sources used in your research, written in citation format (from CVAT Stage 5).
- An audio narration for each slide, in
Recording Your Narration in ScreenPal PLACE THIS HERE
Today, I'm going to show you how you can take an existing PowerPoint that you've created and make a video out of that PowerPoint. So let's begin. Now it's very important to note that in this demonstration, I'm using the 2016 Mac version of PowerPoint. But if you're a Windows user using the 2016 version, the process is very similar, so you should be able to follow along just fine.
Now, the first step you'll need to do will obviously be creating your PowerPoint, and if you want any animations added to PowerPoint like I've got here, you'll need to do that before you begin recording. But once you've finished making a PowerPoint presentation, the next thing you might want to do is add audio to that presentation. Now, most laptops come with a built-in microphone that can be used, of various quality depending on your computer. You can choose to use that microphone and talk into the laptop. However, if yours doesn't have a microphone, or you're not using a laptop, or you might want a little bit better audio, you can easily get external microphones that plug easily into your computer and use that instead. But once you get sorted out how you're going to record your audio, to add audio to your presentation, you locate the slideshow toolbar up at the top here. And you've got this tab here called "record slideshow". When you press this tab, it'll immediately start recording. And what will come up is a view that looks like this, and it's already capturing what I'm saying. Now, as with any other PowerPoint, you scroll through them the same way. And I like to use the direction keys to do this. So once I'm finished with the slide, I use my direction key, and it'll go to the next slide. And if you've got animations, you keep pressing that direction key, and those animations will add, as per normal, and will save the timing that you press them to come in at. Once you've finished, you either press this "end show" at the top left here, or you just press the next directional key. It'll ask you whether you want to save the slide timings. If you're happy with what you recorded, you hit yes to that option. If you want to review what you recorded and make sure you're happy with it before you move to the next step, you can press this button here, the "play from start" button, found on that slideshow toolbar, and it'll play what you recorded from the start, and it'll look a little something like this. I'm going to escape that now. Now you might not have been able to hear that audio the best cause it is coming through my laptop speakers.
But let's now say that you're happy with the recording, and you want to export this as a video now. This is where Macs and Windows will slightly differ. On a Windows computer, you'll have a file option here, where on the Mac, I need to go to the top bar and find my file option here, and you want to press this. Now, if you're using a Windows computer, you'll actually immediately see a "create a video" option. However, on the Mac, we don't have that here. So, to create a video on a Mac, we need to hit the export. Obviously, on the windows, you press the "create a video" option. Now, if you're using a Windows computer, what comes up next is pretty self-explanatory to create your video. But for Mac, it's hidden under a drop-down. You'll find this "file format" option, and at the moment, it defaults to PDF. Well, I don't want to export it as a PDF; instead, I want to press this drop-down, and it gives me a list of file formats to export it as. There are two video format files that we can export as, either an MP4 or a MOV file. Now, these two files are fairly similar. The .mov file is a bit more QuickTime-related than anything else, whereas the .mp4 file is much more widely recognized. So if you're planning to share this amongst a lot of people, you might want to use the MP4 file. Now, once you've selected that, it gives me a quality option, and it has three different levels that you can choose from. Now, the higher the quality you choose to export your video, the larger the file is going to be. So you've got to decide what is going to be most appropriate. Here, I'm going to choose the top quality, which is a 1920 by 1080 video. Once you've done that, and you're happy with where you're exporting it to, you press the export button. And what that now does is, down at the bottom here, it's exporting that video in an MP4 file. Once you've allowed PowerPoint to finish exporting that file, you locate that file where you've saved it, and you've successfully created a video of your PowerPoint.
Statement on Use of AI in Capstone Research
- You cannot use AI for the City Slides under any circumstances. You can search for images using Google Images or any other search engine. Copying images or presentations out of AI is easily detected and you will receive a strict penalty if we determine you have used AI for this part of your Capstone project.
Please note again that AI is not allowed in any other part of this course, as we discussed in the Academic Integrity part of the Orientation. Please let us know if you have any questions.
Rubric
| Capstone Project Stage 5: Coastal City Slides | Details | Criteria | Points |
|---|---|---|---|
| Coastal City Slides: Overall Presentation Quality | Overall quality includes general aesthetic and attention to detail, grammar and spelling, as well as including all required components. Good use of references to show information sources. | An excellent, detailed and professional presentation contains all the required elements. (5 points). Most of the required elements, including narration, are complete but some details may be inaccurate/ lacking. (3 points). Some aspects of the presentation needed more work; elements may be missing; the student did not follow all guidelines; sloppy presentation/ grammar, etc. (2 points). Poor/sloppy presentation; lack of attention to detail; many elements missing; little application of class material (1 point); No presentation submitted (0 points) | 5 |
| Coastal City Slides: Comprehensiveness of Maps and Figures | Include more than one relevant, annotated, and referenced map and an elevation profile. Include at least 8 annotated and referenced photos, and other graphics to illustrate the most important points about your coastal city. | Presentation contains at least 1 annotated map and at least 8 excellent, relevant, annotated, and referenced figures and illustrations, including maps, photos, graphics, data, etc. (15 points). Presentation contains a good, annotated map and figures and illustrations to convey the main points but may be missing some details. (10 points). Presentation contains no or poorly presented maps and inadequate or missing captions; more information needed. (5 points). Missing most figures and illustrations. (2 points). Presentation contains no figures or illustrations (0 points). | 15 |
| Coastal City Slides: Summary Slides | Include 2-4 pages that summarize your research, highlighting the key points about your coastal city. | At least two summary pages are included, effectively summarizing the most important take-away messages about the coastal city, covering all aspects. (6 points); 1-2 pages summarizing main points about the coastal city, some aspects covered. (4 points). A brief summary covering some points but important information missing. (3 points). Summary is lacking in detail (2 points); No Summary page (0 points). | 6 |
| Coastal City Slides: Site-Specific Concerns and Considerations | Include a slide with your final version of Site-Specific Concerns and Considerations in your Coastal City Slides. | Includes at least 5-6 excellent, well thought out concerns/ considerations (8 points); Includes 4-5 acceptable concerns/ considerations (5 points); Includes 2-3 brief concerns considerations (2 points); 1-2 concerns considerations, briefly described (1 point); No concerns/ considerations (0 points). | 8 |
| Coastal City Slides: Recommended Resiliency Action Plans | Include a slide with your final version of your Recommended Resiliency Action Plans in your Coastal City Slides. | At least 5 suggested planning/policy Items are discussed in detail. Provides detailed insight into the coastal city’s planning for coastal hazards. Applies class materials (8 points). 3-5 suggested planning/policy items discussed in detail. Provided insight into the coastal city’s planning for coastal hazards. Applies class materials (5 points). At least 2 suggested planning /policy items discussed. Little application of class materials (2 points). 1-2 suggested planning/policy items discussed. Poor application of class materials (1 point). No suggested planning /policy items discussed (0 points). | 8 |
| Coastal City Slides: References and Key Resources | Include slides with a list of references for all sources used in your research, written in citation format, in your Coastal City Slides. Links should be searchable. | More than 8 high-quality references, written correctly as a citation with an online link included (3 points). 4-6 Good references. Includes descriptors; Online link included (2 points); 1-2 poorly written references or sources of poor quality; online link only (1 point); No references (0 points). | 3 |
| Coastal City Slides: Audio Narration | Include a narration for each slide - approximately 30 seconds per slide - summarizing key points shown in slides. | Narration is very well executed, interesting, and succinct, conveying important information about the city (15 points). Narration is adequately executed but lacks some elements (10 points). Narration is lacking detail or missing for some slides (2 points) Poor narration (5 point); No Narration (0 points). | 15 |
TOTAL POINTS | 60 |
Submission Instructions
Submit your completed PowerPoint to Capstone Project: Stage 5 (Final) by the due date on the Calendar. Please employ the following naming convention: Last Name_First Name Stage5.ppt. respectively.
Examples
Below are a couple of examples to help you get going. We stress that there are no correct answers, and these examples are just for guidance, to help you with questions about the amount of detail we expect in various components of the Capstone project. Every city is different, and there may be more information in one area or another for a specific city. For example, there is often more information, particularly in the engineering and policy areas, for U.S., European, and some Asian cities than there is for some cities in Africa. Again, please use these examples for guidance, along with the detailed directions for each stage, and let us know if you have any questions. Please note that there are slight differences between these examples and the current version of slides used in this course. The main thing we want to demonstrate is the level of detail we are looking for.
Video: San Francisco Coastal City Slides (9:45)
San Francisco Coastal City Slides
So I chose San Francisco for my Capstone project. I've been to San Francisco before, and I've seen some of the engineering with my own eyes, so I thought it'd be interesting to explore San Francisco in its entirety. So this is an overview map of the entire city of San Francisco. All the most important locations that I talk about in the project are pinned on the map taken from Google Earth. On the left, starting all the way in the bottom left, we have Pacifica Beach, which isn't technically part of San Francisco, but it's important to the project. And as we move up, there's the Oceanside Water Treatment Plant, the West Side Pump Station, San Francisco Zoo, and the Great Highway and Ocean Beach, with, of course, the Golden Gate Bridge and the Embarcadero, and the San Francisco Bay. So this is a close-up of three out of the five main concerns and considerations I addressed. The Oceanside Water Treatment Plant on the bottom, and the zoo, and the West Side Pump Station. So the zoo and the infrastructure make it especially vulnerable, as it's so close to sea level. And I said, three out of the five, because there's two others, there's the Embarcadero and the Great Highway, which you'll see in the next picture. So there is the Great Highway right here. And this is actually a close-up of Ocean Beach, and I thought it was worth including a close-up here because I talk about this quite a bit in this project. But you can see there's little to no space on the beach that is not built up to protect the buildings behind it. It starts with Dunes at the bottom, and as you travel up, there's a sea wall, and then more dunes, and then another sea wall. So this is a topographic profile of San Francisco that starts directly in the center of the city and travels West, eventually ending at the Pacific Ocean. I have a topographic map of the entire city later in the presentation, but this shows you just how much change in elevation San Francisco really has. It's pretty amazing to me how quickly the elevation changes in this city. So this is Ocean Beach. So, Dune restoration is very common along the beach. The picture on the left is before, and the picture on the right is after the Army Corps of Engineers constructed a new Dune to defend the infrastructure located along Ocean Beach. The infrastructure defended, I already talked about some of it, but there's the Great Highway, the Ocean Tidewater Treatment Plant, the West Side Pump Station, and the San Francisco Zoo. And credit can be given to Thomas Pendergast here, as he took the pictures before and after the construction was done. So this is a section of Pacifica Beach, which is not technically in San Francisco, but it's close enough. And this emphasizes the need for managed retreat as erosion continues taking land away. These man-made structures or these man-made areas are very close to collapsing, as you can see on the right, and it's circled on the left. The left shows the eroded land slowly approaching the man-made structures. And on the right is a zoomed-in picture of the same section that shows the scale of the erosion. So the right picture was provided by Duncan Sinfield from a YouTube video that we watched in class, actually. So, I was unable to make this picture less blurry, so I apologize for that, but I thought it was important to include. So much of the graphic doesn't apply to San Francisco itself, but it applies to the bay, and it's important to recognize all the work being done to protect the bay, and we still have problems with flooding. So just take a look at all the various lines to get an idea for the strategies being used here. So I included the map on the left, which is brought by NOAA, to show that the places closest to sea level are not necessarily the most vulnerable in this city. The city has a really interesting topography, which you can see on the right, and it makes it super easy for humans to prepare for incoming hazards. And you can see the stretch of the beach of Ocean Beach, on the west, there, right around the middle, it's just slightly vulnerable. And then there's dark red sections, which show high vulnerability. And then the white slash light red sections that show low vulnerability. And the typography map was made by Brian Stokle. So the map on the left here shows the San Francisco city inundation upon 10 feet of sea level rise. The map was made by NOAA Interactive Sea Level Rise Viewer because I found the exact map when I was doing my research, but it's cleaned up by SF planning. And then the map on the right shows sea level rise projections provided by the state of California and the U.S Army Corps of Engineers. And by 2100, rise projections range from one foot to 12 feet, which is a huge scale. So about six to eight feet of sea level rise is expected by 2100, as said by California, and only three feet is expected, as said by the Army Corps of Engineers. So the graph does a really good job of representing the uncertainty surrounding sea level rise projections. And the graph on the right was made by SF Lifelines Council. So this is another piece of information provided by SF Lifeline Council, slide credits can be given SF Lifeline Council and not to me, just to be clear. So, assuming that there's three feet sea level rise in the San Francisco Bay, this is about how much of the Embarcadero will be inundated with water. So the vulnerability really emphasizes the need to build the Embarcadero or to rebuild a better Embarcadero Seawall, which is actually in the process of being done. So, here's the physical summary. So, San Francisco is located on an active right-lateral transform plate boundary, known as the North American Pacific Plate Boundary. And tectonic movement along this plate boundary causes earthquakes and tsunamis. San Francisco is a peninsula, and it has both Rocky coastlines and sandy beaches, so I would call it an emergent wave-dominant coastline. And hazards include severe storms and flooding, tsunamis, sea level rise, and earthquakes. And I would rate it a medium risk to hazards. So here we have the Human Social Summary. The population is a little over 800,000. I won't get into all the numbers here, but it's about 44.9 percent white, 34.3 Asian, and the biggest age group is the 22 to 24 age people, and that's about 37.5 percent of the population. The building breakdown is hotels, industrial buildings, retail, high-rise buildings, manufacturing plants. They manufacture ships, aerospace products, electronics, food, and apparel. And then there's the landmarks, of course, the Golden Gate Bridge, Alcatraz, USS Pampanito, the Mission District, California Academy of Modern Science, and the list goes on. So, the Engineering and Infrastructure Summary. The infrastructure, there's the Golden Gate Bridge, the Bay Bridge, Embarcadero, the Great Highway, Route 101. There's a ton of piers and four ports. The water infrastructure includes the West Side Pump Station, Oceanside Treatment Plant, and the water supply from the ground, and a little bit from reservoirs outside the city. And then the engineering, there's hard structures like the O'Shaughnessy Seawall, the Embarcadero Seawall, Norwegian Seawall, and the sea dikes. And there's also soft structures. There's various plants and grasses planted on dunes to contain sand, and there's also fences that help limit erosion. And then there's dune restoration. So, the Vulnerability and Planning Summary. There's an old population of about 13.6 percent of the San Francisco population, and then there's the poverty, which is about 10.1 percent of San Francisco. And these groups are pretty vulnerable. But depending on their relation to low sea level areas, they may not be at risk. Living at low sea level or low elevation is not super common in San Francisco because much of the city is built at a higher elevation. But if they do live or if someone lives close to a low elevation, they are definitely vulnerable. And then, as far as planning, there's the Embarcadero Seawall Program, advancing living shorelines in the bay, marsh restoration, de-paving parks, building codes, planned retreat and land use plans, increase beach renourishment, and dune management. And last but not least, we have the Resiliency Recommendations Summary. Number one is beach renourishment and dune management. I would do this one first. It's pretty easy and not super expensive. It's only temporary, as erosion takes from it, but we do our best to limit erosion. Number two is expedited managed retreat in Ocean Beach in Pacifica Beach. So if we move the buildings away, we'll reduce population vulnerability and create an opportunity for flood mitigation. Number three is a focus on ecological restoration funding. So restoring wetlands, waterways, parks, and they improves flood resiliency. Number four is to begin construction on a movable flood barrier. So this is an example of a smart building technique, but something like the MOSE barrier or the Thames barrier. And I would do it right where the Golden Gate Bridge is to protect the Bay from flooding. And then number five is to increase Green Space, as this will create habitats as well as recreation, and it will reduce incoming wave energy. And then this is my reference slide. Thank you very much.
Video: Coastal City Slides: Shenzhen, China (11:13)
Coastal City Slides: Shenzhen, China
Hi, I'm Riegen Poduszlo, and this is my presentation on Shenzhen, China, for Earth 107.
Okay, so Shenzhen is in a very interesting location because it is a low-elevated level and it's right by the Pearl River and the Sea down here. The coastline is this emergent on,e and it is a tide-dominated one. There's a large amount of sediment, and this is mostly due to shore erosion, which is a major problem right now.
Okay, so for the next couple of slides, I'm not going to have my camera on so that we can see in full detail the infographics I have. So here is the topographic of Shenzhen, and it is from what can be considered like the heart of Shenzhen, which is a very densely populated area to along the shore of the Pearl River. And here we can see not much of this is above 25 meters for elevation. So at this point here, that I highlighted, it's only at nine, which is not great whenever you're surrounded by water and are at very high risk of flooding like Shenzhen.
Here we have our start of the figures. So this is a color-coded map of Shenzhen. It is color-coded by flood hazard zones. All these little red dots are hot spots of places that are likely to and have been flooded. Here's the key. So as we can see, definitely likely to flood. But there's still, you know, some areas that are like fairly low. And this is from 2016. This is real data. And we have the predicted by 2030 and it is not looking any better. In fact, it's looking fairly worse. So it can be a little hard with the hot spots, but I think it demonstrates fairly well what Shenzhen is in for.
Shenzhen is a metropolitan area. It has over 13 million people, close to 14 million. This is going to be presumed to grow due to the growing tech industry. And this industry is bringing in a lot of billionaires and tech moguls into the area. And it's creating a rather large disparity in wealth. And I think these two photos exemplify that really well, with the skyline being rather new. And these, I'm going to presume are apartments, not being the same. Speaking of apartments, apartments are the largest form of housing in the area due to the dense population. Shenzhen has a very rich history with people inhabiting the area as far back as 7000 years ago. So much to be had here.
Okay, revisiting industries. Shenzhen's industries that they've had for long before the tech industry, is manufacturing and shipping. It's a global shipping hub. It's very important to not only China but to global trading. So it's a very high-risk area. If anything were to happen, it would disrupt trade and manufacturing globally.
Shenzhen is no stranger to flooding. It has always happened, it's just gotten way worse over the years. I think this picture demonstrates that really well. This entire street here is flooded. This is actually from the 2019 flood, which really sparked a lot of people and a lot of response in citizens, to start making a change and help mitigate these floodings and heavy rainfalls. And they want to do this by implementing the Sponge City design. And it is to address issues of flood risk and chronic water scarcity. Shenzhen is a very large area, very urban area, with a lot of history. And unfortunately, with that comes a lot of pollution, especially in the water. So they export, I believe, over 60% of their water from more rural areas. They don't really have a good reservoir, so they wanted to kill two birds with one stone with this design. So I think this really exemplifies this well. The soil composition of Shenzhen is really unique, where that it can hold a lot of water. So the idea would be getting heavy rainfall or flooding, putting into these water deposits or under the ground, in this really saturated area between the urban area, the city, and the Bedrock, and taking this water and putting into aquifers and cleaning it so that it can be used later on. So it would both take in all the excess water and then reuse it.
Shenzhen's sponge city concept is really interesting, but it's still in its infancy. So it is only in trial in certain parts of the region and has not been widely rolled out. For it to be rolled out, it's going to take time. So, in the meantime, they have implemented, what I understand to be, a very limited rollout of soft engineering solutions such as rocks between land and water, planting mangrove trees, and mud flats to help mitigate.
Okay, and now we're going to be reading from our summary portion of the presentation. So I'll just go through these bullet points. Southern China is a subtropical climate located on the Eurasian plate, and it's not very close to plate boundaries, so it's not a tectonically active area. Intervention has played a huge factor over the past 40 years in reducing the erosion of the shoreline, using sea walls as well as other soft engineering methods. Shenzhen is implementing the use of a sponge city that will lower flooding and add to their water reservoirs. Over the past 30 years, the restoration of tidal mangroves in tidal mud flats are helping to reduce flooding and CO2, and these endeavors that they're doing are called nourishment projects. Unfortunately, Shenzhen only recently began setting more of a firm plan after a major flood in 2019. So they're approaching this as a response not only to flooding but as climate change as a whole. And, according to the Chinese government, policy is still in its infancy, and there needs to be more research done before policy can be implemented. So there is not much out there on what the Chinese government plans to do in terms of response for its citizens.
Okay, continuing on with our other summary slides, I'm going to continue to read bullet points and give some more information. So, a goal of Shenzhen is to make their city a smart city, and this is going to be done by implementing new Smart Water utilities, which is the sponge city concept, and it's just referring to all the moving parts that would be involved in making Shenzhen a sponge city. So there's over 13 million people, as mentioned before, and this is a major deal because a 2018 study found that most citizens are unprepared for natural disasters and are lacking proper education in this. And this can be contributed majorly to income inequalities, regarding access to information, access to vehicles to get away from the city to evacuate, as well as being afforded the luxury of having time to research and prepare for these matters. So the general advice given to people is to seek elevated areas. And I wanted to also mention again, highlight the income inequalities, because as shown before in a previous couple of slides, the housing they are apartment buildings, but they're rather low and they're not exactly very new. So, where they're seeking shelter is definitely a concern.
Okay, and now on to a summary of resiliency recommendations. Shenzhen has a large population and a lot of vital Industries, so there are a few things I'd like to recommend. The first would be to make well-known plans for both evacuation and recovery that consider both citizens from affluent backgrounds as well as those from less privileged ones. With the recent floods going so awry, it's become more or less of a wake-up call for those of Shenzhen, as well as those around the globe, how important it is to prepare, so we can ensure everyone's safety. And this would be by making safety plans and evacuations well-known to everyone in the general public. And I mentioned this as my number one because the Chinese government has not implemented a policy that's set in stone, that takes into account every Citizen's way of evacuation. So I think that would be the first thing because this is a matter of when and not if another flood this bad happens again. Continuing, I'd like to continue to build shorelines and invest in ways to reduce the effects of sea level rising and flooding. So the sponge city concept is a really interesting one, and I really hope this goes well, but they're putting all their eggs, or more or less all their eggs, into this sponge city basket. And, as mentioned before, in phase one, they've implemented soft engineering techniques that have been fairly effective. So I think instead of phasing that out, they continue to implement both the sponge city concept as well as more soft engineering ideas. And that'd be about it. Thank you.
Module 13: Sea Level Rise Policy
Module 13: Sea Level Rise PolicyIntroduction
We opened Module 4, with the video Rising Sea Levels - Changing Planet, which began by describing some of the consequences to the world’s coastal communities of sea level rise. Dr. Ben Horton of the Earth Observatory of Singapore predicts that with more than 1 meter of sea level rise, social and economic consequences will include health problems, social problems, and political instability.
Already, coastal communities are experiencing more frequent flooding, poorer drainage, higher storm surge, increased shoreline erosion, and saltwater intrusion into surface and groundwater sources. Flooding is leading to damage and loss of infrastructure and peoples’ homes at an increasing rate around the world.

At this point in the course, you should have a pretty good understanding of ways in which sea level rise can impact human communities and ways in which communities have been responding up to this time. In Module 13 we will examine how communities can prepare for a future of higher sea levels through careful planning, We will also look at case studies to see how well the planning is going.
In Module 4 we discussed the current trend of increasing sea levels, and the projections for the future (look back at Recent Sea Level and Rise and Anthropmorpic Impacts). These projections point to global average increases in sea level of around 1 – 1.5 meters (3-5 ft) by the year 2100 or 80 years from now.
For many people, projecting 80 years ahead is hard to visualize and because they view it as beyond their lifetime experience, they find it hard to engage. The year 2050 is only 30 years away – a typical mortgage lifetime. Many coastal cities will see around 1 ft in increased sea levels by 2050 and, worldwide, millions of people will have to relocate due to persistent or repeated flooding, and related economic reasons. What impacts will this have in the next 30 years? What can we do to prepare for these sea level increases?
In Lab 1A (Module 1), you used a mapping tool to investigate projected chronic flooding impacts to coastal communities at different time frames, and the economic effects, particularly related to real estate, this may have on these communities. Additionally, in Module 4 Lab you used the NOAA Sea Level Rise Viewer to assess projected sea level rise impacts on Boston, MA, San Francisco, CA, and Grand Isle, LA. You have also considered many strategies – both structural and non-structural - for protecting coastal communities from the inevitable flooding that is and will be common-place as time progresses.
As you work through this module, keep in mind the following large-scale questions: If 30 million people must migrate away from coastal zones around the world by 2055, where will everyone go, and how will displaced people make a living? What social consequences are associated with large-scale migrations? How will these issues be addressed?
In the nearer term, we need to consider more tangible questions regarding adaptation to sea level rise on coastal communities, such as:
- What sea level rise policies are currently in place and are these policies adequate for the changing scenarios for our coastlines?
- What strategies can communities use to prepare for sea level rise, and who decides how what, where, and when regarding policy implementation?
- How will countries around the world fund sea level rise adaptation strategies?
John Englander’s 2013 book High Tide on Main Street: Rising Sea Level and the Coming Coastal Crisis addressed several important points regarding planning for sea level rise in coastal communities around the world. He stresses the importance of long-term thinking and the fact that people find it difficult to plan far into the future. He mentions that those reluctant to embrace the science of climate change often take issue with the uncertainty of future sea level projections. He makes the point that uncertainty should not prevent planning, because investors deal with uncertainty all the time. Importantly, he also points out that planning for 30 years is more manageable than 100 years, but policymakers need to also consider and base policy on what things will look like in 80 or 100 years to know where we are heading. Englander posits several “intelligent adaptation” strategies, including acting with a long-term perspective; expecting and accepting a range of projections and uncertainty; considering geology; recognizing that federal bailouts are not sustainable; and anticipating property devaluation.
These strategies are proving challenging to implement. Some coastal communities are leading the way in sea level rise adaptation planning and can serve as models for other communities to follow. We will look at some of these exemplary models and consider how efforts made today will benefit these communities in the future.
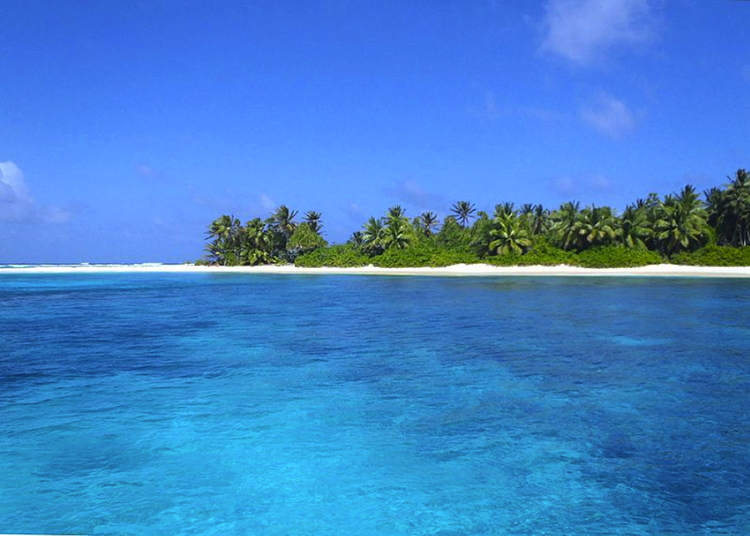
Goals and Objectives
Goals and ObjectivesStudents will assess how coastal communities can plan for and adapt to rising sea levels.
Learning Objectives
By the end of this module, students should be able to:
- critically examine the current state of sea level rise adaptation policy in the U.S.;
- consider the policy options for coastal communities at risk from sea level rise in the U.S. and around
the world; - assess how coastal community stakeholders work through the planning process, assess vulnerability
and adaptation strategy options;
Module 13 Roadmap
| Activity Type | Assignment |
|---|---|
| To Read/Watch | In addition to reading all of the required materials here on the course website, before you begin working through this module, please read the following required readings to make sure you are familiar with the content so you can complete the assignments. Videos
Reading
Extra readings are clearly noted throughout the module and can be pursued as your time and interest allow. |
| To Do |
|
Questions?
If you have any questions, please use the Canvas email tool to contact the instructor.
The Sea Level Rise Adaptation
The Sea Level Rise AdaptationRecall in Module 1 Lab 1A you responded to a prompt in a guided discussion using an interactive ArcGIS Story Map: US Coastal Property at Risk from Rising Seas. This tool allows the user to explore coastal communities and analyze the risks to properties in terms of flooding and financial loss. You can see the results for 2045 and 2100 shown spatially on the color-coded map. Some of the results are shocking. The year 2045 is 25 years away, so well within the lifetime of an adult who has a 30-year mortgage on a house in a flood risk zone. In many cases, jumping to 2100 gives a much more alarming view. One of the messages this tool provides is that sea level rise is happening now, not in an abstract way in the future, and that this generation must take action, and not leave it for future generations to address.
To this end, there are signs that more coastal communities in the U.S. are beginning to recognize the importance of sea level rise adaptation planning. On the other hand, a 2019 Climate Central analysis found that many cities are developing new homes faster in flood zones than in safer locations. New Jersey, Florida, and North Carolina stand out as the states building the most homes in flood risk zones. It is clear from these data that there is still a lot of work to do.
Climate Central has ranked U.S. cities based on their vulnerability to sea level rise: Go to Climate Central to view the three ranking lists. Note the three lists rank for, 1. Current flooding vulnerability (2017), 2. Flooding vulnerability in 2050, and 3. High social vulnerability populations at risk by 2050. All three of these lists rank New York city at #1 or #2, and the rest of the cities in the top 10 are in Florida. Note that the population exposed is critical to the ranking on these lists. Remember from Module 11 that the number of people exposed is a measure of vulnerability and social vulnerability (e.g., poverty, sickness, old age) increases the sensitivity of a community to sea level rise.
Please watch the PBS video below, Two cities, two very different responses to rising sea levels. It highlights and compares approaches to sea level rise planning in New York and Charleston, SC.
Video: Two cities, two very different responses to rising sea levels (9:19)
Two cities, two very different responses to rising sea levels
JUDY WOODRUFF: Tonight, the NewsHour begins a series on the way communities prepare and survive disasters, both natural and manmade. NewsHour special correspondent Jackie Judd brings us a tale of two cities, both on the Atlantic Seaboard.
JACKIE JUDD: The crane towering over Rockaway Beach is a symbol of New York City's urgent, almost frantic effort to prevent a repeat of what happened in 2012 when Hurricane Sandy nearly brought the city to its knees.
DANIEL ZARRILLI, Mayor's Office and Recovery and Resiliency, New York City: We have 520 miles of shoreline. We have always been at risk of coastal inundation, but Sandy really changed the way we think about that risk and how we engage with the waterfront.
JACKIE JUDD: The response is not simply about minimizing hurricane damage. The larger issue, the issue making hurricanes more destructive, is sea level rise caused by climate change and a warming planet.
BENJAMIN STRAUSS, Climate Central: We're not labeling things with sea level rise when we should be.
JACKIE JUDD: Ben Strauss is a scientist with the research organization Climate Central.
BENJAMIN STRAUSS: A storm comes in, we have a damaging flood, and we say we had a storm, we had a flood. But every flood is deeper, bigger, and more damaging because of the sea level rise we've already had.
JACKIE JUDD: In the last century, the sea rose at least eight inches, and the rate has been accelerating since the 1990s. In the Rockaways, Mayor Bill de Blasio, recently and with great fanfare, opened the first stretch of a new concrete boardwalk built above the floodplain to replace the wooden one Sandy destroyed.
BILL DE BLASIO (D), Mayor of New York: This is also part of resiliency because all of these measures will protect, not just the boardwalk, protect the community beyond the boardwalk.
JACKIE JUDD: The boardwalk, so close to homes and businesses damaged by Sandy, is designed to hold back storm surge. It is only a piece of a $20 billion blueprint resulting from a collaboration with the state and federal governments and climate change scientists. Dan Zarrilli, who oversees the city's efforts, says first came an assessment of the city's risks and vulnerabilities, and from there, the more granular questions, dealing with hardening old infrastructure and building new infrastructure to withstand poundings in the coming decades.
DANIEL ZARRILLI: Even just considering the 2050 scenarios, about 8 percent of the city's shoreline could be flooded on a daily basis, just due to high tide, not even during a coastal storm event. And so thinking through the implications on neighborhoods, the investments we need the make to reduce risk and to handle that level of inundation is something that's driving our policies around our entire coastal protection plan.
JACKIE JUDD: New York City's aggressive efforts to prevent future catastrophe is not an approach that all cities facing rising sea level rise and other consequences of climate change are following. Take Charleston, South Carolina, which is known as low country for a reason. This spot just near the center of the city is only several feet above sea level. Sandy Bridges owns a small boutique nearby, in Charleston's vibrant Tourist District.
SANDY BRIDGES, Business Owner: High tide, rainy day, we just always experience flooding here.
JACKIE JUDD: Guaranteed?
SANDY BRIDGES: It comes right up to my doorstep on a really heavy downpour.
JACKIE JUDD: This is what it looked like near her store in 2012 after Hurricane Isaac brushed by the city. The fast-growing region is one of the Eastern Seaboard's most vulnerable. Waterways snake through the city and neighborhoods have been built on landfill. Flooding has plagued the city for generations, but it's getting worse.
CHRIS CARNEVALE, Southern Alliance for Clean Energy: At a particularly high tide, floodwater already comes in through the seawall and through the sidewalk and it fills the street right here at this intersection.
JACKIE JUDD: Environmentalist Chris Carnevale says sometimes it doesn't even take rain during an unusual high tide to trigger what the locals call nuisance flooding.
CHRIS CARNEVALE: We used to see about four-and-a-half days of nuisance flooding per year in the mid-20th century. Now we're up to about 23 days per year. When we project that into the future, as seas continue to rise, that's going to look — that's going to be many more days per year.
JACKIE JUDD: Even so, business owners, scientists, and environmentalists say, unlike New York, officials are moving too slowly in planning and seeking the necessary funds.
FRANK KNAPP, South Carolina Small Business Chamber of Commerce: They are taking some efforts, but those efforts are simply very inadequate.
JACKIE JUDD: Frank Knapp organized small business owners to agitate for swifter action. They have posted blue tape on door fronts to remind tourists of the flood line in a surge.
FRANK KNAPP: When the public actually takes the time to learn about the inundation threats under very small levels of sea level rise, one or two feet, I think they're going to be very shocked and they're going to be demanding that the city start doing some planning.
JACKIE JUDD: It's been more than a quarter-century since Charleston had its Sandy, Hurricane Hugo in 1989. So that sense of urgency is absent. And in a politically conservative state such as South Carolina, climate change is a difficult subject.
BRIAN HICKS, The Post and Courier: They put that report in a drawer. They didn't want it to see the light of day.
JACKIE JUDD: Political columnist Brian Hicks says, in 2011, scientists at the state Department of Natural Resources produced a report intended to sound the alarm, but political appointees shelved it.
BRIAN HICKS: When they did finally release it, they changed the executive summary, and there were all these things about, you know, that some scientists think this, and some scientists think that. It was very much a denial factor here, and they deep-sixed it.
JACKIE JUDD: Predictions for sea level rise in the next 100 years range from one foot to six feet. In Charleston, the creeping blue in this government map shows flooding that would occur at high tide with one to five feet of sea level rise. The higher-end would wreak havoc. Liz Fly is part of a team of state scientists overseeing coastal conservation.
ELIZABETH FLY, South Carolina Sea Grant Consortium: There is the risk and likelihood of some communities going underwater with increased sea level rise.
JOSEPH RILEY, Mayor of Charleston, South Carolina: Climate change is not going to remove Charleston from the landscape.
JACKIE JUDD: Joe Riley is the longtime mayor of Charleston.
JOSEPH RILEY: There's no cause for — to despair. It's all — the incremental improvements will protect this beautiful, historic city.
JACKIE JUDD: The most significant improvements to date, according to Mayor Riley, are fortifications to the battery at the point of the Charleston Peninsula, and this extensive new drainage system designed to pull water out of the city as fast as it comes in. But there is no broad adaptation plan in place. Are you planning on a one-foot rise? Is that the working assumption?
JOSEPH RILEY: We're planning on a range. It's incremental. We — and each year or decade, you will further calibrate that.
JACKIE JUDD: What is the range?
JOSEPH RILEY: Well, the range, you need to ask our resiliency people, but we're — we see some — some a foot, some less than a foot, some more than a foot.
JACKIE JUDD: Mayor Riley later clarified that he wasn't suggesting one foot was adequate for planning and described the drainage project as only a serious beginning to Charleston's preparations. Still, the administration has significant catching up to do.
ELIZABETH FLY: It's important for a community to look at that range of scenarios and think about their risk management, and think about what decisions are high-risk, and so maybe you should plan for a more extreme case of sea level rise, while some other decisions, it might be OK to plan for.
JACKIE JUDD: But that — that has not been decided in Charleston, right?
ELIZABETH FLY: No.
JACKIE JUDD: New York City's robust approach is more the exception than the rule along the East Coast, especially among smaller cities like Charleston.
BENJAMIN STRAUSS: This is a hard issue to really digest and tackle. We have no legal precedent, we have no institutional precedent for the idea that land will be disappearing. And we're ultimately going to need to take a very deep look at it to preserve the heritage of our city.
SANDY BRIDGES: One hundred years ago, they started planning and preserving and conserving Charleston. And 100 years from now, I want another little local business owner to be able to stand here and say the same thing. So, that's what honestly concerns me, is that 100 years from now, this could be lost.
JACKIE JUDD: Charleston Mayor Riley compares the threat of rising sea to an enemy invasion, which is just how New York City is behaving as it builds new defenses. For both cities, there is no doubt that the enemy is on the horizon. For the NewsHour, this is Jackie Judd in Charleston.
Learning Check Point
Take a few minutes to answer the questions below to test your knowledge.
Strategies for Building Coastal Resilience and Planning for Sea Level Rise Adaptation
Strategies for Building Coastal Resilience and Planning for Sea Level Rise AdaptationA coastal community can take concrete steps to become more resilient to the impacts of rising seas. A great deal of effort is underway to guide communities in the planning process for sea level rise adaptation, using a science-based process. The Sea Grant program under the National Oceanic and Atmospheric Administration (NOAA) is leading this process in many coastal counties. The Sea Grant Program is a federal-university partnership program that “brings science together with communities for solutions that work”.
We will look at the planning process that coastal communities are currently implementing around the U.S., including examples in North Carolina and Florida.
To begin, watch the video below from the Module 13 Roadmap Effects of Rising Sea Level on Coastal North Carolina - "Sea Change" - A WRAL Documentary below.
Video: Effects of Rising Sea Level on Coastal North Carolina - "Sea Change" (21:53)
Effects of Rising Sea Level on Coastal North Carolina - "Sea Change"
The following program is shot in 4k high dynamic range and broadcast in high definition from Capitol Broadcasting Company.
[Music]
Bill Leslie, WRAL-TV: The sea has been rising for thousands of years.
Man: It continues on this upward, increasing pattern.
Leslie: Scientists predict about a three-foot rise in sea level along our coast by the end of the century.
Man: This is not something we have to deal with a hundred years from now, we have to deal with it right now.
Leslie: But beach communities are dealing with sea level rise right now.
2nd Man: We are retreating by default.
Leslie: Mainland coastal communities are dealing with it too.
Woman: They have water that they need to move now.
Leslie: Saltwater is invading forests and farms.
Man: Some of these fields here are at or below sea level.
Leslie: It's inundating a federal Wildlife Refuge.
Man: There's places that are eroding on average 45 feet a year.
Leslie: Across northeastern North Carolina, water is pumping, dikes are blocking, and homes are rising.
Man: Being up here you feel a lot better.
Leslie: But sea level isn't rising above politics.
News Reporter on TV: The law makes it illegal for North Carolina to consider scenarios of accelerating rates of sea-level rise.
Woman: We're made fools of.
Man: Sea level rises is not a theory, it's a measurement.
Leslie: With a measure of uncertainty for our coast.
[Music]
Leslie: Ben Huss is a bail bondsman in Newton, North Carolina.
Man: ...check on his court date, make sure he hadn't already missed it.
Ben Huss: You are a modern-day bounty hunter when the guy doesn't show up for court.
Leslie: The job is risky.
Huss: The bigger bond, you know that's more risk for us. But it's also more money in your pocket. Here he is.
Leslie: So what is the connection between a bail bondsman in Newton and sea-level rise? Well, Huss is also the owner of this beach house made famous in the 2008 movie Nights in Rodanthe starring Richard Gere and Diane Lane.
Diane Lane: Four nights, leaving Tuesday.
Richard Gere: Pretty early. I've got a flight to catch.
Huss: I was just enthralled with it, with the movie and the house also. At high tide, the water was coming under the house, and at low tide, it would come up to the front steps.
Leslie: Huss decided to take another risk. He bought the house in 2009.
Huss: I was going to save that house to the extent that I would probably die trying.
Leslie: Huss hired the same contractor who moved the Cape Hatteras Lighthouse in 1999.
Huss: They tell me in one hour the house is going down the road.
Leslie: He moved the house nearly 300 feet from the ocean, but the ocean is following.
Huss: So now we're down to about 250 feet. There is something to the global warming in our environment, with the hotter temperatures. It's making oceans rise. That's a big enemy of any any house that's on the coast.
Leslie: Sea level rise makes erosion worse. Erosion has cost Nags Head several rows of houses over the years.
Man: They seem to be the poster child and the picture of sea level rise, which we don't want to be that.
Leslie: From 1870 to 1924, global sea-level rise has been less than a millimeter a year.
Stan Riggs, Coastal Geologist: The process of sea-level change on a global basis it's really a slow, gradual process. It's like filling your bathtub gently.
Leslie: But Riggs says global sea-level rise is accelerating. Since 1993, the rate has quadrupled to 3.2 millimeters a year. He says sea level rise is accelerating because climate change is warming the oceans. Here in North Carolina, tidal gauges show the rate of sea level rise is less than the global average
Spencer Rogers, Geologist: On average sea level has been rising annually about the thickness of a nickel every year, for at least the last 80 years.
Leslie: But Rogers expects that to change.
Rogers: We think sea level is going to accelerate in the future, even though we haven't seen it in the historical record of our gauges. But it's almost certain to occur in the future.
Leslie: Right now, scientific projections are for sea level along our coast to rise anywhere from 15 to 55 inches between now and the end of the century, with a 39-inch rise being the most likely scenario. Just a 2-foot rise in sea level would inundate much of the Outer Banks. Just imagine places like Rodanthe underwater. Sea level rise is already causing higher storm surges and more flooding. Just last month, Hurricane Jose caused overwash that came through some beachfront homes and flooded highway 12, even though its center was 300 miles offshore.
Rogers: If we look at how we're managing those threats, immediate threats, today we're not doing a very good job of handling the immediate threat.
Leslie: The town of nags head has been dealing with the shoreline threat through beach renourishment.
Cliff Ogburn, Nags Head Town Manager: Our will is to continue to nurse the beach as long as we can afford to do so. And as long as we have a sand resource that we can replenish the beach with, we're gonna continue to maintain the beach.
Leslie: The town has also required new homes to be built further from the ocean and higher in elevation. The problem is, there's little room left for new construction. The town is nearly 90% developed.
Ogburn: I wish 30 years ago they knew then what we know now.
Leslie: Lawsuits have hampered the town's ability to move homes out of harm's way and condemn and remove ones already on the beach.
Ogburn: We lost some of our appetite for this because the legal challenges are expensive and they do cost the taxpayer quite a lot of money to deal with these.
Leslie: Meantime, sea-level rise is also affecting groundwater.
Ogburn: It's rising and it's rising fairly quickly.
Leslie: Which contributes to flooding during heavy rains. Last month, the town of Nags Head adopted a comprehensive study that identifies and prioritizes its vulnerabilities to sea-level rise.
Ogburn: Regardless of where you fall on the science, and how much it's gonna rise and how fast, and how much, it seemed irresponsible for us to not plan ahead.
Leslie: The town solicited input from residents and business owners. It even formed a climate change and sea level rise adaptation committee.
Ogburn: And then we started rewriting our codes, or addressing climate change and sea-level rise into our building codes.
Leslie: North Carolina Sea Grant partnered with the town to develop the study and use it to start developing an adaptation plan.
Jessica Whitehead, NC Sea Grant: We've had elected officials there who have been engaged through the entire process. They're really serious about making this happen.
Leslie: The plan will focus on critical infrastructure over commercial and residential development.
Whitehead: To really begin thinking about, okay, at what point are we going to have a problem, at what point do we reach a threshold where we will have some negative consequences, and how do we keep that from happening?
Leslie: For the town of Nags Head, the overriding goal is to stay put as long as possible.
Ogburn: You know, we can't relocate. We can't pick up the town and move anywhere else.
Huss: So from originally built, in this picture, with 400 feet of beachfront, down to no beachfront.
Leslie: Benn Huss already moves his beloved Nights in Rodanthe's house once. He's hoping he doesn't have to move it again.
Huss: We're hoping to get 15 more years, maybe, before the water comes up to the edge and up to the front steps. And it'll be there for who knows how long.
Leslie: With a 1.2 billion dollar annual tourism economy, the Outer Banks may get most of the attention when it comes to sea-level rise. But next, the impact may be even greater further inland.
Brian Boutin, Nature Conservancy: What we're seeing here is erosion rates anywhere in the range of 5 to 15 feet per year. In some places, we're getting as much as 45 feet a year.
[Music]
Leslie: When Hurricane Emma threatened North Carolina last month, Hyde County Water and Flood control coordinator Daniel Brin went out to inspect the dike and tidal gates. They help protect the community of Swan Quarter.
Daniel Brin, Hyde County: Make sure that any debris that's holding gates opened that would allow tidewater to seep past.
Leslie: The gates help keep out salt water from storm surges and allow fresh water from heavy rains to drain to help prevent flooding. Swann Quarter is the county seat and where most of the county's 5,500 residents live. The County started construction on this 11-mile dike in the mid-80s to help protect Swann Quarter from storm surge coming off nearby Swann Quarter Bay and the Pamlico Sound. The county sped up dike construction after Hurricane Isabel flooded Swann quarter in 2003.
Brin: Isabel was a huge wake-up call.
Leslie: The dike was completed just before Hurricane Irene in 2011 and saved the town from Irene storm surge.
Brin: Right here, where you're looking now, the water was maybe three or four inches from the top of the dike. And inside you and I would be standing on grass right here.
Leslie: But the entire county is vulnerable to flooding. Most of it is less than three feet above sea level.
Brin: About 85% of the county's within the hundred-year flood plain.
Leslie: The county has a network of drainage canals and pumping stations.
Brin: And this pump is used to remove water from the agricultural land and improve land upstream, to lift it and then to move it out work on to the Pamlico Sound.
Leslie: Saltwater can ruin farmland, risking the county's nearly two hundred million dollars in annual crop sales.
Mike Burchell, NC State Professor: t's a constant battle against the water down here in hide county.
Leslie: This shows just what farmers here are up against. The same storm surge from Jose pushed this salt water three miles inland from the Alligator River and into a drainage ditch alongside Hyde County farmland. Local farmers plug the ditch to try to keep the water out but the plug is failing.
Burchell: They're seeing more evidence that salt water is moving into these canal systems and influencing negatively their agricultural production.
Leslie: Burchell is an NC State professor doing research to try and help.
Burchell: We're trying to see how much the waters rising and how salty that water is, at these different locations.
Leslie: Burchell hopes he can help farmers improve existing infrastructure and develop new technologies to battle saltwater intrusion into their fields.
Burchell: As long as it makes economic sense, they'll fight.
Leslie: The fight will get tougher. This graphic shows just how a two-foot sea level rise would inundate much of the Albemarle-Pamela Peninsula, including much of Hyde County. It would put communities like Englehart underwater.
Stan Riggs: We have many shorelines that are less than 1 foot in elevation. And if you raise it two feet, we've got the better part of six counties that are gone. They're underwater. They're going underwater right this minute.
Leslie: Like Nags Head, Hyde County partnered with North Carolina Sea Grant to develop a plan to adapt to sea level rise. It focuses more on immediate, rather than long-term, threats.
Whitehead: Because if you're not there five years from now, you can't be there thirty years from now.
Leslie: The county identified problem areas, examined infrastructure improvements, and published a flood guide for residents. It also helped identify homes that need to be elevated. Chris Hilbert helps provide grants through FEMA's National Flood Insurance Program to cover the cost of elevating homes.
Chris Hilbert: We had a recent house that was paying about four thousand dollars a year in flood insurance and when they got renewed, after the elevation, it reduced down to four hundred dollars.
Leslie: More importantly, it gets people like Bertha and Solomon Cooper out of harm's way. Their house in Swan Quarter flooded three times.
Solomon Cooper: We had just about four foot of water each time.
Leslie: The last time was during Hurricane Irene. Cooper's home was on the wrong side of the dike and filled with water.
Woman: They lost everything.
Leslie: Hilbert helped Cooper get a grant to tear down his old home and build a new one that's elevated and in a less flood-prone area. Cooper says he feels much more prepared for the next storm.
Cooper: Well you feel a little better now. You know you probably have something to come back to, you know.
Leslie: Like many Hyde County residents, Cooper plans to stay.
Brin: The people here in Hyde County are resilient folks, that's why we're still here now.
Leslie: And they understand the risks.
Brin: Nowhere else in the state I would think you would get a broader consensus that sea-level rise is real than you would here in Hyde County.
Boutin: This road used to extend well beyond where that piling is out there in the water. Just a few years back, just five years ago.
Leslie: The Nature Conservancy's Brian Boutin points out the land that's being lost to sea level rise in the Alligator River National Wildlife Refuge. The refuge covers 157 thousand acres of mainland Hyde and Deer counties. And by the end of this century...
Scott Lanier, Refuge Manager: ..a lot of the refuge could be underwater.
Leslie: Scott Lanier was one of the original three employees of the refuge in 1985. He left in 1991 and returned 25 years later.
Lanier: I just looked around and thought , my word, what is happening in this place? This change in habitat is is really unreal. What's going on?
Leslie: Marshes had turned to open water, land into marsh, and woods into ghost forests of dead trees.
Lanier: The easy button would be. oh well. you know there's nothing we can do. What's gonna happen is gonna happen. We're not gonna do that.
Leslie: Instead the refuge partnered with the Nature Conservancy on a project to adapt to sea level rise. Water control devices have been installed.
Boutin: What we're actually doing is creating more of a system where the freshwater is pushing the salt water back towards the sound.
Leslie: More salt-tolerant vegetation is being planted and oyster reefs have been installed to slow down shoreline erosion.
Boutin: ...and that helps to keep this ecosystem intact. It helps to slow the rate of erosion to something that's more natural and something that we would normally see in an area like this.
Lanier: You're preparing for what's gonna happen in the future and just slowing that whole rate of change down.
Leslie: Giving the wildlife here a better chance to catch up, adapt, or migrate inland.
Lanier: We're hanging on to what we got as long as we can.
Leslie: Next, successfully adapting to sea-level rise may mean putting policy over politics.
Unfortunately, sea-level rise and climate have become political issues, not science.
Stephen Colbert on TV: If your science gives you a result that you don't like, pass a law saying that the result is illegal. Problem solved.
Leslie: That's comedian Stephen Colbert lampooning our state legislature in 2012. It was over a law that prohibited coastal communities from using a state science panel report that looked at sea level rise projections to the year 2100. The panel later amended the report to look out only 30 years. That, of course, makes the projections look less dire. A probable rise of 7 to 12 inches instead of 15 to 55.
Riggs: It's important to show what's vulnerable out here.
Leslie: Coastal geologist Stan Riggs served on that panel.
Riggs: What the state of North Carolina did was throw that part of the coastal system under the bus. They threw the science under the bus, but they also threw the people under the bus.
Leslie: Riggs says the state can't properly plan major infrastructure projects like the new 100-year Bonner Bridge, if it's only looking at 30-year sea level rise projections. NC20, a group representing the state's coastal counties, pushed for the change.
Riggs: With the idea that the public will rebel against this, they won't come to our beaches anymore, it's gonna kill the coastal economy.
Leslie: But NC-20 says it was more about the initial report taking away local control.
Willo Kelly, President, NC-20: And it said in the report, that local governments shall, and the one thing you learn when you're looking at any legal document or legislation, there's a big difference between shall and may. And it said local government shall use a a kind of an official rate of sea level rise in local planning purposes.
Leslie: Kelley says planning for an uncertain scenario more than 80 years out is unrealistic for coastal communities.
Kelly: Climate change it's a certainty. Modeling though is not a certainty. I think the 30 years everyone could kind of wrap their heads around it and understand it.
Leslie: And she says communities can still look at the longer projections if they choose to. Spencer Rogers, who also served on the state science panel, agrees that the 2100 timeline is too distant.
Rogers: The problem is that our ability to predict that far in the future gets weaker and weaker with what evidence we have in hand and what we're able to model.
Leslie: As for future sea-level rise planning, a recent study by NC State and Appalachian State Universities found that most coastal communities are doing little to none. But the study also shows that the more certainty there is in predictions and impacts, the more willing communities are to plan.
Brian Bulla, Associate Professor, ASU: The evidence for these coastal officials will continue to come in and hopefully that will increase their comfort level and ability to to make some adaptive actions.
Leslie: Right now Nags Head and Wilmington are the only coastal communities that specifically mentioned sea level rise in their comprehensive plans.
Rogers: Unfortunately sea level rise and climate have become political issues, not science. But the good news is, they're often making the same decisions they would need to do for sea level rise adaptations, for other coastal hazard reasons. So they're there making changes for coastal hazards, they're not necessarily doing it directly for sea-level rise. And that's understandable because it's a lot more immediate threat for a hurricane this year than it is for sea level rise 100 years in the future.
Leslie: More coastal communities are requiring home foundations to be higher.
Riggs: We can engineer our way out of a lot of things, but not everything. At some point, you've got to back off.
Leslie: And while there has been some notable backing off on the Outer Banks, people there say total retreat is not realistic.
Kelly: Is there an expiration date for the Outer Banks? I have no idea of knowing that. And I know that we're going to go along, and do what we need to do, and do the best that we can do today, and in planning for a future, and protect our livelihoods, and protect our culture.
Leslie: And in 2100...
Kelly: Will it be here? Will it not be here?
[Music]
Kelly: And none of us can answer that question and we're not going to be here to know it.
This video features the efforts to address planning for sea level rise in the community of Nags Head, NC in the Outer Banks. The North Carolina Sea Grant Program assists the town in developing planning strategies, which are outlined in the document Coastal Resiliency & Sea Level Rise Planning.
Learning Check Point
Example of Obstacles to Adaptation
Example of Obstacles to AdaptationToms River, New Jersey
A look at Toms River, a coastal town in New Jersey, as told in the book “The Water Will Come” by Jeff Goodall, provides us with some more insight into some of the obstacles to sea level rise planning in the U.S.
Toms River, NJ is an example of a community that is reluctant to embrace change even with ample evidence that business as usual could lead to catastrophic losses in the future. Data are readily available for how rising sea levels affect property in coastal communities along the Atlantic coast. The data show that sea level rise will negatively affect the real estate industry, with repeated flooding and consequently reducing home values. The economic impact on tourism will be devastating. Hurricane Sandy damaged or destroyed 10,000 homes, and nearby Ortley Beach fared worse. A lot of work went into planning efforts to redesign these communities to adapt to the changing climate and higher sea levels of the future, including relocating some properties. However, despite these efforts, community leaders rejected the plans, and the town rebuilt the damaged property in the same location, elevating homes to a new level and reinforcing the dunes as protection. Toms River is not alone. Communities along the Atlantic and Gulf coasts resist change and choose to rebuild in place rather than take a long-term approach and begin to address the problems that will only get worse. The reasons are many, but to effect change, there must be political will and a desire for change in the community, which are presently lacking in many places. Although doubtless, some residents of Toms River and other communities impacted by the combination of sea level rise and storm surge do decide that they cannot risk another flood and move to a safer location, typically, people make decisions based on their personal financial situation and emotion. The example of Isle de Jean Charles in Louisiana that we covered in Module 9 exemplifies how challenging it is to implement the relocation of a community when people are attached to their homes and communities and depend on the place for their livelihoods. So, what will it take to overcome the challenges and implement successful plans for adaptation? Currently, with each successive catastrophic storm, people react and some leave while others dig in and use the resources available to rebuild.

In Module 12 you read about the National Flood Insurance Program (NFIP) and its financial insolvency. Many point to the reliance of homeowners on subsidized flood insurance to bail them out after each successive flood as one of the key incentives for rebuilding in place and for the complacent attitude towards sea level rise warnings.
It is clear that, if coastal communities are to implement sea level rise adaptation strategies, large policy changes are needed, and to effect these changes, shifts in political views and the fundamental ways people think about their relationship with their coastal communities will be necessary in many places.
Sea Level Rise Adaptation Planning
Sea Level Rise Adaptation PlanningAs evidenced by Climate Central’s ranking of U.S. cities vulnerable to sea level rise, Florida is the most vulnerable state in the U.S. to sea level rise, with its long, highly developed coastline, porous limestone bedrock, and exposure to tropical cyclones. More people and their property are at risk from sea level rise flooding in Florida than any other state.

We will use the document Sea Level Rise Vulnerability: Assessment Tools and Resources: A Guide for Florida's Local Governments (reading #2 in the Module 13 Road Map), as well as the more generalized materials from the Climate Resilience Toolkit to analyze and understand the planning process. The Florida guidebook provides guidance for approaching, developing, and completing sea-level rise risk and vulnerability analyses and scenarios and for incorporating the appropriate processes into local planning efforts. The document outlines the four major components or phases of sea level rise adaptation planning.

- Collaborate and define the planning context - This includes a survey of the physical, social, infrastructure, and environmental conditions (similar to your CVAT survey for the Capstone Project); determining goals, objectives, and principles; assembling a steering committee of community stakeholders and experts; and surveying past adaptation planning efforts.
- Identify your community’s vulnerabilities - A vulnerability (or risk) Assessment involves looking at the exposure, sensitivity, and adaptive capacity of the community (as described in detail in Module 11). There are many tools available to determine vulnerability. One example is the NOAA Sea Level Rise Viewer, which we used in Module 4 lab. In addition to visualization tools, modeling, and decision support tools are implemented.
- Determine strategies to address vulnerabilities - The development of adaptation strategies is based on the results of the vulnerability assessment. The strategies identified in this step can fall into several categories, including Protection, Accommodation, and Retreat. We considered protection, accommodation, and retreat strategies in Modules 8 (hard and soft engineering strategies), 9 (managed retreat strategies), and 10 (smart building).
- Implement - Implementation involves identifying and securing funding for implementing the strategies outlined in the third step. It also identifies who will perform implementation tasks, writing implementation plans, and determining how they will be integrated into existing plans, and how they will be evaluated.
Steps to Resilience
Steps to ResilienceThe Climate Resilience Toolkit provides more generalized, but clear guidance for communities working towards increasing climate resilience – in the face of many types of climate stressors. It provides excellent videos to explain each step in the process, which is similar to the Florida guidebook.
Take a look at the following pages of the Climate Resilience Toolkit.

The website provides clear guidance in a series of short videos that cover the “Steps to Resilience” and each step has an explanatory video. Please visit each page and watch the video for that step:
- Explore Hazards Explore Hazards
- Assess vulnerability and risks Assess vulnerability and risks;
- Investigate options; Investigate options
- Prioritize and plan Prioritize and plan and
- Take action Take action
Identifying Stakeholders
Identifying StakeholdersWho decides how to prepare for sea level rise?
During the adaptation planning process, organizers are encouraged to assemble a steering community of community stakeholders. Stakeholders are individuals or groups who have something of value that may be affected by coastal hazards or by the actions taken to manage coastal hazards.
This is a very important step to ensure the success of the adaptation planning process, which as we saw in the vignette about Toms River may be a contentious process if there are widely differing viewpoints among the stakeholders. Everyone living and working in a coastal community, as well as many organizations, local, state, and federal government entities, corporations, and other businesses operating in the community, have an interest in preparing for sea level rise.
It is important that there is a diverse representation on the stakeholder steering committee. Failure to respect the democratic process, by excluding stakeholders from the decision-making process can lead to negative consequences and distrust of government, among other things. Encouraging broad participation can result in better decisions in the long run. A diverse set of stakeholders can bring valuable wisdom beyond that held by specialists only, and provide essential information to the decision-making process.

Identifying stakeholders
Identifying which types of stakeholders should be included in sea level rise planning activities can be challenging. One approach is to begin by brainstorming a list of all persons or organizations in a community that may be affected either by sea level rise or by sea level rise policy. These people or organizations will usually live, work, or have some other significant presence in the community. However, it is sometimes advisable to include stakeholders from outside the community, such as representatives from the state or federal government. For example, if endangered sea turtles are known to nest along a U.S. community’s shore, then it may be helpful to include representatives from the U.S. Fish and Wildlife Service as a stakeholder in the planning process – particularly if protection strategies under discussion include sea walls or other strategies known to be harmful to the turtles.
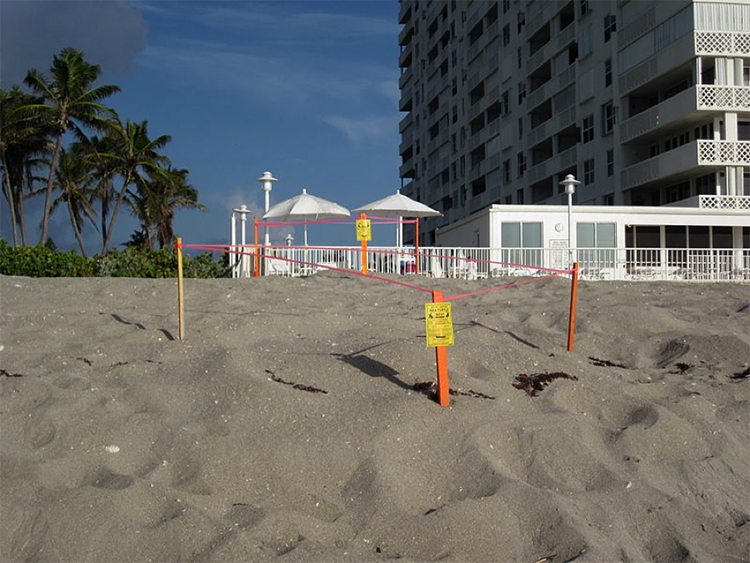
Learning Check Point
Florida Stakeholders
Required Reading
Take a few minutes to read, Up Against the Seawall, a news article about Florida stakeholders’ legal battles over beach erosion, sea wall construction, and sea turtle habitat.
Think about what you just learned, then answer the questions below. This exercise is not for credit, but you are required to understand this material for this module.
Participatory Planning Process
Participatory Planning Process
Bringing together a diverse set of stakeholders can prove challenging – especially for discussion of politically charged issues such as sea level rise. Participatory planning is one approach for bringing diverse and marginalized groups into the planning process while also avoiding conflict. The participatory planning approach emphasizes the participation of local stakeholders – that is, those people who live and work in the communities that will be directly affected by the adaptation or mitigation measures under discussion. Participatory planning empowers local stakeholders by directly involving them in the planning process. Planning workshops are led by skilled facilitators who design the meetings so that all people present have a voice by encouraging all the stakeholders to participate in brainstorming, investigating, and analyzing options for preparing for sea level rise (or other hazards). Stakeholders are generally asked to break into small groups to discuss these options before sharing their ideas about them with the facilitators and other groups. Stakeholders may then use cost-benefit analysis to choose which of these options are most suitable for their community.
For hazards such as sea level rise that have a strong spatial component, participatory planning exercises typically use interactive mapping tools, such as the NOAA Sea Level Rise Viewer, to help stakeholders better understand both the hazard and the options for addressing it. In participatory mapping, stakeholders interact with maps with information relevant to the planning task. Interactive, digital mapping tools are valuable for illustrating what the mapped area might look like under different hazard scenarios and planning options. Stakeholders then use these maps to explore these scenarios and options. Stakeholders may have the opportunity to annotate maps with questions, concerns, and other notes about how each combination of scenarios and options might affect a particular stakeholder or area of the community, and tp share these ideas with facilitators and other stakeholders. These maps will often show: which areas of the community are susceptible to flooding under different amounts of sea level rise (either on its own or in combination with storm surge); and how planning options (such as building a seawall or restoring wetlands) may mitigate this flooding. These interactive sea level rise maps are then used to determine where in the community these adaptation strategies and options are most needed or appropriate.

Considering Views of Vulnerable Stakeholders
Coastal communities often find that decisions about what people and places to protect first are particularly challenging. As discussed in Module 11, vulnerability provides one way to prioritize protection for different areas. By using the vulnerability scoping diagram (VSD; see Module 11) in participatory planning exercises, communities can encourage stakeholders to brainstorm components and measures for the three dimensions of vulnerability (exposure, sensitivity, and adaptive capacity). Completing the VSD in a public forum can help stakeholders and discussion leaders to better understand which dimensions and components of vulnerability different community members and experts believe are most important; measures for these most-important components can then be mapped to indicate areas that are most in need of protection. For example, if a participatory VSD indicates that community members see the exposure of low-lying areas to sea level rise-enhanced storm surge and sensitivity of low-income groups as the two most important components of vulnerability, then elevation and census data can be used to identify areas that are low-lying and have a high percentage of persons in poverty. These areas would then be given first priority when considering strategies for preparing for sea level rise and related coastal hazards.
Selecting Strategies
Selecting StrategiesCommunities can use two broad types of strategies for preparing for sea level rise and related hazards: structural and non-structural. Structural strategies involve direct manipulation of the coastal environment through the construction, removal, alteration, or restoration of coastal structures, including both human structures (such as homes, businesses, and sea walls) and natural structures (such as dunes, beaches, mangroves, and oyster beds). Non-structural strategies are changes to coastal policy that encourage citizens, businesses, and governments to take steps to protect themselves from sea level rise and related hazards, but do not require specific structural responses.
Structural Strategies
In Module 8, we explored various types of structural options for coastal protection, including hard and soft engineering. In Module 9, we explored several non-structural options that can be classified as managed retreat. In Module 10 we looked at smart building options, and in Module 12 we considered structural and non-structural mitigation policy. So, by now, you should have a good idea of the adaptation options available to a sea level rise planning group as they make their selections during the planning process.
Below, we have listed strategies and their potential costs and benefits.
| Structure Type | Potential costs | Potential benefits |
|---|---|---|
| Dikes | Vulnerable to wave action and erosion | Excellent protection against storm surge and moderate sea level rise |
| Seawalls | Expensive to build; enhances erosion on the seaward side of the wall; limits access to and views of the water | Strong protection against storm surge, waves, and sea level rise |
| Breakwaters | Provide only limited protection against storm surge and do not protect against sea level rise | Protect against waves and erosion |
| Groins | Encourage down-drift erosion | Provide limited protection against waves; can encourage up-drift accretion of sand and sediment |
| Jetties | Encourage down-drift erosion | Stabilize and protect navigation channels at river mouths and tidal inlets |
| Structure Type | Potential costs | Potential benefits |
|---|---|---|
| Living shoreline | Can be over-topped by high storm surge | Strong protection against erosion, moderate protection against low storm surge and wave action; if not blocked by roads, buildings or other impermeable cover, can retreat shoreward with sea level rise |
| Dune restoration | Subject to erosion, may periodically require expensive re-nourishment with sand | Provides strong protection against waves, most storm surge, and moderate sea level rise |
| Structure Type | Potential costs | Potential benefits |
|---|---|---|
| Managed retreat | Moving or demolishing the most vulnerable structures can be very financially expensive and can damage the local community and economy if not done with care and sensitivity | Can significantly reduce potential loss of life and property by moving homes and business out of the most exposed locations |
| Multi-layered protection | Generally more expensive and complicated to implement than single-layer strategies | Can significantly reduce exposure compared to single-layer strategies |
| Structure Type | Potential costs | Potential benefits |
|---|---|---|
| Elevated construction | May not protect against waves; can add significantly to cost of construction | Protects against storm surge, applicable to many different building types |
| Floating construction | Does not protect against wave damage; difficult to implement for many building types; difficult to connect utilities | Strong protection against storm surge and gradual sea level rise |
Non-Structural Strategies
| Non-structural strategy | Potential Costs | Potential Benefits |
|---|---|---|
| Insurance | Can encourage those who can afford premiums to remain in high-risk areas | Supports disaster recovery; can incentivize structural protections or retreat |
| Zoning | Rezoning or establishing special sea level rise overlay zones can be politically contentious, depending on the prohibitions and restrictions proposed for the new zones; zoning allowing or encouraging hard armoring can cause erosion and other negative environmental effects | Flexible tool that can prohibit new construction, rebuilding, or renovation in high risk areas; protect environmentally sensitive areas; or specify the types of structural protections that may be used in an area |
| Flood plain regulation | Often used to enforce building codes but not for more protective prohibitions/restrictions on construction; National Flood Insurance Program (NFIP) flood plain zones are based on historical flooding and do not account for sea level rise | Can be used to restrict what can be built in flood plains and/or how such structures can be built (e.g., elevation and anchoring requirements); required for community participation in NFIP |
| Building codes | Can be costly when retrofitting existing development; may provide inadequate protection for extreme sea level rise-enhanced storm surge events | Easy to implement for new development; can reduce insurance premiums |
| Tax breaks | Can reduce tax revenue | Can provide politically popular incentive to steer development away from high-risk areas |
| Direct payments | Direct payments for acquiring high-risk properties can be expensive; some property holders may not be willing to sell | Purchased land can be used for environmental restoration and can provide buffer against surge and erosion for adjacent properties |
| Real estate disclosures | Requires expensive sea level rise modeling to determine geographic extent of notification requirement; may reduce property values | Can discourage development in high-risk areas; can encourage buyers/developers to adopt flood protection measures |
Source: Non-structural strategies for preparing for sea level rise and related hazards. Costs and benefits based on Georgetown Climate Center’s Adaptation Tool Kit
Other Policy Options
Coastal communities also have several other non-structural policy options. They can use land-use management – including zoning and flood plain regulations – to limit or prohibit construction of new buildings (or post-disaster reconstruction of old ones) in areas where the risk of flooding due to sea level rise and related hazards is particularly high. Building codes can be used to require all new construction in high-risk areas to adopt specific structural improvements, such as elevating to a specific height on stilts or pilings. Communities can offer residents tax breaks or direct payments to restore natural shoreline protections, elevate or harden their homes or businesses, or move their homes and businesses to safer areas further inland. Communities can also require local real estate agents to disclose a property’s potential exposure to sea level rise and related hazards to any potential buyers. Such disclosure requirements can dissuade less risk-tolerant buyers from choosing property near the coast, but it may also reduce the value of property for current coastal landowners.
The next section describes how communities and their stakeholders can use cost-benefit analysis to rule out strategies that are not viable and arrive at a short list of strategies that are both suitable and desirable.
Cost-Benefit Analysis
Cost-Benefit AnalysisHow can stakeholders choose among these strategies?
One of the most frequently used methods for determining which strategies communities should use to prepare for sea level rise is cost-benefit analysis. Cost-benefit analysis is a systematic approach to decision-making that compares alternatives based on their ratio of benefits to costs. For example, imagine a community is choosing between managed retreat and beach nourishment/restoration as options for protecting a coastal development from sea level rise and other coastal hazards over the next ten years. For the managed retreat option, relocating homes and businesses further inland and converting coastal areas to parkland is expected to cost $4 billion, but the associated reduction in vulnerability and increased tourism from the new parks is expected to bring $6 billion in benefits over the next ten years. The ratio of benefits to costs for the managed retreat option would therefore be 6/4, or 1.5. For the beach nourishment/restoration option, adding millions of tons of sand to the beach is expected to cost $2 billion over ten years but will also bring $4 billion in benefits by reducing vulnerability and improving the recreational value of area beaches, for a benefit-to-cost ratio of 4/2, or 2. Because the ratio of benefits to costs for the next ten years is higher for the beach nourishment/restoration option (2) than for the managed retreat option (1.5), cost-benefit analysis suggests that, at least for the next decade, beach nourishment/restoration is the better strategy for protecting the community.


| Managed Retreat | Beach Nourishment/Restoration | |
|---|---|---|
| Total Costs | $4 billion | $2 billion |
| Total Benefits | $6 billion | $4 billion |
| Benefits/Cost Ratio | 1.5 | 2.0 |
Types of costs and benefits
As this example suggests, strategies for preparing for sea level rise can have many different types of costs and benefits, including changes to vulnerability and the local economy. The table below summarizes some of these possible costs and benefits.
| Possible Costs | Possible Benefits |
|---|---|
| New or continuing construction, maintenance, and operation costs | Avoided construction, maintenance, and operation costs |
| Economic costs | Economic benefits |
| Residual or increased vulnerability | Reduced vulnerability |
| Environmental degradation | Environmental benefits |
| Negative impacts on community design/livability | Improvements to community design/livability |
| Decreased equity | Increased equity |
| Inconsistency with local goals, plans | Consistency with local goals, plans |
Types of possible costs and benefits for sea level rise mitigation strategies. Adapted from “Urban Waterfront Adaptive Strategies,” City of New York Department of Planning, June 2013
This list is not exhaustive, but instead provides examples of the types of costs and benefits frequently considered when planning for sea level rise and related hazards. In a real participatory planning environment, stakeholders are often asked to brainstorm lists of possible costs and benefits, which may be more or less extensive than those listed here.
Quantitative or Qualitative
Quantitative or QualitativeCost-benefit Analysis: Quantitative or Qualitative?
Some of these costs and benefits can be assessed quantitatively in terms of dollars spent, saved, or earned. Construction, maintenance, and operation costs can be estimated and compared for different strategies: for example, the costs of continuing to replenish and maintain a sandy beach versus the cost of replacing it with a sea wall (including the cost of maintaining the sea wall and operating any gates or other features). Economic costs and benefits– including jobs created to build or maintain new infrastructure; impacts on major local industries such as shipping, fishing, or tourism; and effects on property values – can also be modeled, quantified, and compared.
However, other types of costs and benefits may not be easily assessed in dollar terms. Rather than use quantitative analysis, these benefits, and costs should be assessed qualitatively using a subjective scoring system. The first example in this section – reducing vulnerability by managing retreat or beach nourishment/restoration – is assumed to be quantifiable in terms of dollars saved. This may be true for the exposure component of vulnerability, which can be quantified in terms of changes in the number and value of homes and businesses exposed to sea level rise-enhanced flooding. However, it is much more difficult to assign a dollar value to changes in the social dimensions of vulnerability, such as the reductions to residents’ adaptive capacity that may occur if managed retreat from a coastal neighborhood disrupts social networks. Instead of assigning a dollar value to the residents’ adaptive capacity, stakeholders in a participatory planning exercise can assign subjective scores, perhaps by rating the costs and benefits for residents’ adaptive capacity on a scale of 1 to 10 for each policy option. Average cost and benefit scores are compared to determine which option would be most beneficial (or least costly) for adaptive capacity. These subjective cost-benefit scores can then be reweighted (multiplied by a constant value) so that they can be compared and combined with scores for other types of costs and benefits, including those assessed in dollar terms.
Like social vulnerability, environmental and design/livability costs and benefits can be challenging to quantify. For environmental costs and benefits, it may be possible to assign a dollar value using an ecosystem services model, which prices the cost or benefit of a change to environmental functions in terms of its value to society. For example, the environmental benefits of a strategy that maintains or increases the extent of coastal wetlands could be quantified in terms of the wetland’s increased ability both to protect coastal property from storm surge and to provide habitat for commercially valuable fish.

In Module 9 we looked at an example of cost-benefit analysis for managed realignment in the United Kingdom and considered the benefits of ecological services provided by coastal marshes, and how they add to the benefits of managed realignment projects.
However, this increase in wetlands could provide other benefits – such as habitat for an endangered species – that are more difficult to quantify. Similarly, impacts of a strategy on community design/livability – such as making a community more attractive and walkable or providing better access to amenities such as grocery stores or public transportation – could be quantified in terms of changes in public health and transportation costs, but aesthetic considerations would remain highly subjective and are better assessed qualitatively.
Costs and benefits associated with equity and compatibility with local plans and goals may be the most difficult to quantify. Equity considers who will pay and who will benefit from implementing a given strategy. For example, although a cost-benefit analysis may show that the benefits of a particular strategy far outweigh the costs, equity considerations may reveal that wealthy landowners or corporations will receive most of the benefits, while the most vulnerable and disadvantaged stakeholders will bear most of the costs. In this situation, stakeholders may decide that the large decreases in equity associated with implementing such a strategy outweigh its other benefits.
As we saw with the example of Toms River, NJ, strategies for preparing for sea level rise can be seen as an obstacle to existing plans or goals – such as attracting new businesses, maintaining tourism, or increasing the stock of affordable housing, and can complicate cost-benefit analysis. If stakeholders oppose a strategy due to these conflicts, the strategy could be ranked higher in the cost column than if there were no conflicts of this kind.
Modeling Costs and Benefits for Coupled Human-Environment Systems
Modeling Costs and Benefits for Coupled Human-Environment SystemsComputer models are an essential tool for studying costs and benefits. Physical models of the ocean and shoreline can be used to study how protective structures such as sea walls and levees can reshape the coastline by changing currents, waves, and erosion. From the outputs of these models, scientists can calculate costs and benefits in terms of losses or gains in coastal property, in amenities such as beaches, or in habitat. Economic or demographic models can then be used to study how these changes in coastal processes, landforms, and ecosystems may interact with the local economy or population trends, potentially resulting in additional costs or benefits (such as increasing poverty or growing the tax base). Urban planning and design models can assess the effects of these changes in the physical and social environment on urban spaces, including changes in traffic patterns on city streets or in sight lines (views) from scenic coastal hotels or parks.

As these examples suggest, human and environmental systems in the coastal zone are closely coupled: human actions reshape the natural environment, and changes in the natural environment reshape human communities and infrastructure. Therefore, to understand the costs or benefits of a proposed strategy for preparing for sea level rise and related hazards, scientists and decision-makers should consider these complex, reciprocal interactions between human and environmental processes. Because computer models are able to capture these complex interactions, they are often one of the best tools for understanding the costs and benefits that these interactions may cause. Models may be particularly useful when attempting to understand whether combining two or more sea level rise strategies will change the human-environment system in ways that lead to unexpected costs or synergistic benefits. The next section considers some of the possible benefits of combining strategies. Fittingly, coming near the end of the course, this is one of the most advanced views of the Earth System we have had this semester.
Combining Strategies
Combining StrategiesThe above discussion shows how cost-benefit analysis can be used to compare individual strategies for preparing for sea level rise and related coastal hazards. However, the most cost-effective option is often not a single strategy, but a combination of synergistic strategies. For example, when used alone, breakwaters or artificial reefs can be used to slow coastal erosion, but are not effective at preventing flooding due to sea level rise and storm surge. However, these strategies can be combined with other complementary strategies – such as levees or beach/dune reconstruction – that can mitigate sea level rise and storm surge flooding but are not as good at slowing coastal erosion. Combining strategies can also be an effective way to meet multiple design goals. For example, including a waterfront park in a plan for managed retreat can reduce the exposure of coastal infrastructure to flooding while also fulfilling other goals, such as creating new space for recreation and environmental restoration.
Learning Check Point
This exercise is not for credit, but you are required to understand this material for the formal assessments in this module.
Stakeholders in Ventura, California have chosen to combine several strategies for reducing erosion at Surfer’s Point.

Re-visit this NOAA article, which was also presented in Module 9, Restoring Surfer's Point, then answer the following questions:
In addition to the benefits of implementing complementary strategies in one place, communities should also recognize that the types of strategies that are most beneficial will vary from place to place across the community’s jurisdiction – strategies that are highly beneficial in one area of the community may not be as beneficial in another, and may even be harmful. Thus, communities should consider adopting not only multiple complementary strategies in one area, but also different sets of complementary strategies for different areas. The next section discusses how communities, governments, and stakeholders can use geographic information systems to better understand how differences in the social and physical landscape across their jurisdiction may affect the suitability of these strategies from place to place.
Learning Check Point
Learning Check PointPlease take a few moments to think about what you just learned, then answer the following questions to test your knowledge.
Symbolic and Cultural Considerations
Symbolic and Cultural ConsiderationsSeveral factors can complicate the use of vulnerability to prioritize areas for protection. A vulnerability assessment may not capture the symbolic or cultural importance of community landmarks, which can be difficult to measure or compare from place to place. Community surveys or qualitative rankings (such as those performed using a subjective scoring system in a qualitative cost-benefit analysis, as discussed above) can give a sense of how strongly a community values such landmarks. These surveys and rankings may reveal a consensus about the importance of these landmarks. But they can also uncover deep cultural divides about their value: a building that is a treasured part of the history or identity of one stakeholder group may be an eyesore for another.

Moreover, even within a vulnerability framework, different stakeholders may emphasize different dimensions of vulnerability, leading to disagreements about how to prioritize protections. For example, one stakeholder group may advocate prioritizing protection for areas where the dollar value of exposed infrastructure is highest, another may suggest prioritizing protection for sensitive infrastructure such as water treatment plants, while a third may prefer giving priority to assisting persons with low adaptive capacity (such as many of the poor and elderly). In some cases, communities may be able to combine protection strategies to address the priorities and vulnerabilities of multiple stakeholders; in other cases, cost-benefit analysis may need to be used with public deliberation to identify which people and places should be protected first, and which strategies should be used to protect them.
Learning Check Point
Please take a few moments to think about what you just learned, then answer the following question to test your knowledge.
Setting Timeframes for Implementation
Setting Timeframes for ImplementationWhen should these strategies be implemented?
After community leaders and stakeholders have determined which people and places to protect and identified possible strategies for protecting them, they should consider the timeframe for implementing these strategies. Because sea levels are rising in most places, strategies that are effective today may not provide adequate protection from tides, waves, and surges in 25, 50, or 100 years. Moreover, many strategies degrade over time, requiring frequent maintenance to retain even current levels of protection; beaches may require to be nourished yearly to replace sand that has eroded away, and levees may need to be reinforced and heightened periodically to combat erosion and subsidence.
For these reasons, the cost-benefit analysis for protection strategies often considers their entire projected lifetime. This includes not only present-day benefits and construction or implementation costs but also future maintenance costs and changes in benefits as sea level rises. Because the costs and benefits of coastal protection strategies will change over time, strategies with the best ratio of benefits to costs in the near term may not be the best choice for long-term protection. For example, researchers have found that for New York City, a hybrid strategy that combines elevating vulnerable structures with targeted protections to critical infrastructure and limited use of levees and beach nourishment to be the most cost-effective option for protecting against sea level rise-enhanced storm surge through mid-century. However, after mid-century, the researchers found that it may become more cost-effective to build sea walls to protect portions of New York Bay.
Mandatory Reading
To learn more about research comparing the costs and benefits of different strategies for protecting New York City from storm surge and sea level rise, read the Scientific American article Massive Seawall May Be Needed to Keep New York City Dry which discusses several possible strategies for protecting New York City. These strategies could include a sea wall across the Verrazano Narrows like the one shown in the video rendering below.
Video: Stormvloedkering Hudson New York voor ARCADIS (00:29) (Video is not narrated.)
Learning Check Point
After reading the article, answer the following questions.
Adaptive Management
Adaptive ManagementFor now, New York City has chosen to adopt protections similar to those outlined in the hybrid strategy. Why would the City choose a strategy that is beneficial now, but may not be cost-effective in the future? One reason may be that people often give more weight to present-day costs and benefits than to future costs and benefits. Recognizing this difference between present value and future value, economists have developed a technique called discounting that decreases the value of future costs and benefits at a constant rate. This means that costs or benefits that will not occur for many decades are given much less weight in the cost-benefit analysis than costs or benefits that will occur in the next few days, weeks, or years. When discounting is applied, the rationale for New York City’s decision is clearer. Building a sea wall now would be very costly, requiring large expenditures in the short-term. While the benefits of building the sea wall could be large in the long-term, these benefits will not be realized for some time, and are therefore offset by the significant upfront costs.

As this New York City example illustrates, it can often be advantageous for communities to switch from one strategy to another as costs and benefits change. An adaptive management approach to preparing for sea level rise can help communities to identify opportunities to adopt new strategies or to adjust strategies already in place as conditions and goals change. In the adaptive management cycle, stakeholders and experts work together to monitor the effects of implementing coastal protection strategies on natural and human systems. Based on this monitoring, they learn which strategies are furthering or frustrating design goals (such as protecting neighborhoods from flooding or restoring coastal habitat) and share this learning with policymakers by suggesting changes or adjustments in strategies.

(In the center of the cycle are the words Conservation, Measures, Partnership, Open Standards. In a circle of 1-5, and continuing on to 1 again - the cycle contains the following text :
- Conceptualize
- Define initial team
- Define scope, vision, targets
- Identify critical threats
- Complete situation analysis
- Plan Actions and Monitoring
- Develop goals, strategies, assumptions, and objectives
- Develop monitoring plan
- Develop operational plan
- Implement Actions and Monitoring
- Develop work plan and timeline
- Develop and refine budget
- Implement plans
- Analyze, Use, Adapt
- Prepare data for analysis
- Analyze results
- Adapt strategic plan
- Capture and Share Learning
- Document learning
- Share learning
- Create learning environment
In the context of climate-change related hazards such as sea level rise, adaptive management is often supplemented with flexible adaptation pathways: plans that show how existing strategies for adapting to sea level rise can be supplemented, adjusted, or replaced with other strategies in the future as conditions change. By building flexibility into the planning process to allow easy transition from one strategic pathway to another, these pathways can help communities adopt the most cost effective strategies now, while keep their options open for the future.

Learning Check Point
Please take a few moments to think about what you just learned, then answer the following questions to test your knowledge.
Case Study: Miami, Florida
Case Study: Miami, FloridaOf the major U.S. cities that face the greatest uncertainty related to sea level rise, Miami may be the poster child. The greater Miami area of south Florida faces higher than average sea level rise rates due to its location on the Atlantic seaboard (see Module 4). This, along with its low-lying topography and its porous limestone geology, all conspire to create a very uncertain future for the metropolitan area of more than 6 million. Examination of any maps of projected sea level rise in south Florida should set alarms ringing for the viewer. Take a look at this animation of sea level rise based on data from the Green Policy 360.

Part of the metro region, Miami Beach is a city of 91,700 people situated on a barrier island connected to the mainland and the city of Miami by bridges. Most people associate Miami Beach with glitzy wealth, beautiful Atlantic beaches, and a tropical climate. They may not be aware of the challenges associated with the rising seas coupled with the geography and geology of the area.
The geology of this part of Florida makes it especially susceptible to sea level rise related issues. The Florida peninsula is composed of a limestone platform, and the barrier shoreline that Miami Beach occupies sits upon this platform. In addition, the Florida peninsula is low in elevation and Miami Beach has a maximum elevation of only a little over 1.5 m. The lowest elevations are on the bay side of Miami Beach. This is the area discussed in the video “Is Miami Doomed?”. You can explore the effects of sea level rise on Miami Beach at the NOAA Sea Level Rise Viewer, which allow you to search for a location and manipulate projected sea levels and visualize the effects on the chosen location.
In addition, the geology presents other challenges: the oolite limestone platform is highly porous, so seawater can infiltrate beneath the ground and come up from below during high tides. Furthermore, the design of the older drainage systems that rely on gravity flow to the ocean has resulted in seawater backing up onto roadways during high tides. This adds to the effects of “sunny day flooding” which Miami is becoming accustomed to. The porous nature of the limestone geology also precludes using methods like levees and dikes to hold back rising seas, as the water just migrates under any structures put in its way.
Let’s consider some of the reasons behind the sunny day flooding and king tides that are disrupting the utopic life there. First, of course, is sea level rise. We learned in Module 4 that parts of the east coast of the U.S. are suffering from greater rates of sea level rise than most places. And Miami is one of these locations. Research has shown that in addition to eustatic sea level rise, there is a combination of other factors contributing to sea level rise along the southeastern coast of the U.S. In addition, there are king tides, which occur seasonally, during the fall and early winter. King tides are a natural phenomenon determined by the predictable movements of the Earth, Moon, and Sun, but exacerbated by local weather patterns and regional ocean conditions. King tides occur when the Earth, Moon, and Sun are aligned at perigee (Moon is closest to the Earth) and perihelion (Earth is close to the Sun). These conditions result in the largest tidal range seen over the course of a year. These factors, combined with a unique set of regional geological characteristics, and high exposure to tropical cyclone storm surges, make south Florida a highly sea-level challenged part of the U.S.
How sustainable is the economic powerhouse of Miami Beach? What future lies ahead, and for how long can business as usual be maintained? What adaptation plans are being made?
The flooding experienced today in Miami is just the beginning, given the sea level rise projections we have already discussed. In the 2016 Atlantic video, Is Miami Doomed? The mayor and city manager of Miami Beach both sound optimistic and are pushing forward with innovative ideas for adaptation, such as the installation of pumps, raising road levels, etc. The drainage systems are being redesigned with pumps to return the water to the ocean.
But this video avoids some difficult questions about the complexity, costs, and sustainability of these approaches. To begin, there is the question of scale. It seems foolish to think that the whole of the city of Miami Beach can be raised in elevation, not to mention the rest of the city of Miami. Many other authors and experts have raised important questions about how long reliance on pumping water out into Biscayne Bay and other current approaches can last as sea levels rise. The larger policy questions of how to maintain the infrastructure such as sewage and drinking water, etc., and provide an equitable quality of life for all citizens in the future loom over Miami.
Miami Dade County Adaptation Planning
Miami Dade County Adaptation PlanningPlease explore this Story Map of Miami Dade County resiliency planning areas. It sets out the problem and shows examples of the solutions that are currently in process. As you read about each approach, try to envision how this approach may work in 30 or 50 years from now with projected rates of sea level rise. Make notes about each on and complete the Learning Check Point below.
Learning Check Point
To explore these approaches in more detail, go to Miami Dade County’s Sea Level Rise and Flooding.
Clearly, the costs associated with some of these adaptation plans going forward are astronomical. The question of how they will be funded, even in a city of great wealth, such as Miami, is a difficult one. Miami has begun to address the issue of raising funds to pay for infrastructure adaptation with a $400 Million Miami Forever Bond, which is helping to pay for infrastructure upgrades. But also, rate increases for sewage treatment are necessary, pointing to many difficult financial decisions for city leaders.
Environmental fellows from Harvard Kennedy School of public policy examine important policy and funding aspects for adaptation action for Miami in this article: Rising Seas, Sinking Infrastructure: Miami’s Climate Conundrum
The opening video asks:
- How can Miami protect $3.5 trillion in exposed assets due to climate by 2070?
- What are policymakers doing to address aging infrastructure?
- How can the public be engaged in planning for a different future?
In conclusion, the Kennedy School’s writers recommend the following actions for Miami and other coastal cities:
“Addressing such a daunting problem requires a coordinated strategy, drawing expertise from a diverse array of stakeholders. Cities facing similar challenges should start by taking the following actions:
Expand the group of “decision makers” to include those who aren’t normally offered a seat at the technocrat’s table. Expertise from all angles is necessary to communicate the issues as they relate to people’s daily lives, and then inspire collective action. It is also important that resources are allocated with an eye towards equity, justice, and public health.”
- Establish consensus on sea-level rise projections. Decision-making agencies should use the same future projections and build these into planning. The Southeast Florida Regional Climate Change Compact has implemented unified sea level rise projections.
- Develop a standard operating procedure around classifying asset risk. Decide whether to harden to high, medium, or low sea-level rise projections based on the asset’s importance and its exposure during smaller flood events versus Category 5 hurricanes.
- Consider whether to allocate a portion of the regular capital budget to adaptation projects, or whether to develop an entirely separate climate adaptation budget and funding stream, such as through a bond measure.
- Emphasize the importance of long-term thinking. Almost half of city mayors are elected to two-year terms. Calling for changes that benefit residents in fifty years becomes difficult if residents vote based on short-term actions.
Learning Check Point
Reading the article Rising Seas, Sinking Infrastructure: Miami’s Climate Conundrum. The article states: “Incremental infrastructure investments are an improvement, but difficult questions remain. Climate change may cause between 2.5 and 6.75 feet of sea level rise in Miami by 2100.[7] Some experts project even higher levels...” Make a list of the difficult questions as you see them, then complete the Learning Check Point activity below.
Case Study: The Island Nations: Life on Coral Atoll Islands in a World of Rising Sea Level
Case Study: The Island Nations: Life on Coral Atoll Islands in a World of Rising Sea LevelThe Maldive Islands in the Indian Ocean and other low-lying island nations such as the Marshall Islands and others in the Pacific Ocean all face extreme sea level rise risk and are addressing the problem in a variety of ways. The Maldives, the Marshall Islands, and several other island nations are made up of numerous coral atolls, each including several islands of varying sizes. All the islands are very low profile, with elevations usually of no more than two meters. They are currently facing multiple sustainability issues due to sea level rise, with some residents seeing only a future of migration away from their island homes.
The simple issue of frequent tidal flooding and accompanying shoreline erosion and loss of livable land area is compounded by the more complex problems related to salt water intrusion into the freshwater lenses that the islanders depend upon for their drinking water. Chapter 8 of Jeff Goodell’s book, “The Water Will Come” discusses in detail the issues of the Marshall Islands. He says of the groundwater supply: “The problem is, as seas rise, the salt water pushes up from below, leaving less and less room for freshwater (which, being more buoyant, rides on top of the salt water). In addition, as the seas rise, flooding from storm surges is likely to become more common. When an atoll is inundated, the salt water can seep into the freshwater lens, contaminating it. It can take years before it is suitable for drinking again." (Goodell, 2017).
Meanwhile, the Maldive Islands, which comprise 1,200 islands on 26 atolls, face similar challenges. In fact, the capital of the Maldives, Malé, sits on the most densely populated island in the world. As the image below illustrates, the whole island is completely developed. Drinking water is desalinated by reverse osmosis using brackish groundwater, which is pumped from 50-60 meter wells. Malé is the center of all commercial activities of the Maldives. The main industry of the Maldives is tourism, comprising 28% of the nation’s GDP. According to the United Nations Development Programme (UNDP) “Given that these reefs support both the country’s tourism and fisheries industries upon which the people depend almost exclusively, climate change is a profound threat to its very economic base.”
Understandably, the government leaders of these island nations have a great interest in how the world is addressing climate change, since they are on the front line in the sea level rise battle, with everything to lose, while contributing very little to the global anthropogenic causes of climate change. One approach of the presidents and prime ministers of these island nations has been to work hard to get the attention of the rest of the world and push for policies that reduce greenhouse gas emissions. This has had limited success and caused plenty of frustration. Meanwhile, adaptation policy options are limited. The islands are small and low in elevation, while economic opportunities for residents are limited and affected by climate change. Therefore, migration is often the best adaptation option. A United Nations report analyzed the migration patterns and modeled migration and population projections to 2055 for several Pacific Island nations. The study found that for Tuvalu, which has a current population of a little less than 11,000 people, 70% of households surveyed felt that migration would be necessary if sea level rise impacts worsened and that 15% of the population had migrated internationally between 2005 and 2015. The Modeling indicated that the migration rate (both internally and internationally) will roughly double by 2055. The reasons for migration included climate change-related impacts but also economic needs, which can be related as climate change affects agriculture and fisheries. So, from this information, we can see that sea level rise is one of a complex of related stressors for the people of island nations like Tuvalu.


International Politics of Sea Level Rise – The Maldives and Kiribati
The New Scientist article, On front line of climate change as Maldives fights rising seas, discusses recent developments in the efforts in the Maldives to plan for the future. The current president of the Maldives is pushing for rapid land reclamation using sediment dredged from existing atolls and pumped to create new islands as sea levels rise. To fund this expensive method of land reclamation, the Maldives government is negotiating a lucrative deal with the Saudi government to lease the Faafal Atoll for shipping security purposes and tourism. While proponents tout this method as a simple solution that will avoid migration away from the Maldives, there are many resulting conflicts. Thousands of residents would actually be displaced to other islands as a result of this dredging project, raising societal concerns. Also, the deposition of sediment onto coral reefs smothers and damages the reefs themselves.
Meanwhile, in Kiribati, a similar scenario is playing out. As reported in the Guardian: Kiribati’s president’s plans to raise islands in the fight against sea-level rise, the newly elected president of Kiribati is focusing heavily on increasing island elevation using dredging and construction of causeways to connect islands. There are international politics and security questions being raised about these plans, including concerns from the U.S. that China may have strategic and military interests in the region and the U.S. naval base in Hawaii is only 2,000 km (1,243 miles away). This complex issue is developing, so stay aware.
These examples reveal the extreme lengths to which the low-lying island nations of the world must go if they are to survive a future of rising sea levels. The structural mitigation measures discussed above may also need to be considered a short-term solution to prolong the sustainability of communities on these islands. Depending on the future rates of sea level rise, conditions may prove untenable in the 22nd century or before, if ways to sustain essentials such as freshwater supplies for human consumption and agriculture cannot be maintained.
Natural Regeneration of Reef Islands
The National Geographic article, Will Pacific Island Nations Disappear as Seas Rise? Maybe Not provides a very clear description of the situation for the island nations, with the prime minister of the island nation of Tuvalu pleading his case to the United Nations for a nation in danger of disappearing due to sea level rise. The article details an interesting contribution to the conversation about the future of coral atoll islands from coastal geomorphologist Paul Kench, of the University of Auckland's School of Environment, and colleagues in Australia and Fiji, who have been studying how coral atoll islands respond to sea level rise. Their research suggests that, left in their natural state, coral atolls can grow in elevation and keep pace with sea level rise, when left unaltered by human activity. They have measured this growth and reported that only 20% of the islands studied decreased in size during the time period considered. The islands that are heavily populated and altered by human infrastructure, not surprisingly, are the ones deemed unsustainable in terms of ability to naturally keep up with environmental changes, while sparsely populated, less developed islands can more easily keep up with the pace of sea level rise with natural processes.
Learning Check Point
Regarding research conducted by Paul Kench and other researchers, the article states: “They found that reef islands change shape and move around in response to shifting sediments, and that many of them are growing in size, not shrinking, as sea level inches upward”. And “Their analysis, which now extends to more than 600 coral reef islands in the Pacific and Indian Oceans, indicates that about 80 percent of the islands have remained stable or increased in size (roughly 40 percent in each category)”.
Case Study: New York City and Sea Level Rise Adaptation Planning
Case Study: New York City and Sea Level Rise Adaptation PlanningNew York City has a high level of exposure to sea level rise due to its coastal location on the Hudson estuary and its barrier shoreline on the Atlantic Ocean, but its status as the most densely populated city in the U.S. makes it particularly vulnerable in comparison to other coastal cities with similar geographies. Hurricane Sandy shut down New York, cut power for days or weeks to hundreds of thousands of people, flooded homes and businesses in Manhattan, Staten Island, Queens, and many other areas, and caused $19 billion in damages and economic losses and at least 44 deaths of city residents. The New York Stock Exchange closed for two days, sending economic shockwaves worldwide. The Subway and all of the road tunnels connecting Manhattan island to the mainland were flooded and disabled. One thing Sandy also achieved was to focus public attention on the vulnerability to storm surges and sea level rise of the economic center of the U.S. In the years since Hurricane Sandy in 2012, a great deal of work has been done to address New York’s vulnerability to flooding from storm surge and sea level rise. There have been multiple proposals, plans, and strategies considered for increasing New York’s climate change resilience through adaptation.

Some of the major concerns that are being addressed in the planning process are:
- As sea levels rise the number of people living within 100-year (1% annual chance of flooding) flood zone areas will increase significantly. The number is estimated at 20 million by 2050. This will necessitate many more property buyouts such as those that took place after Hurricane Sandy.
- Water treatment plants (an estimated 40%) will be compromised by flooding, increasing the risk of contamination.
- Power plants (an estimated 60%) will need to be relocated, flood proofed, or elevated to avoid flooding, which would threaten the city’s power supply, especially during high water times.
- Transportation systems will need to be upgraded to avoid regular flooding. This includes highways, airports, bridges, tunnels, subways, and railroads.
Other areas of essential infrastructures, such as the Meadowlands in New Jersey, will flood. This area of warehouses, railroad yards, and other important commercial infrastructure is slated for conversion to a national park in the future.
Plans for addressing the increasing threats of flooding include:
- Designs for large barrier systems to protect the city by blocking the storm surges and from the Atlantic Ocean from entering New York Harbor;
- Designs for rethinking the land use of Manhattan and surrounding boroughs, returning some areas to green space.
- Increased number of property buyout projects. During the recovery period following Sandy New York state encouraged homeowners who qualified to participate in a property buy-out program, an example of managed retreat, as described in Module 9. Hundreds of homeowners, including those in Staten Island communities, chose to do so and move to safer locations and the neighborhoods where their houses once stood have been returned to nature, providing tidal flooding buffer zones.
Visit New York’s Fourth Regional Plan to read more details about how this planning process is playing out. This page addresses protecting coastal communities from storms and flooding. An important aspect included in the page linked here is ensuring that the planning process is equitable for all members of the communities it affects. The physical exposure and social exposure maps illustrate where socially at-risk communities are located in relation to the physical exposure to flooding. This consideration was discussed in Module 11 and will also be the focus of Module 13 lab. So where does New York City stand in terms of sea level rise adaptation policy after years of planning? All of the plans are at some stage in the process of becoming reality, but in many cases, they have not yet moved into implementation as the projects involve years of design and community input and are extremely expensive so full funding is hard to achieve. As outlined in the MIT Technology Review article The "mind-boggling" task of protecting New York City from rising seas, although New York is ahead of most coastal cities in climate change adaptation planning, none of the big ideas that were funded by the federal government as a result of the Rebuild by Design competition for Manhattan have actually begun construction, but we will see construction soon.
For residents of Manhattan, the focus has been on the plans to create a 10-mile perimeter of multi-use waterfront space around Lower Manhattan that includes a combination of flood protection and green space that can absorb flood waters when inundation occurs. This project began with the Rebuild by Design Competition where design companies were invited to submit proposals for flood resiliency plans for lower Manhattan. Proposals were chosen and teams formed to create the designs. The design firm Bjarke Ingels won the contract to develop the design and the proposed project became known as the “Big U”. Years of planning, design work, and community stakeholder input through facilitated workshops took place and the completed plan was presented to the city. As the video linked below outlines the city is now beginning the implementation of the plan, but with major changes, with which some of those involved in the complex planning process are not entirely happy. The video explains the steps and shows maps of the designs, which include a fringe green space around the lower part of the city, with elevated berms to hold back the water as well as lower elevations designed to flood at times of high water. Stakeholder input ensured that the needs of all sectors of the community were met. An emphasis was placed on public access so that the whole project provided recreational opportunities for city residents and visitors.
Video: The Big U | Going In With Brian Vines (9:52)
New York City and Sea Level Rise Adaptation Planning
Laura Starr, Founder, Starr Whitehouse Landscape Architects, and Planners: After Hurricane Katrina, I think the entire United States was really surprised and could not believe what happened. And then when Hurricane Sandy hit the Northeast United States, I think that was a real turning point in realizing that our communities need to be built differently and we need to start building stronger.
So where we are now is the highest point of the park. And so from here, as the park slopes towards the west and towards the south and east, it starts to get lower and lower, and lower till it's really in the floodplain. When Sandy happened, maybe about 15 percent of this park was flooded and Starr White House has been working in this park for 22 years and we're very familiar with the park, its histor,y it's use and its topography. And so, you know, this became one of the many areas we focused on when we were first asked to get involved in the response to Hurricane Sandy effort.
A man speaking: Today we announced a plan unlike anything that has been done before in terms of its scope, in terms of its impact. This is a plan that will protect Lower Manhattan for the remainder of this century, all the way to 2100, and in fact beyond.
Jainey Bavishi, Director of the NYC Mayor's Office of Recovery and Resiliency: The mayor's office of resiliency is responsible for preparing the city for the unprecedented challenge of climate change and we're doing that in multiple ways. In Lower Manhattan, we have several major initiatives underway. One is the Eastside Coastal Resiliency Project which is a two and a half-mile project that runs from Montgomery Street up to East 25th Street. And then another major initiative is the Lower Manhattan Coastal Resiliency Initiative which includes four infrastructure projects that are in design, or completed, or will be moving into construction by the end of this administration, to protect 70% of lower Manhattan. And then we're also launching a master planning effort to extend the shoreline of the seaport and the financial district to protect the other 30% of Lower Manhattan. The original concept for these projects actually came from a proposal known as the Big U, which was developed by an independent design firm called the Bjakre Ingles Group. They submitted the concept to respond to the Rebuild by Design competition.
Amy Chester, Managing Director, Rebuild by Design: Rebuild by Design began after Hurricane Sandy as an initiative of HUD, which is a federal government, and President Obama's Hurricane Sandy Task Force. And the initial idea was that Rebuild by Design would be a collaborative way that communities can get together with local governments and designers, in a competition forum, to address the vulnerabilities that were exposed during Hurricane Sandy.
Laura Starr, Founder, Starr Whitehouse Landscape Architects, and Planners: If over time, we want to create this kind of higher ground along here, it's actually very complicated to figure out. How do you keep out the sea, while enabling this easy flow of people to enjoy the largest green space down here?
Amy Chester, Managing Director, Rebuild by Design: Architects and engineers and landscape architectures and scientists and academics and community specialists would come together, form teams, and compete. 148 applied and 10 were chosen.
Laura Starr, Founder, Starr Whitehouse Landscape Architects, and Planners: We were invited onto the team with Bjakre Ingles Group, with Big, to be part of their team. And the first part of the competition was to do research on different areas that had flooded, all the way from southern New Jersey to Connecticut. Quickly Lower Manhattan became the mission of the Big team. And then Big, who is so fantastic at branding, came up with The Big U to call this 10-mile u-shaped line of vulnerable areas around the shoreline of Lower Manhattan.
Amy Chester, Managing Director, Rebuild by Design: So each team then started working with specific local communities in that geography to further create what we call design opportunities.
Trevor Holland, Chair, Community Board 3, Parks and Waterfront Committee: Personally, I've been involved with Resiliency for Community birth three for almost seven years - going back actually before Sandy and after.
Man announcing: Alright everyone we are going to start the next meeting. Welcome to our Parks and Recreation (inaudible).
Trevor Holland, Chair, Community Board 3, Parks and Waterfront Committee: A lot of the work we do is to take the input from the community and sort of formulate resolutions based on the information we get. Since Sandy, we've been tasked with handling a variety of resiliency projects including the ESCR.
Laura Starr, Founder, Starr Whitehouse Landscape Architects, and Planners: Big has this huge model making operation. So we had this idea of taking the design studio to the community
Damaris Reyes, Executive Director, Good Old Lower East Side: Designers and other folks would come with preliminary designs, ask the community a bunch of questions. Then they would come back again and present, you know, how they sort of took that feedback and put it into the plan. And then ask even more questions.
Laura Starr, Founder, Starr Whitehouse Landscape Architects, and Planners: We ended up with a system of what we call integrated flood protection all along the waterfront, taking each segment and each neighborhood on its own terms.
Damaris Reyes, Executive Director, Good Old Lower East Side: Even if it was like we need to put the bike lane here, or we need to raise the berm over here, or this is the kind of programming we'd like to have, people saw that in the designs.
Amy Chester, Managing Director, Rebuild by Design: After the competition had awarded each of the projects different amounts, from ten million to three hundred and thirty five million, and the Big U got three hundred thirty-five million.
Laura Starr, Founder, Starr Whitehouse Landscape Architects, and Planners: Oh well what happened next was the city took the money and they put out a request for proposals to implement it. But they put the request for proposals out to one of the city agencies on-call engineering teams, which we were not on one of. So then now other people are working on the implementation. To have this much knowledge, and to spend this much time working on something, and to sort of, as Big calls me, the Midwife of the Big U, you know to have that role and then to be, you know, not able to work on it, it's a shame.
Woman, name unknown: I think it's important to realize that the Big U was a concept. The Big U inspired the eastside coastal resiliency project. The city has moved forward with planning and engineering analysis for that project, so this plan that were proposed, that we're presenting now, takes that conversation forward and proposes projects that we can actually implement.
Damaris Reyes, Executive Director, Good Old Lower East Side: We'd really gotten really far with finally working in partnership with some of the city agencies and other folks, seeing real dollars put behind our ideas, until the project was about to go into the city's uniform land-use review process. They were just about to start that process when everything stopped. And everything went quiet until September. And in September they came back with an entirely different design and everybody went crazy.
Man speaking (inaudible)
Diane Lake, Community Resident: The city and the community collaborated for about five years on a plan, a resiliency plan, that would be really effective, that would really keep the neighborhood safe. But then abruptly,with no warning, it was set aside and a new plan was put in place that calls for the complete closure of almost three miles of coastline and parkland. So all of that space will suddenly be unavailable, they're saying for three and a half years, but I think you're heard tonight that we're afraid it's gonna be more like six, seven, ten.
Damaris Reyes, Executive Director, Good Old Lower East Side: We have a very torn apart community behind this new design. They feel that trees are gonna be killed, species are gonna be killed.
Jainey Bavishi, Director of the NYC Mayor's Office of Recovery and Resiliency: We want to make sure that, you know, the community has a chance to shape exactly what that looks like and also provide input on what other benefits they would like to see as part of these projects. East Side Coastal Resiliency is a great example of this. Not only will the community get the flood protection that they really need, but also they'll have improved waterfront access. We're rebuilding several of the pedestrian bridges that go over the FDR into the East River Park and they'll have a new Park.
Trevor Holland, Chair, Community Board 3, Parks and Waterfront Committee: I think people need to examine, okay the city did flip the plan but is it actually a better plan? I think we've gotten to a point now where we still have problems with the way the city handled this, but we've looked at the plan and we've looked at the benefits of plan and said that with some mitigations, and some concessions, that it may actually be a better plan for the community.
Damaris Reyes, Executive Director, Good Old Lower East Side: So we were told a bunch of different reasons why it needed to be changed. The problem was that we were told after. We weren't consulted, we weren't included, and people felt very disrespected.
Diane Lake, Community Resident: We want them to listen to us about how important that open space is for us, particularly for our seniors and our kids, and work together with us to come up with a modification of this plan that looks out for those people, rather than just shoving this plan down our throats.
Damaris Reyes, Executive Director, Good Old Lower East Side: You know I live right across the street from the highway in the East River and I saw the water come in and we were traumatized. So I know that there's no option for me that includes no flood protection. Like I cannot live with leave the park alone and don't do anything. I can't live through that again.
The video provides a good example of how adaptation planning with stakeholder participation works. The New York City government made some executive decisions after the planning process was completed that changed the plans significantly. The changes removed some of the components involving allowing flooding of park areas in times of high water, preferring elevated berms over intentional lower elevations and natural habitats. It will be interesting to see how the plans are finally implemented, how the public feels about the results, and how the project as a whole and its component parts perform when high water affects lower Manhattan, as a result of a storm surge or the inevitable higher tides in the upcoming years.
Module 13 Lab: Discussion
Module 13 Lab: DiscussionFor this Guided Discussion, you will revisit a documentary video introduced in Module 13 and respond to a discussion prompt that addresses key questions regarding sea level rise adaptation planning on the North Carolina coast. You will also be required to comment on a classmate’s post.
To begin, review Effects of Rising Sea Level on Coastal North Carolina - "Sea Change" (21:53 minutes). This WRAL documentary covers the issues faced by the Outer Banks beach communities of Nags Head and Rodanthe and communities to the east on the mainland in Hyde County, NC, including Swan Quarter, where low-elevation agricultural land (1-2 ft above sea level) experiences frequent storm surge flooding and saltwater intrusion.
Guided Discussion Prompt
After reviewing the WRAL documentary, write a response to the following prompt:
Choose ONE of the communities featured in the video for your discussion. Choose two people from that community and discuss how their points of view or expertise can help the community overcome challenges and become more resilient to sea level rise. Use evidence mentioned in the video, including sea level rise projections and the examples of structural and non-structural adaptations shown in the video. Please cite your sources (see rubric).
Instructions
- Use Word or another text editor to respond to the prompt with your scenario, backed by the content of the video. The length of your response should be about 200 to 400 words. (Typing your response in Word or another text editor and then copying/pasting from Word or similar to the discussion forum is recommended to avoid losing your work midstream in the event of an accidental browser closing, intermittent Internet connectivity, etc.)
- Go to Module 13 Lab (Discussion) and type or copy/paste your response to the prompt into the text box marked 'reply', then select Post Reply by 11:59 p.m. on Thursday to allow time for responses. Your response is now visible to your classmates and your instructor.
- Read through others’ responses and write a thoughtful reply to at least one other student by 11:59 p.m. on Sunday. These replies should be either a rebuttal in which you add your ideas in the form of a persuasive argument (written with respect for the originating author), or a response that agrees with, supports, and builds upon the original response. Because a timely response to the conversation is part of your grade, subscribing to the forum is required. Check in to the discussion forum often throughout the week to post and respond to comments.
Statement of Use of AI on Exams, Quizzes, and Labs
Grading
The grading rubric will help you understand what constitutes an appropriate level of participation on your part. The instructor reserves the right to not award any credit (including points for timing and interaction) if the content of the posts, however on-time they may be, are off-topic, offensive, or otherwise inappropriate. Such posts may be deleted at any time by the instructor as well.
| Content | Addresses all facets of the assigned discussion prompt, with accurate supporting detail where necessary. Response post is at least 200-400 words of substantive content addressing the prompt. Posts are appropriately cited as needed. To earn full credit in this category, your comments and replies to classmates must demonstrate thoughtful consideration of the topic and go well beyond, "I agree with you." | 6 Points |
|---|---|---|
| Formatting and Mechanics | Posts should be edited and cited appropriately as needed. While a discussion forum has an informal tone, please refrain from foul or offensive language, texting abbreviations, etc. | 2 points |
| Timing | This assignment is deliberately structured to allow you to participate throughout the week. Your initial response to the statement should be shared by 11:59 p.m. on Thursday and your response to at least one other classmate by 11:59 p.m. on Sunday to allow for authentic discussion to occur. | 2 points |
Summary and Final Tasks
Summary and Final TasksAs you learned earlier in this module, humans, and their environment are part of a complex, coupled system. Human institutions are coupled to the natural system through both human modifications of the environment and the information they gather about how these modifications affect the environment. Decision-makers gather information about how their modifications have changed the natural system to evaluate whether the modifications they have made have helped them reach their economic, political, or social goals. In this way, modifications to the natural environment feedback into the human policymaking process.
In modules 11, 12, and 13, you explored several tools that policymakers and stakeholders use to manage these feedbacks. In Module 11, you learned how the sensitivity and adaptive capacity dimensions of vulnerability are used to filter information about coastal hazards in ways that allow policymakers to incorporate economic and social considerations when assessing vulnerability. In Module 12, you learned how the disaster management cycle could be used to guide modification of the human and natural components of the coastal environment to reduce these vulnerabilities. And in this module, you learned how stakeholders can use cost-benefit analysis to assess the economic, political, and social costs and benefits of these modifications.
Given the complexity of the coupled human-environment system, you should not be surprised to learn that these tools are far from perfect. The uncertainty inherent in the system frequently leads to surprises: attempts to modify the natural environment will not always have the expected effects on natural structures and processes, and even when the environment is changed as intended, the effects of this change may not have the desired effects on the local economy and society. Policymakers must therefore learn to live with these uncertainties. They may be able to prepare for uncertainties – including by using the adaptive management approaches and flexible adaptation pathways discussed earlier in this module – but they cannot eliminate them.

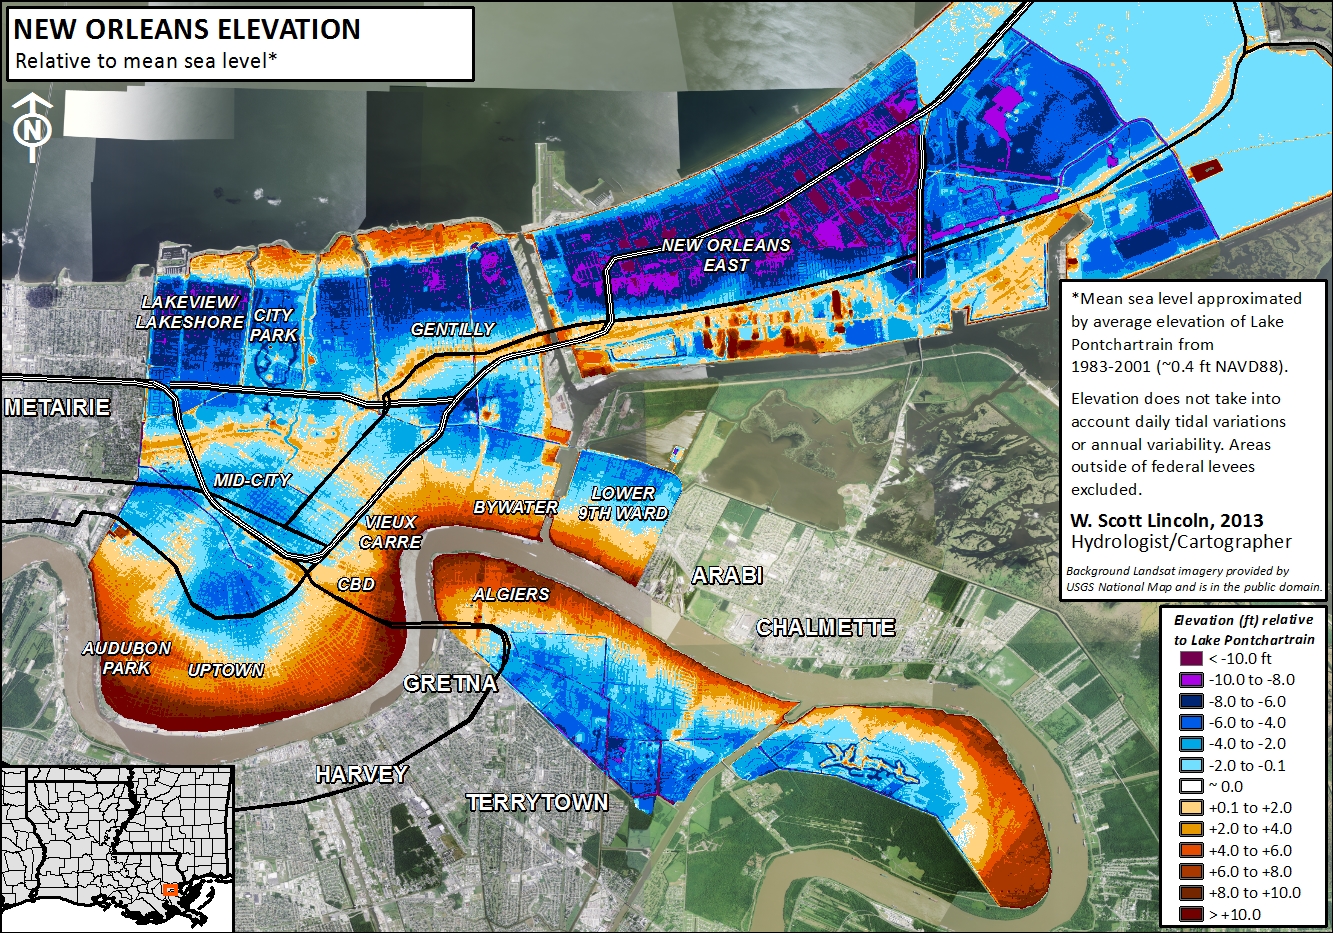
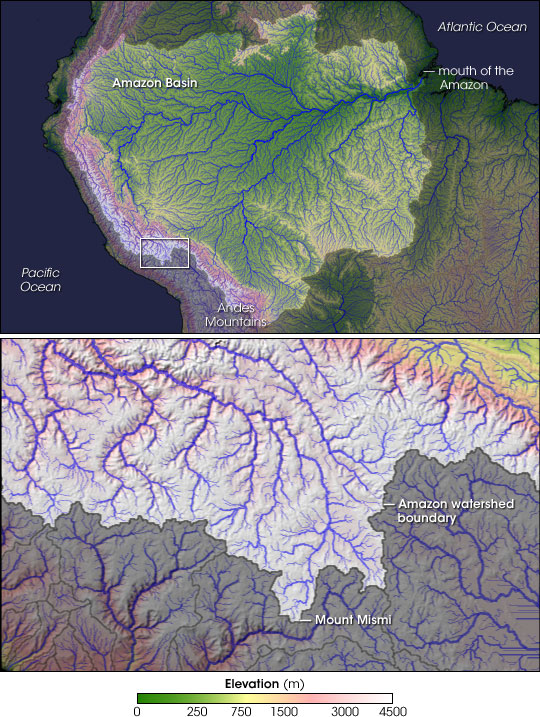
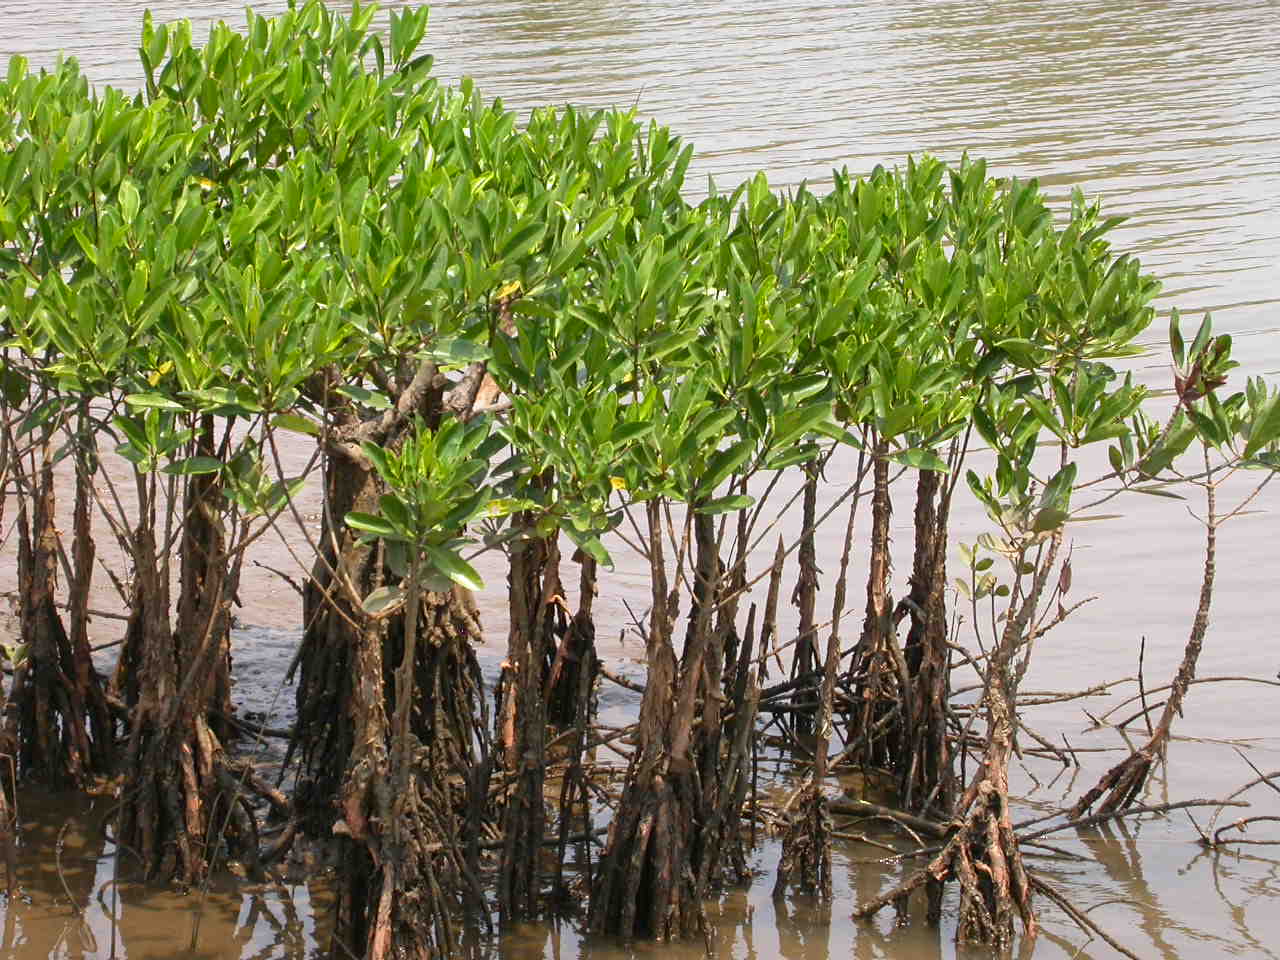
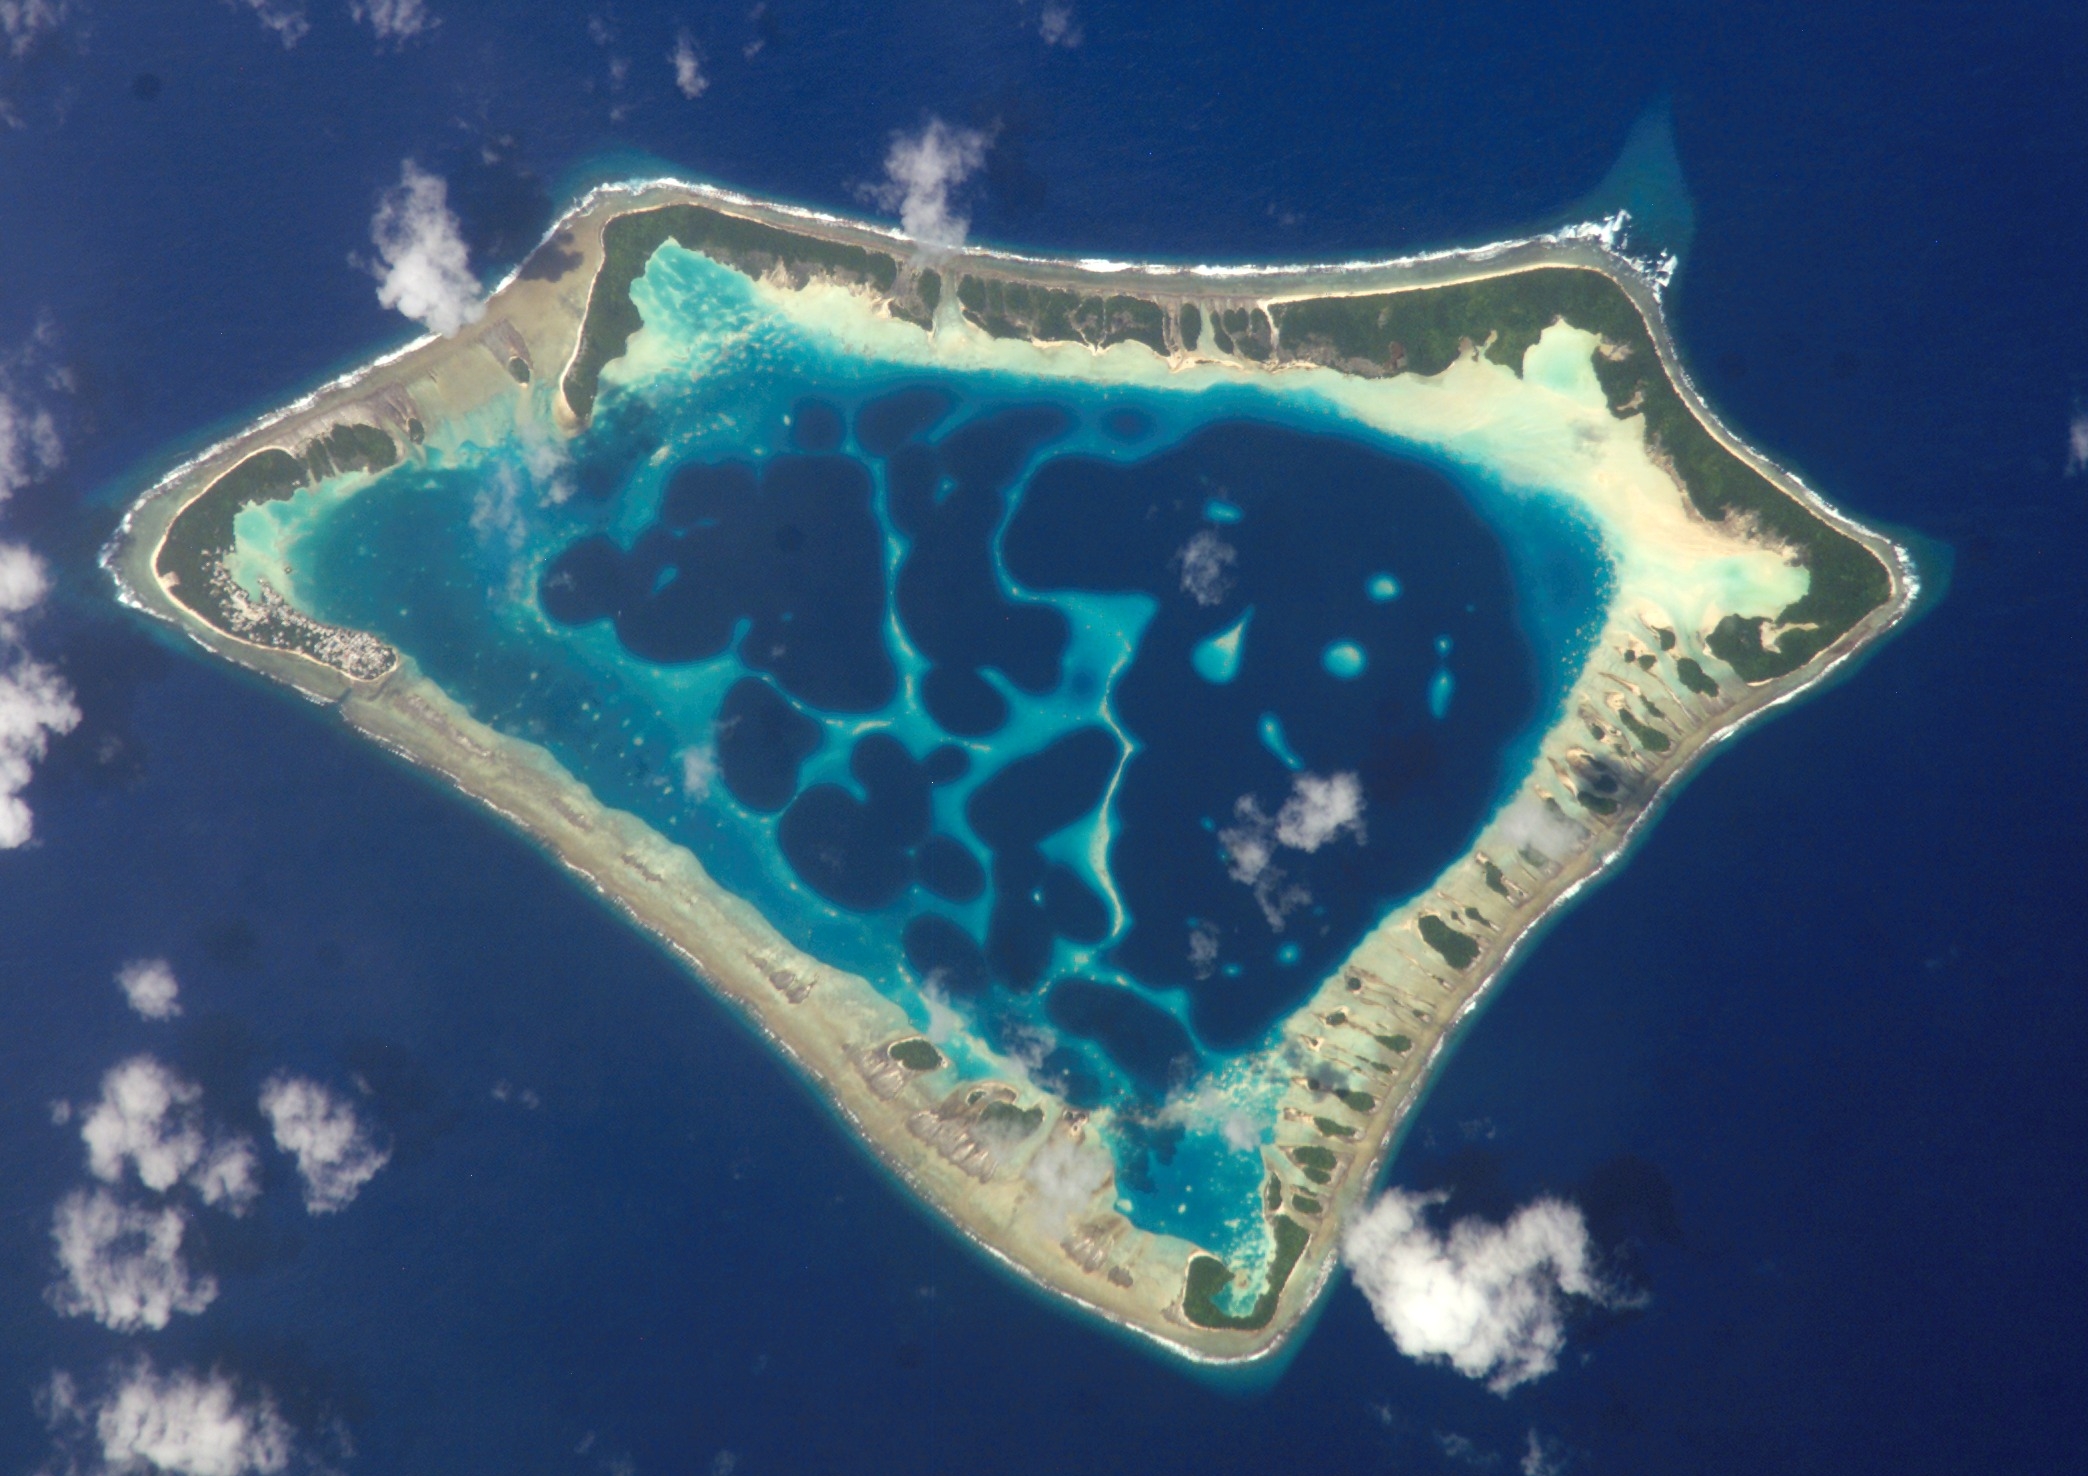
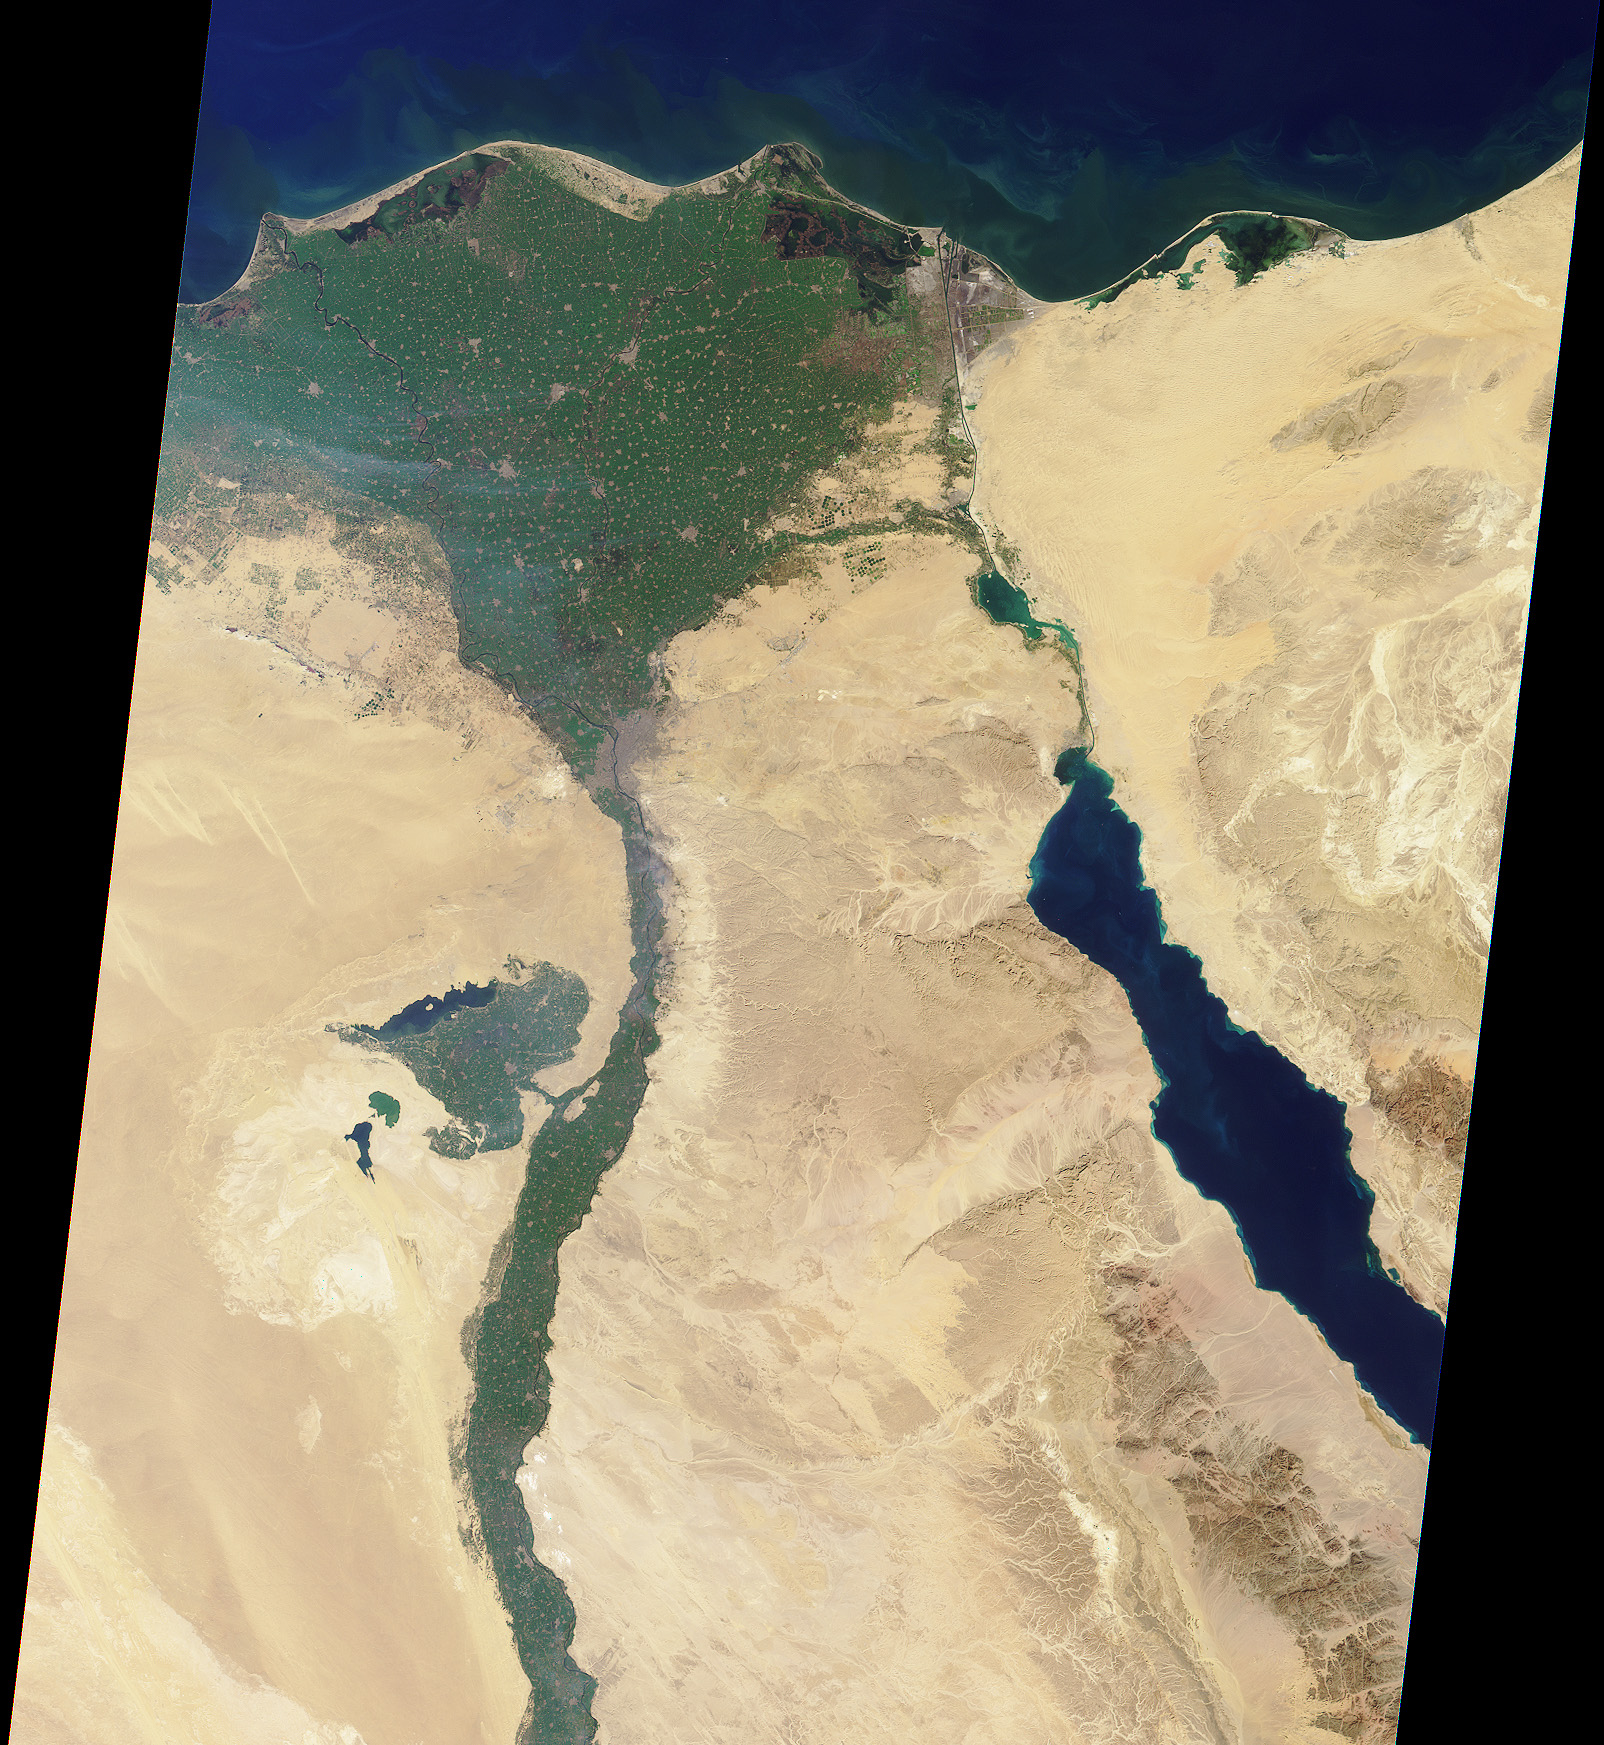
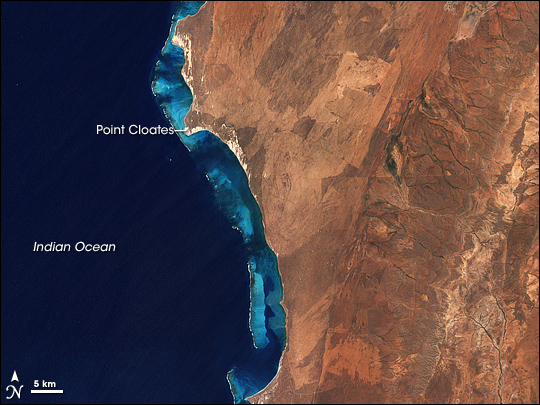
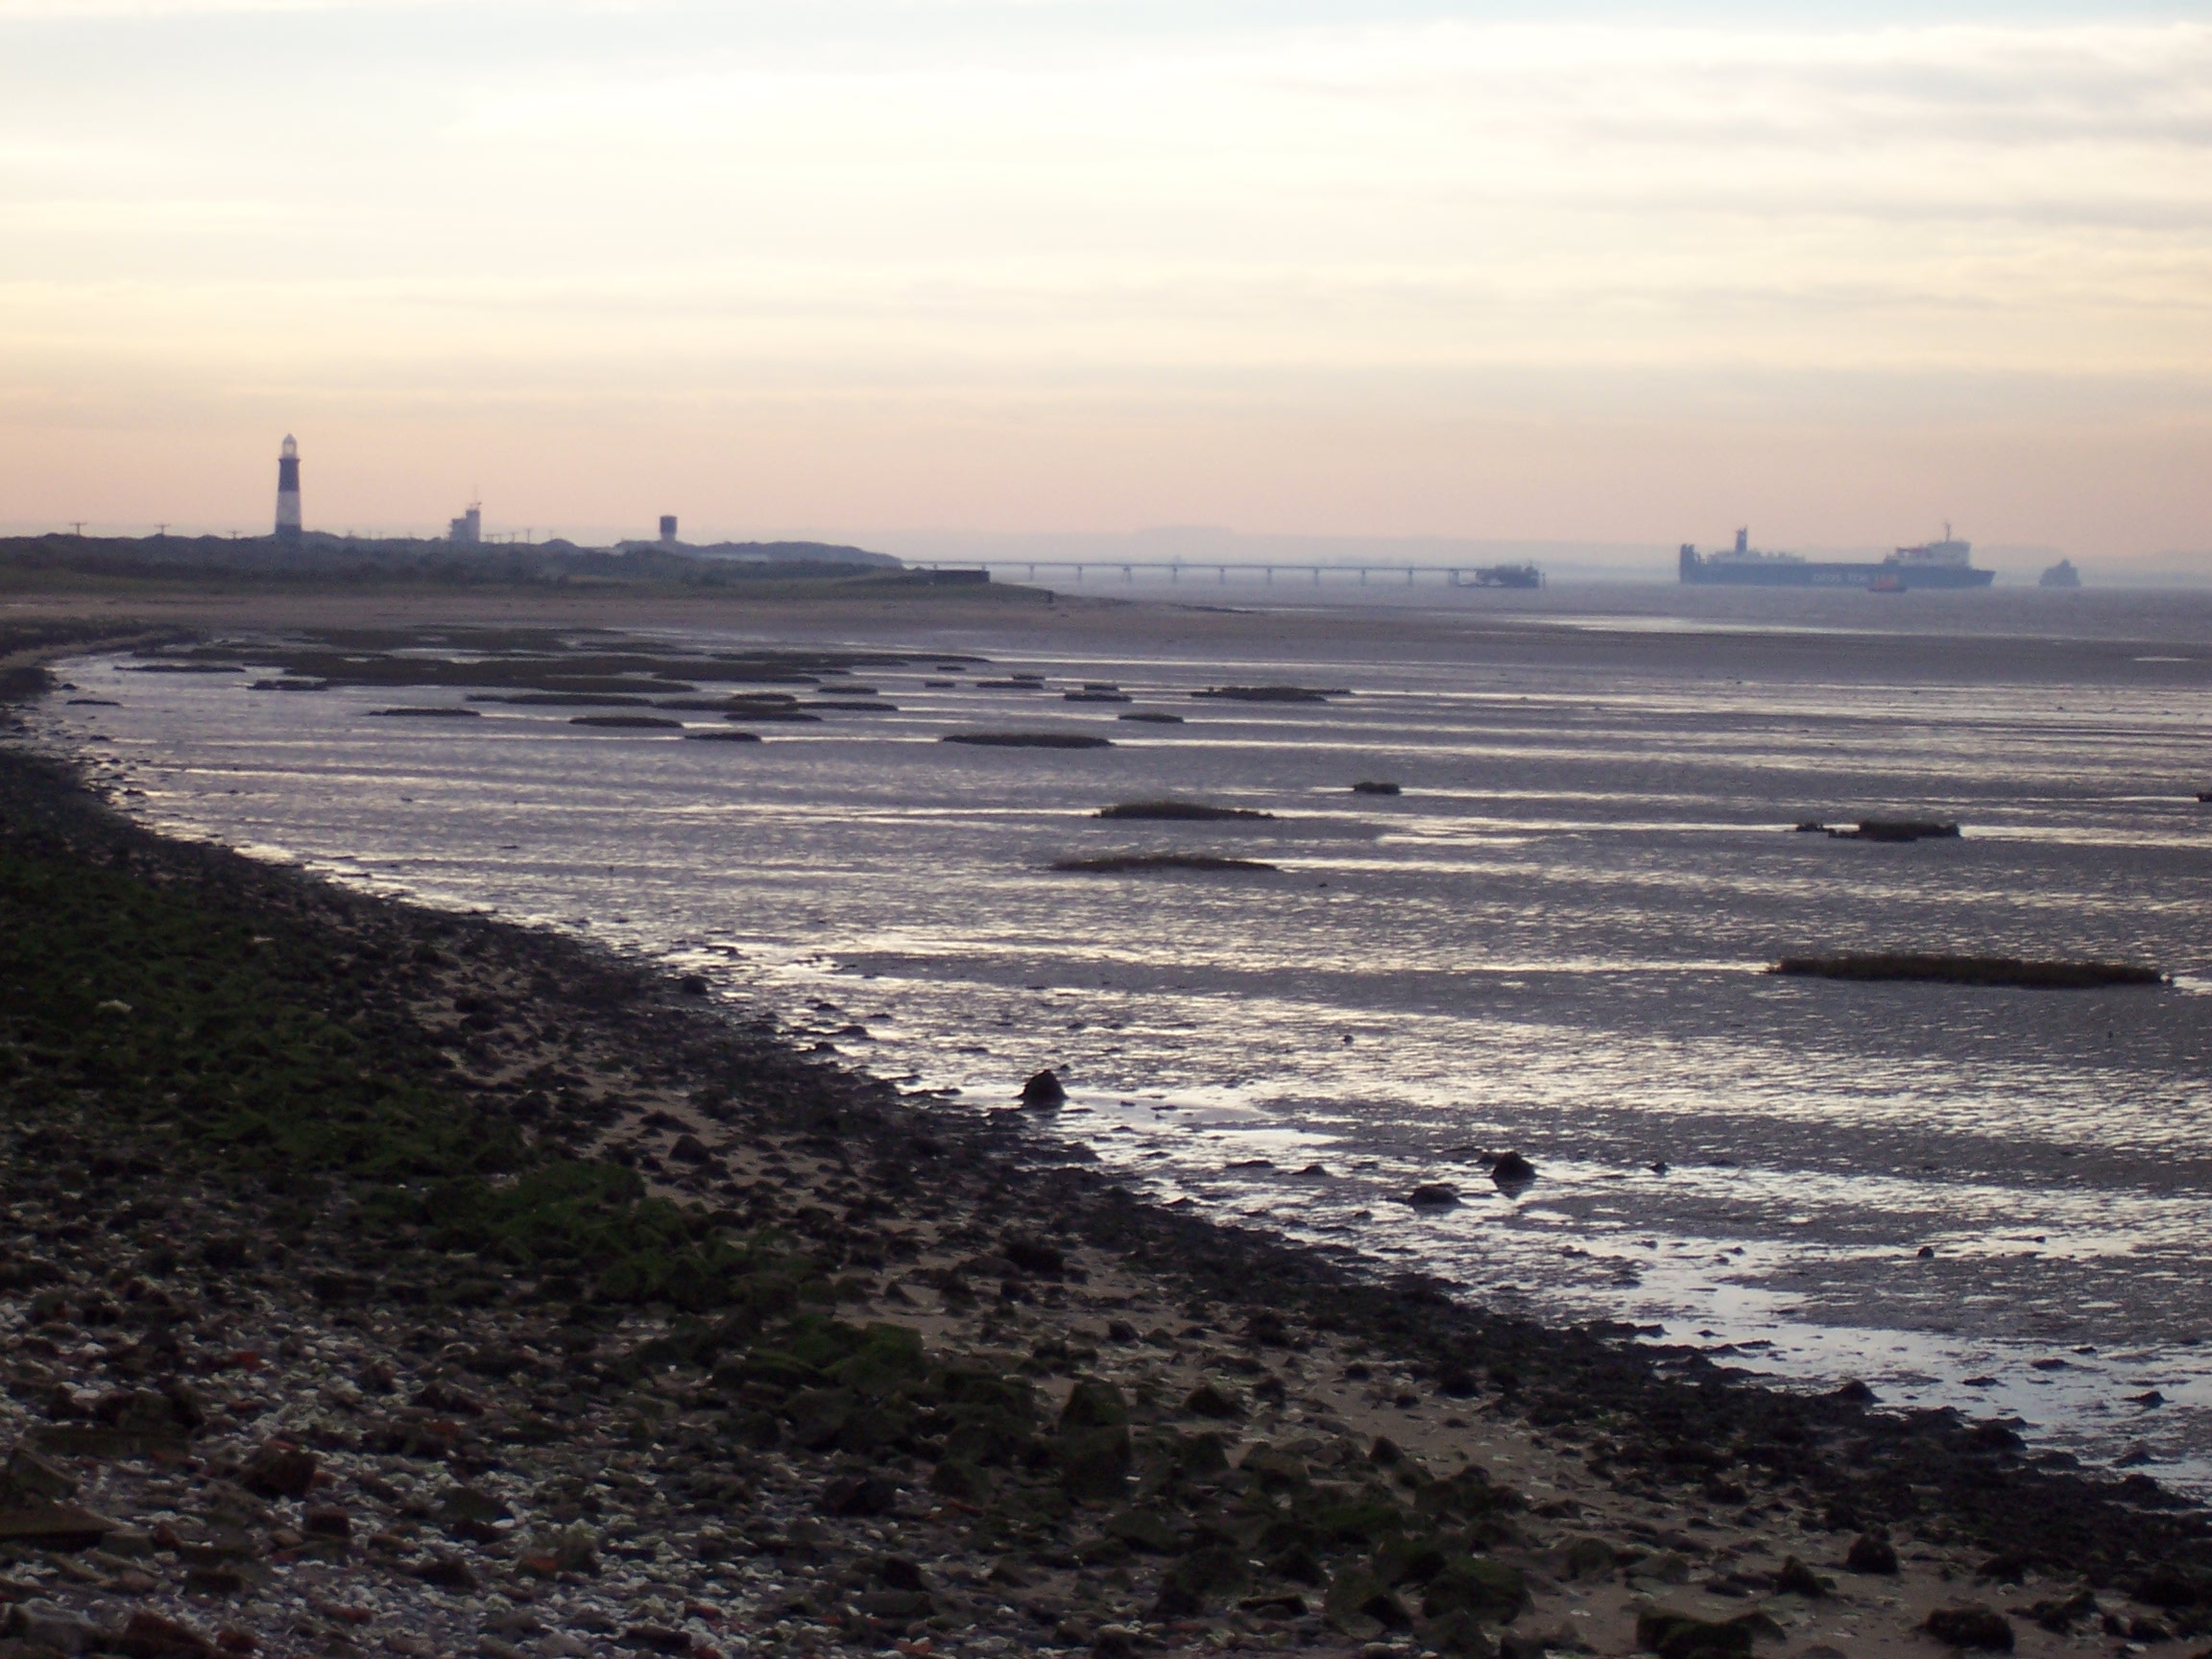
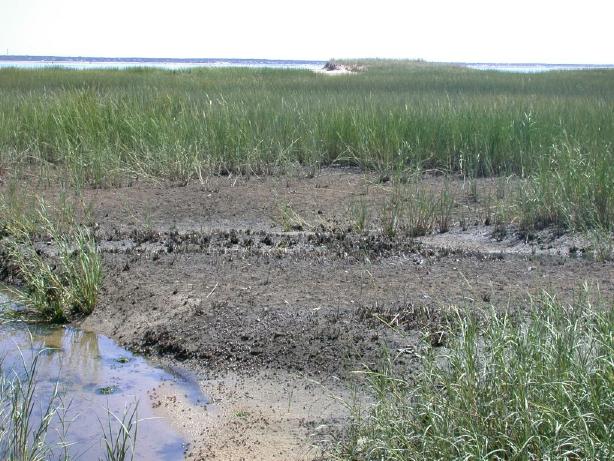
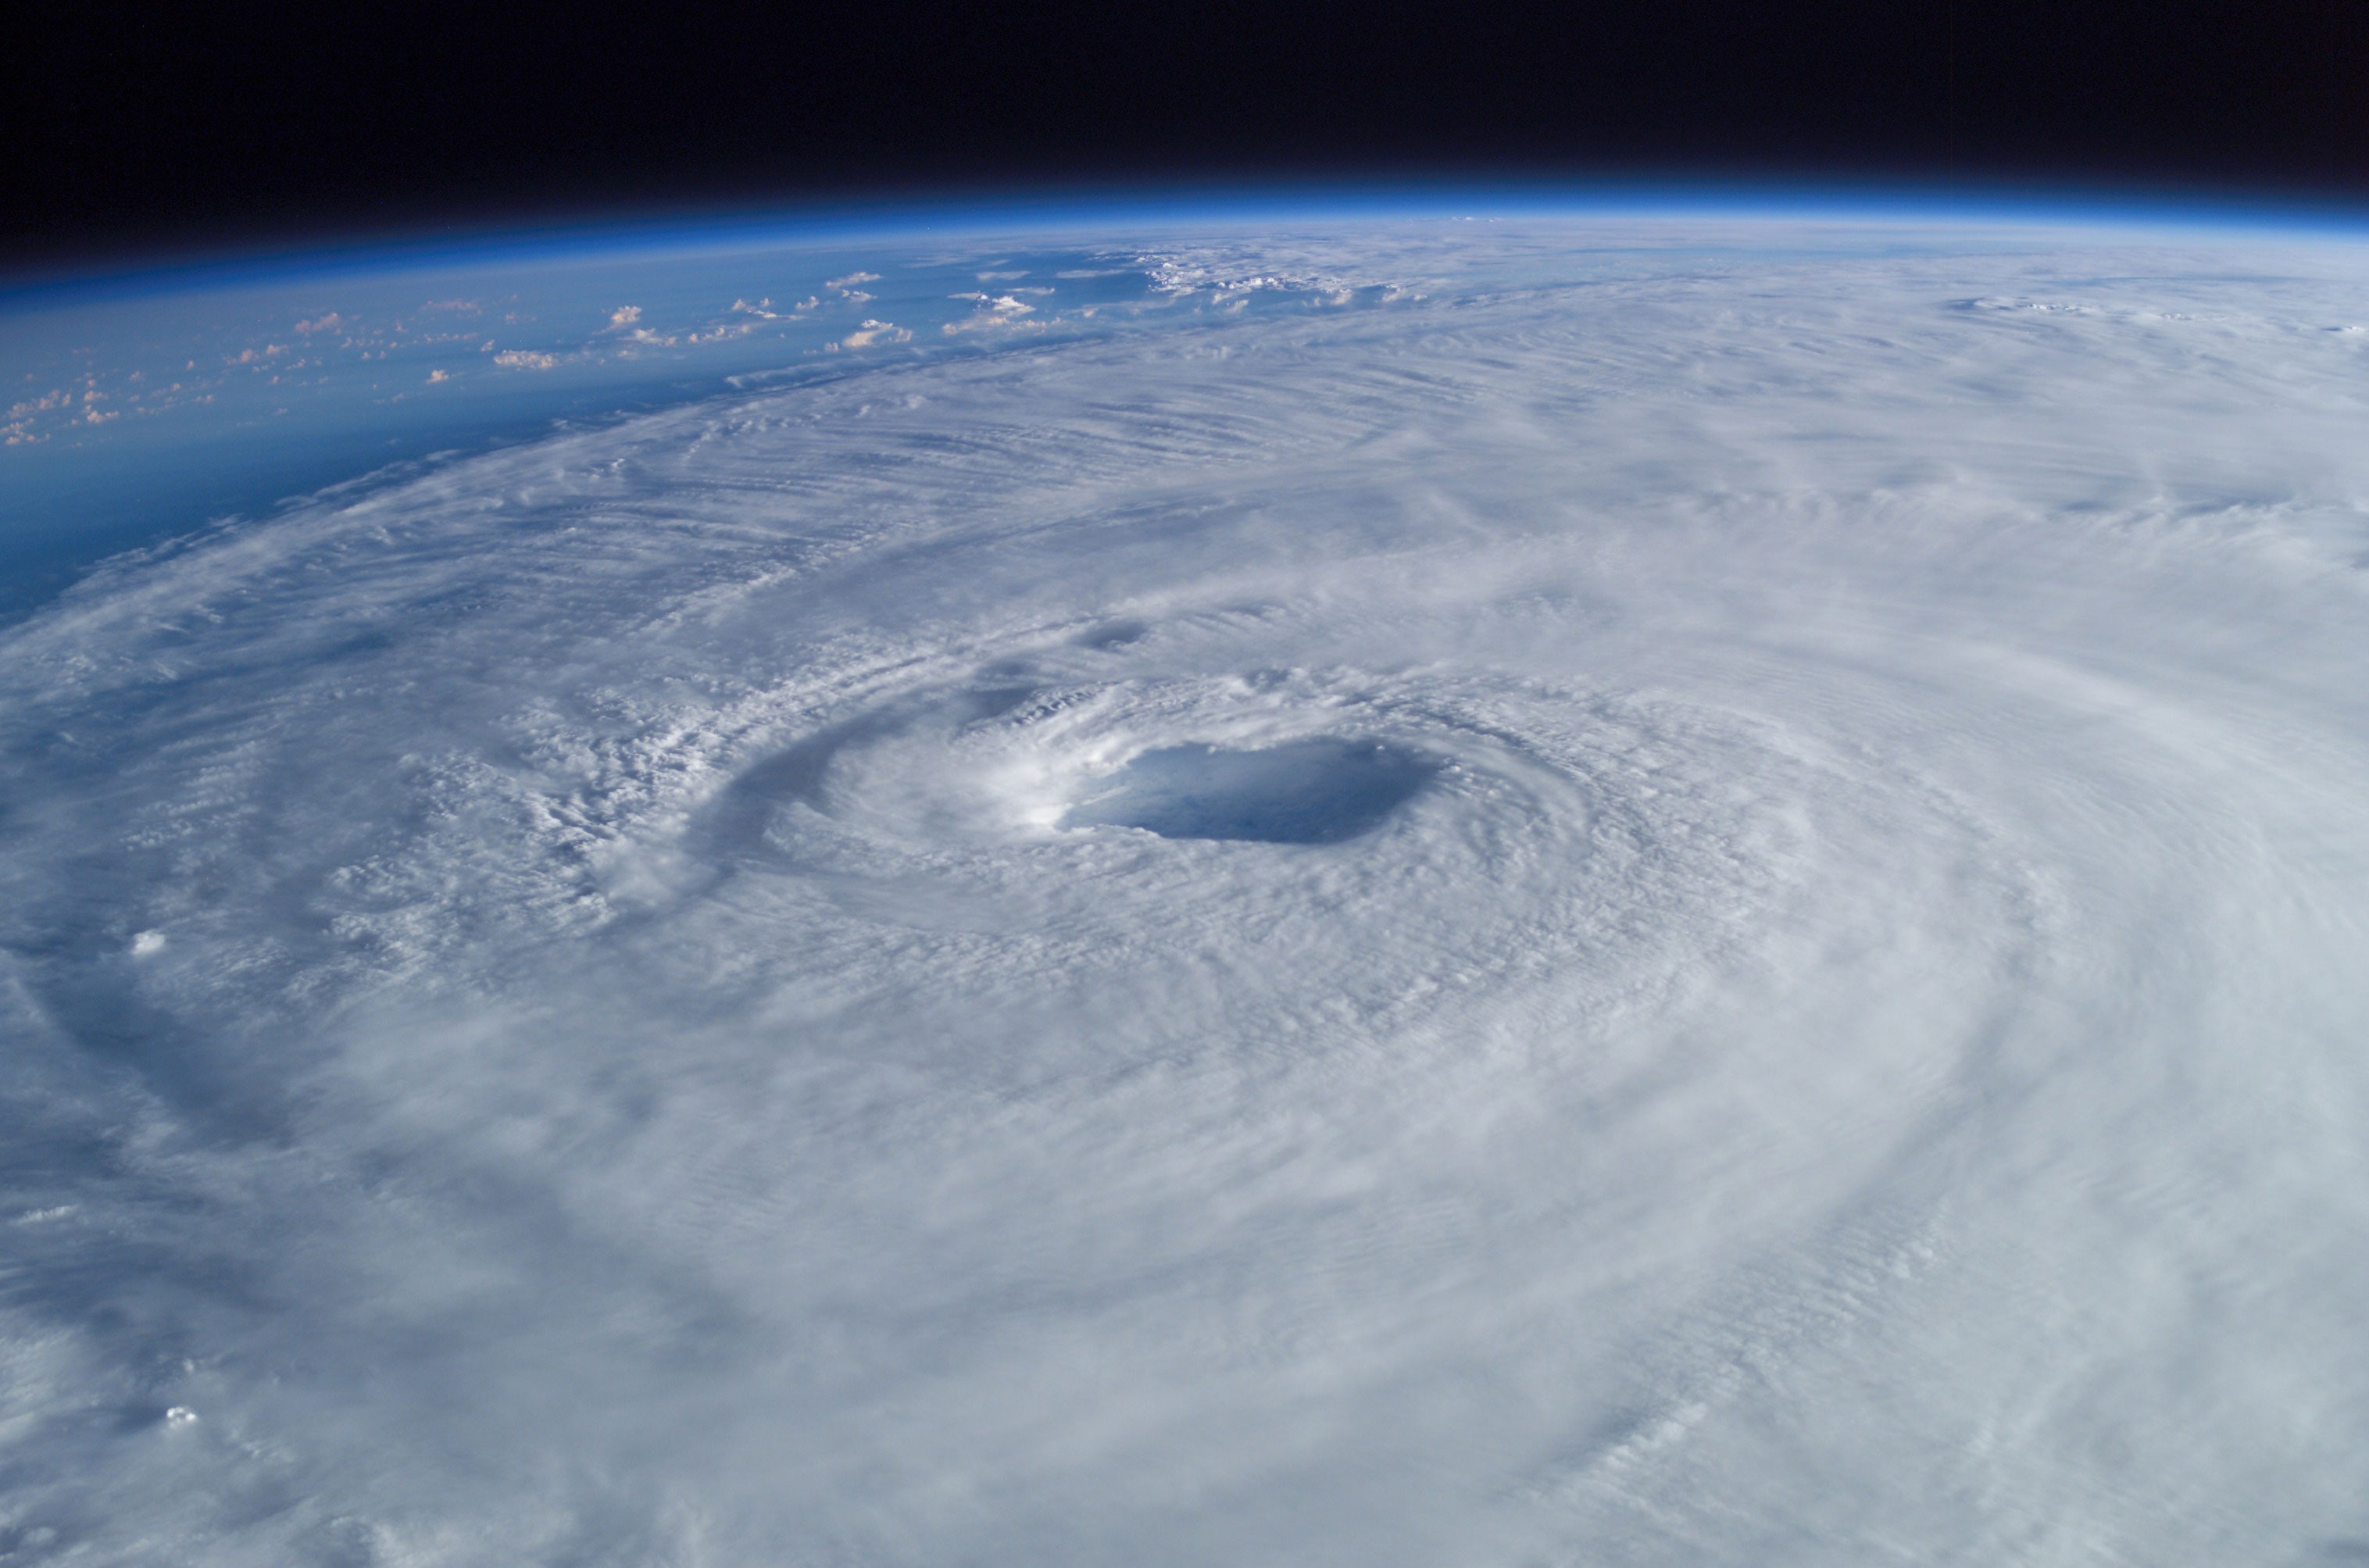
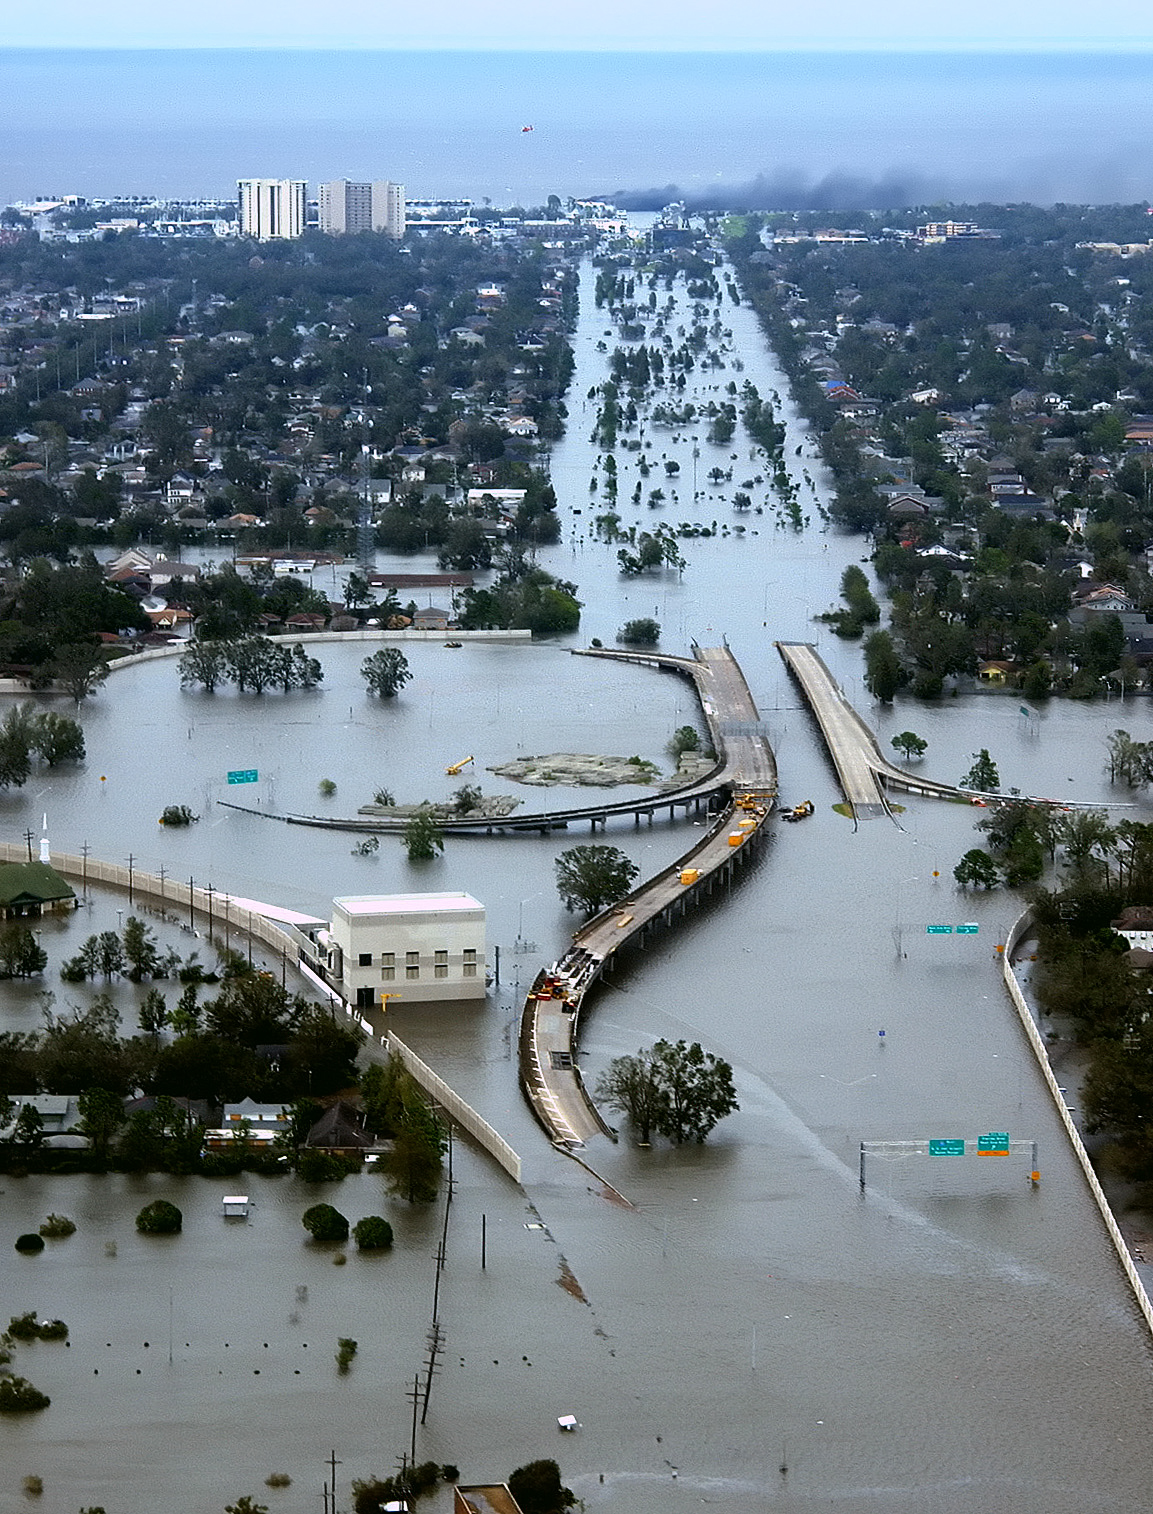
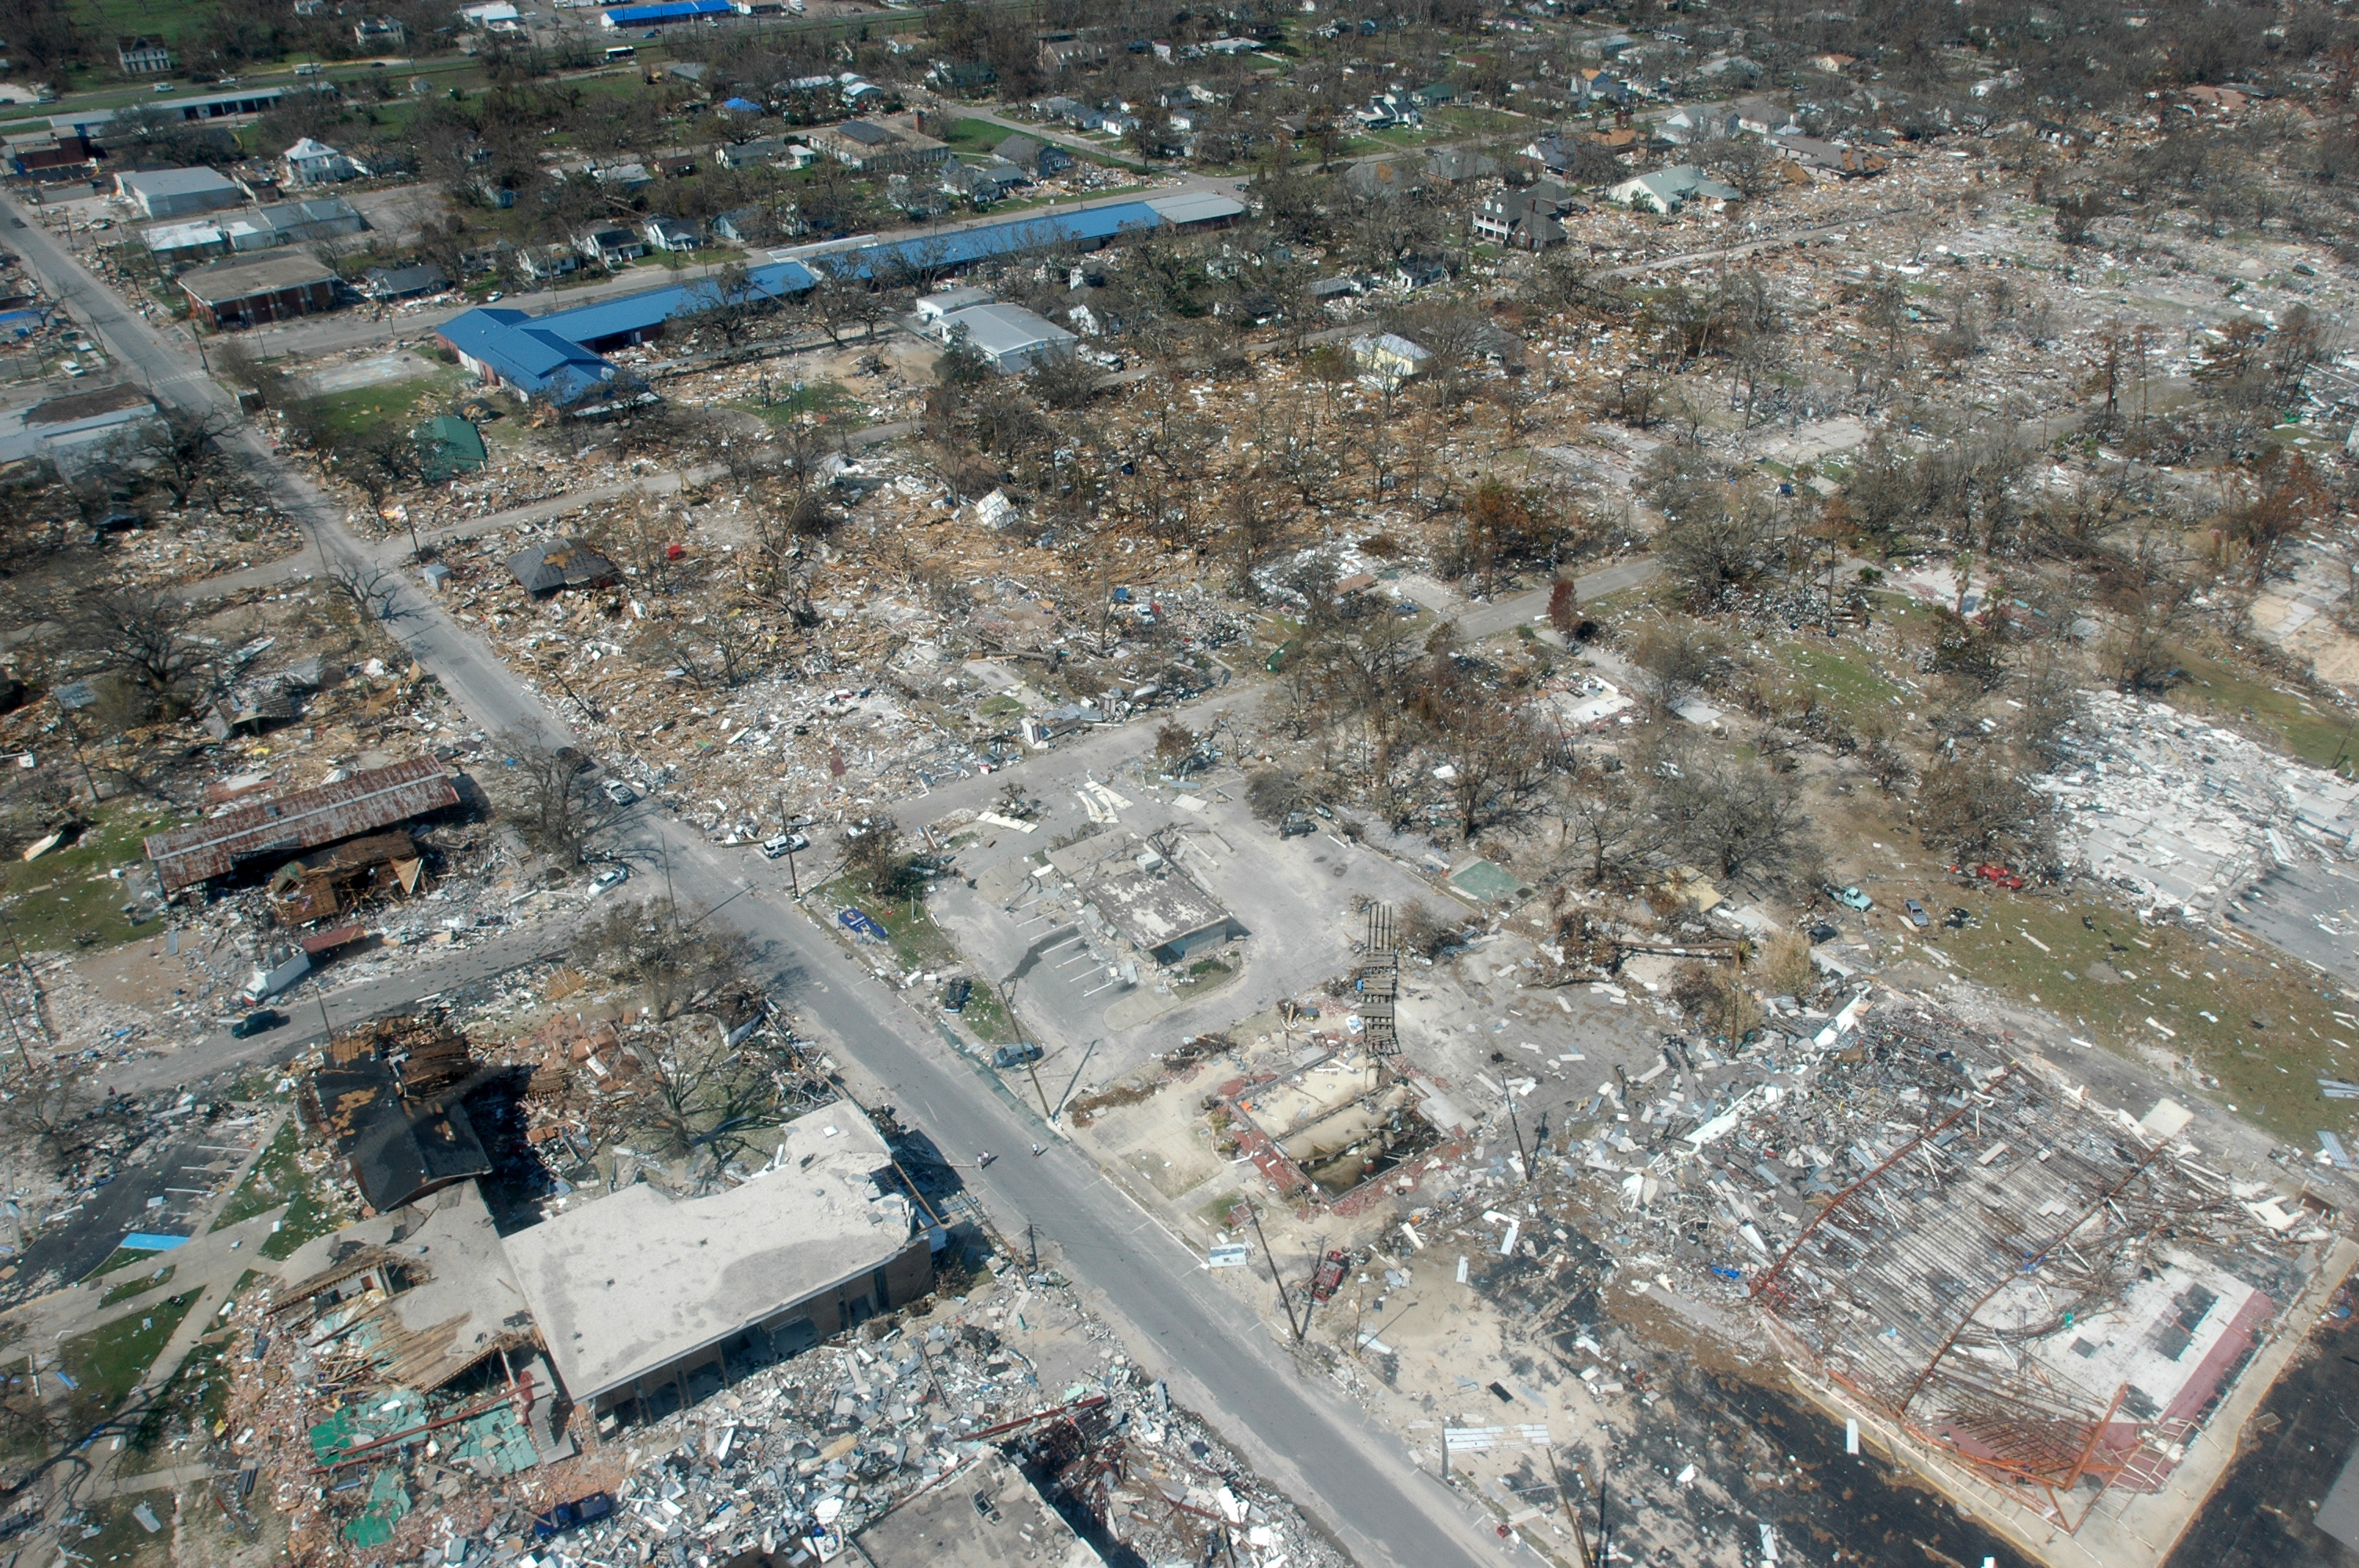
_170923-H-NI589-0007_(36602415074).jpg)
_(50).jpg)
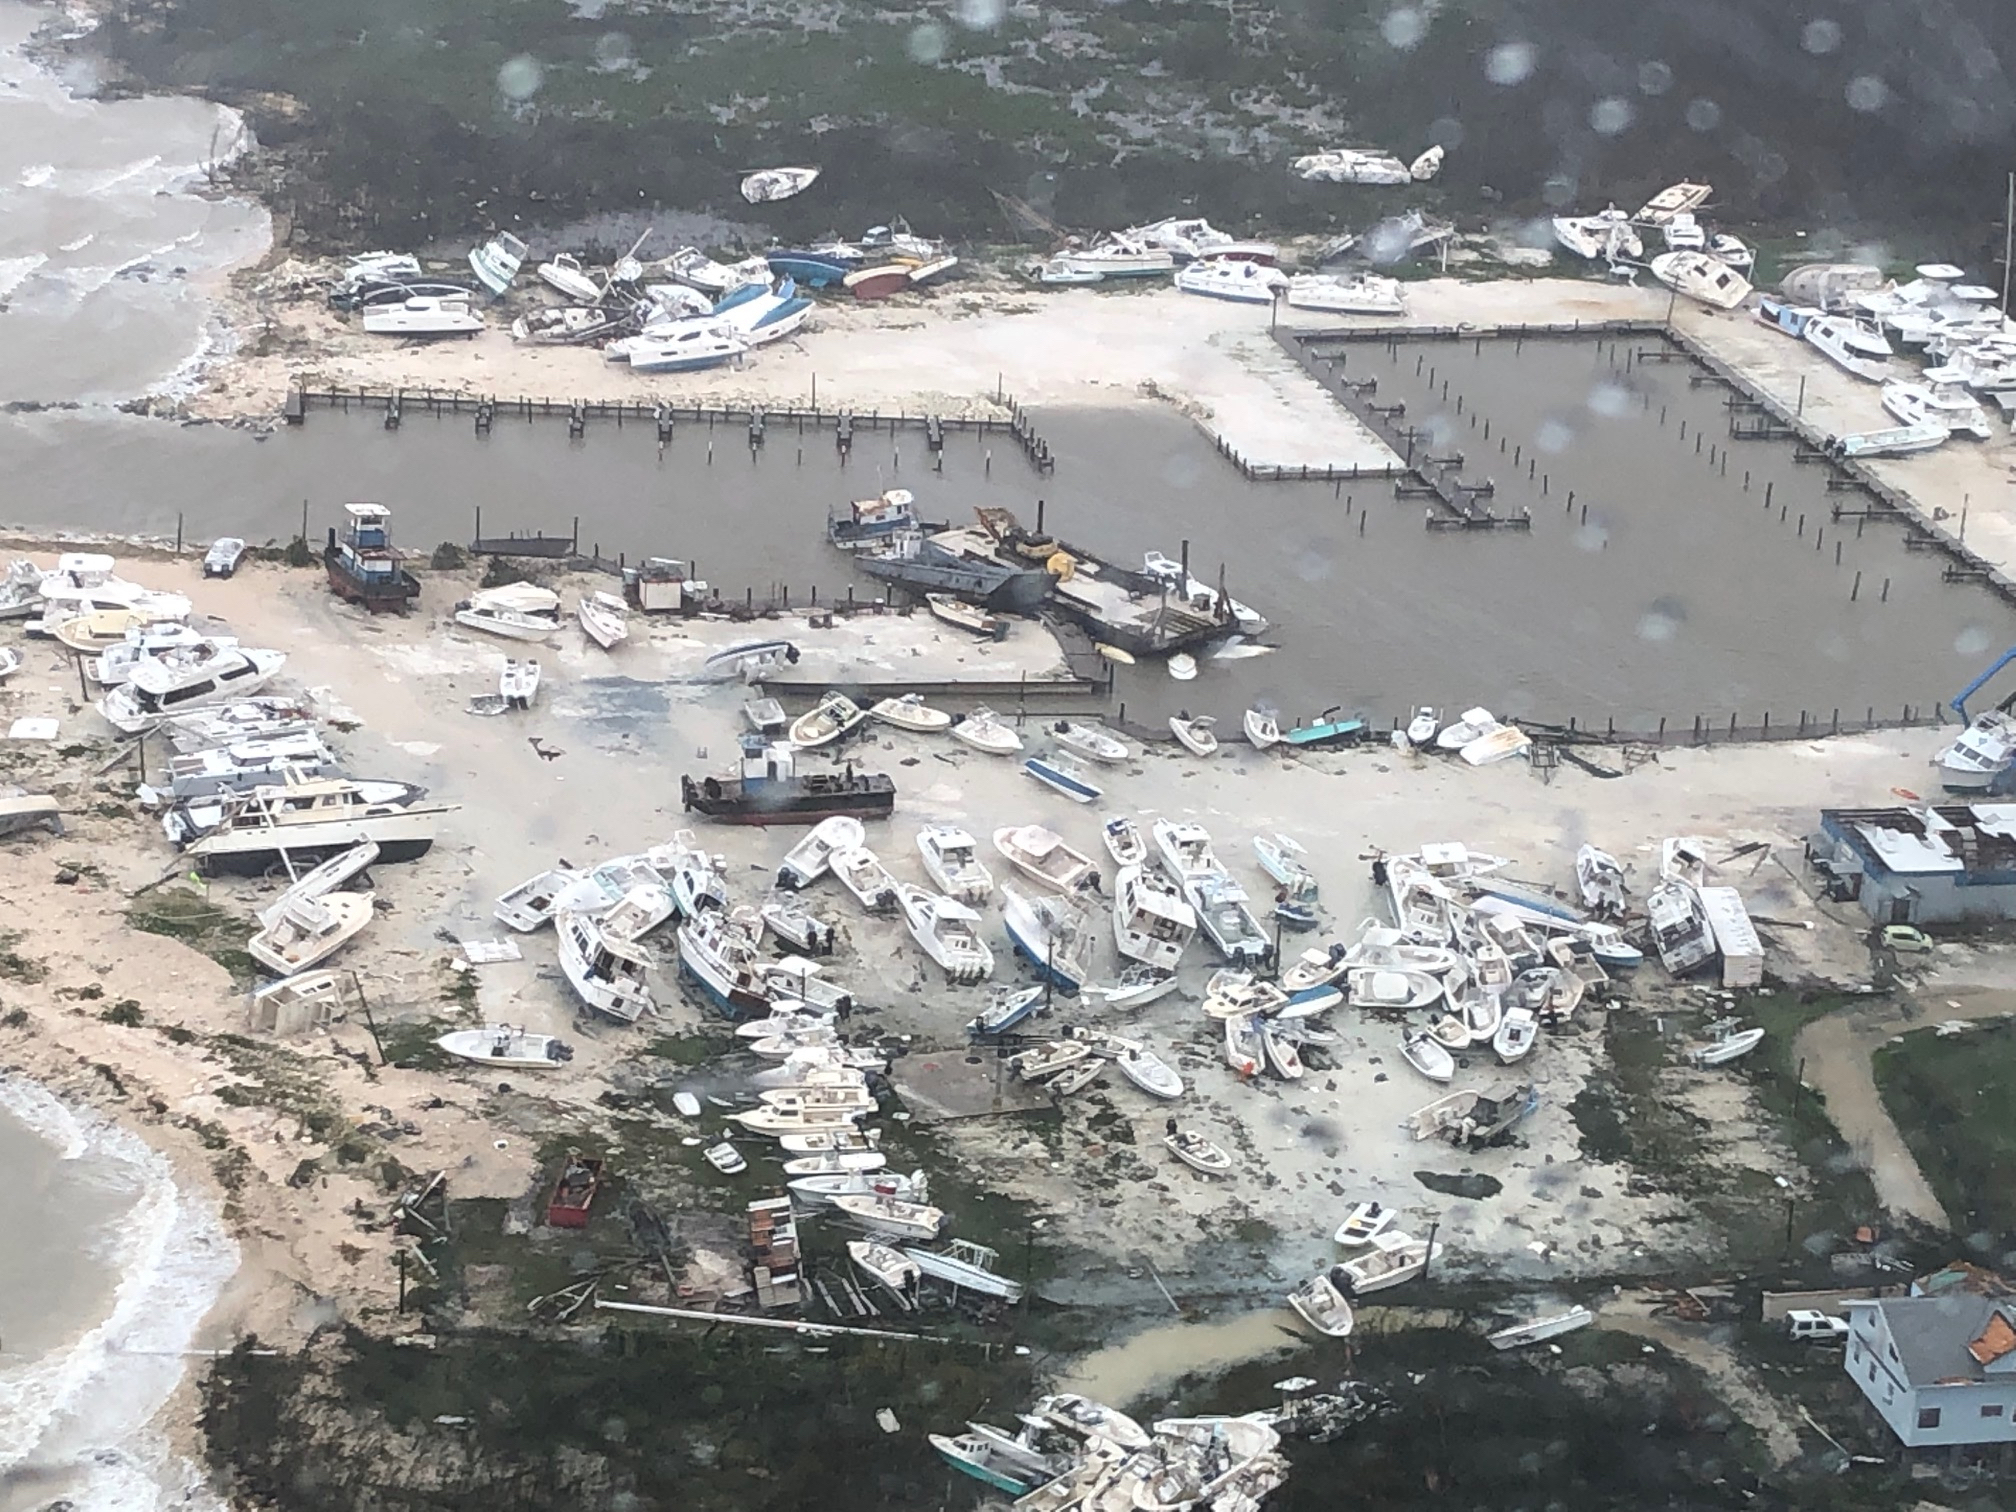
.svg)
.jpg)
.jpg)
![By Juliancolton (Own work) [Public domain], via Wikimedia Commons](https://commons.wikimedia.org/wiki/File:Hurricane_Evacuation_Route.jpg)
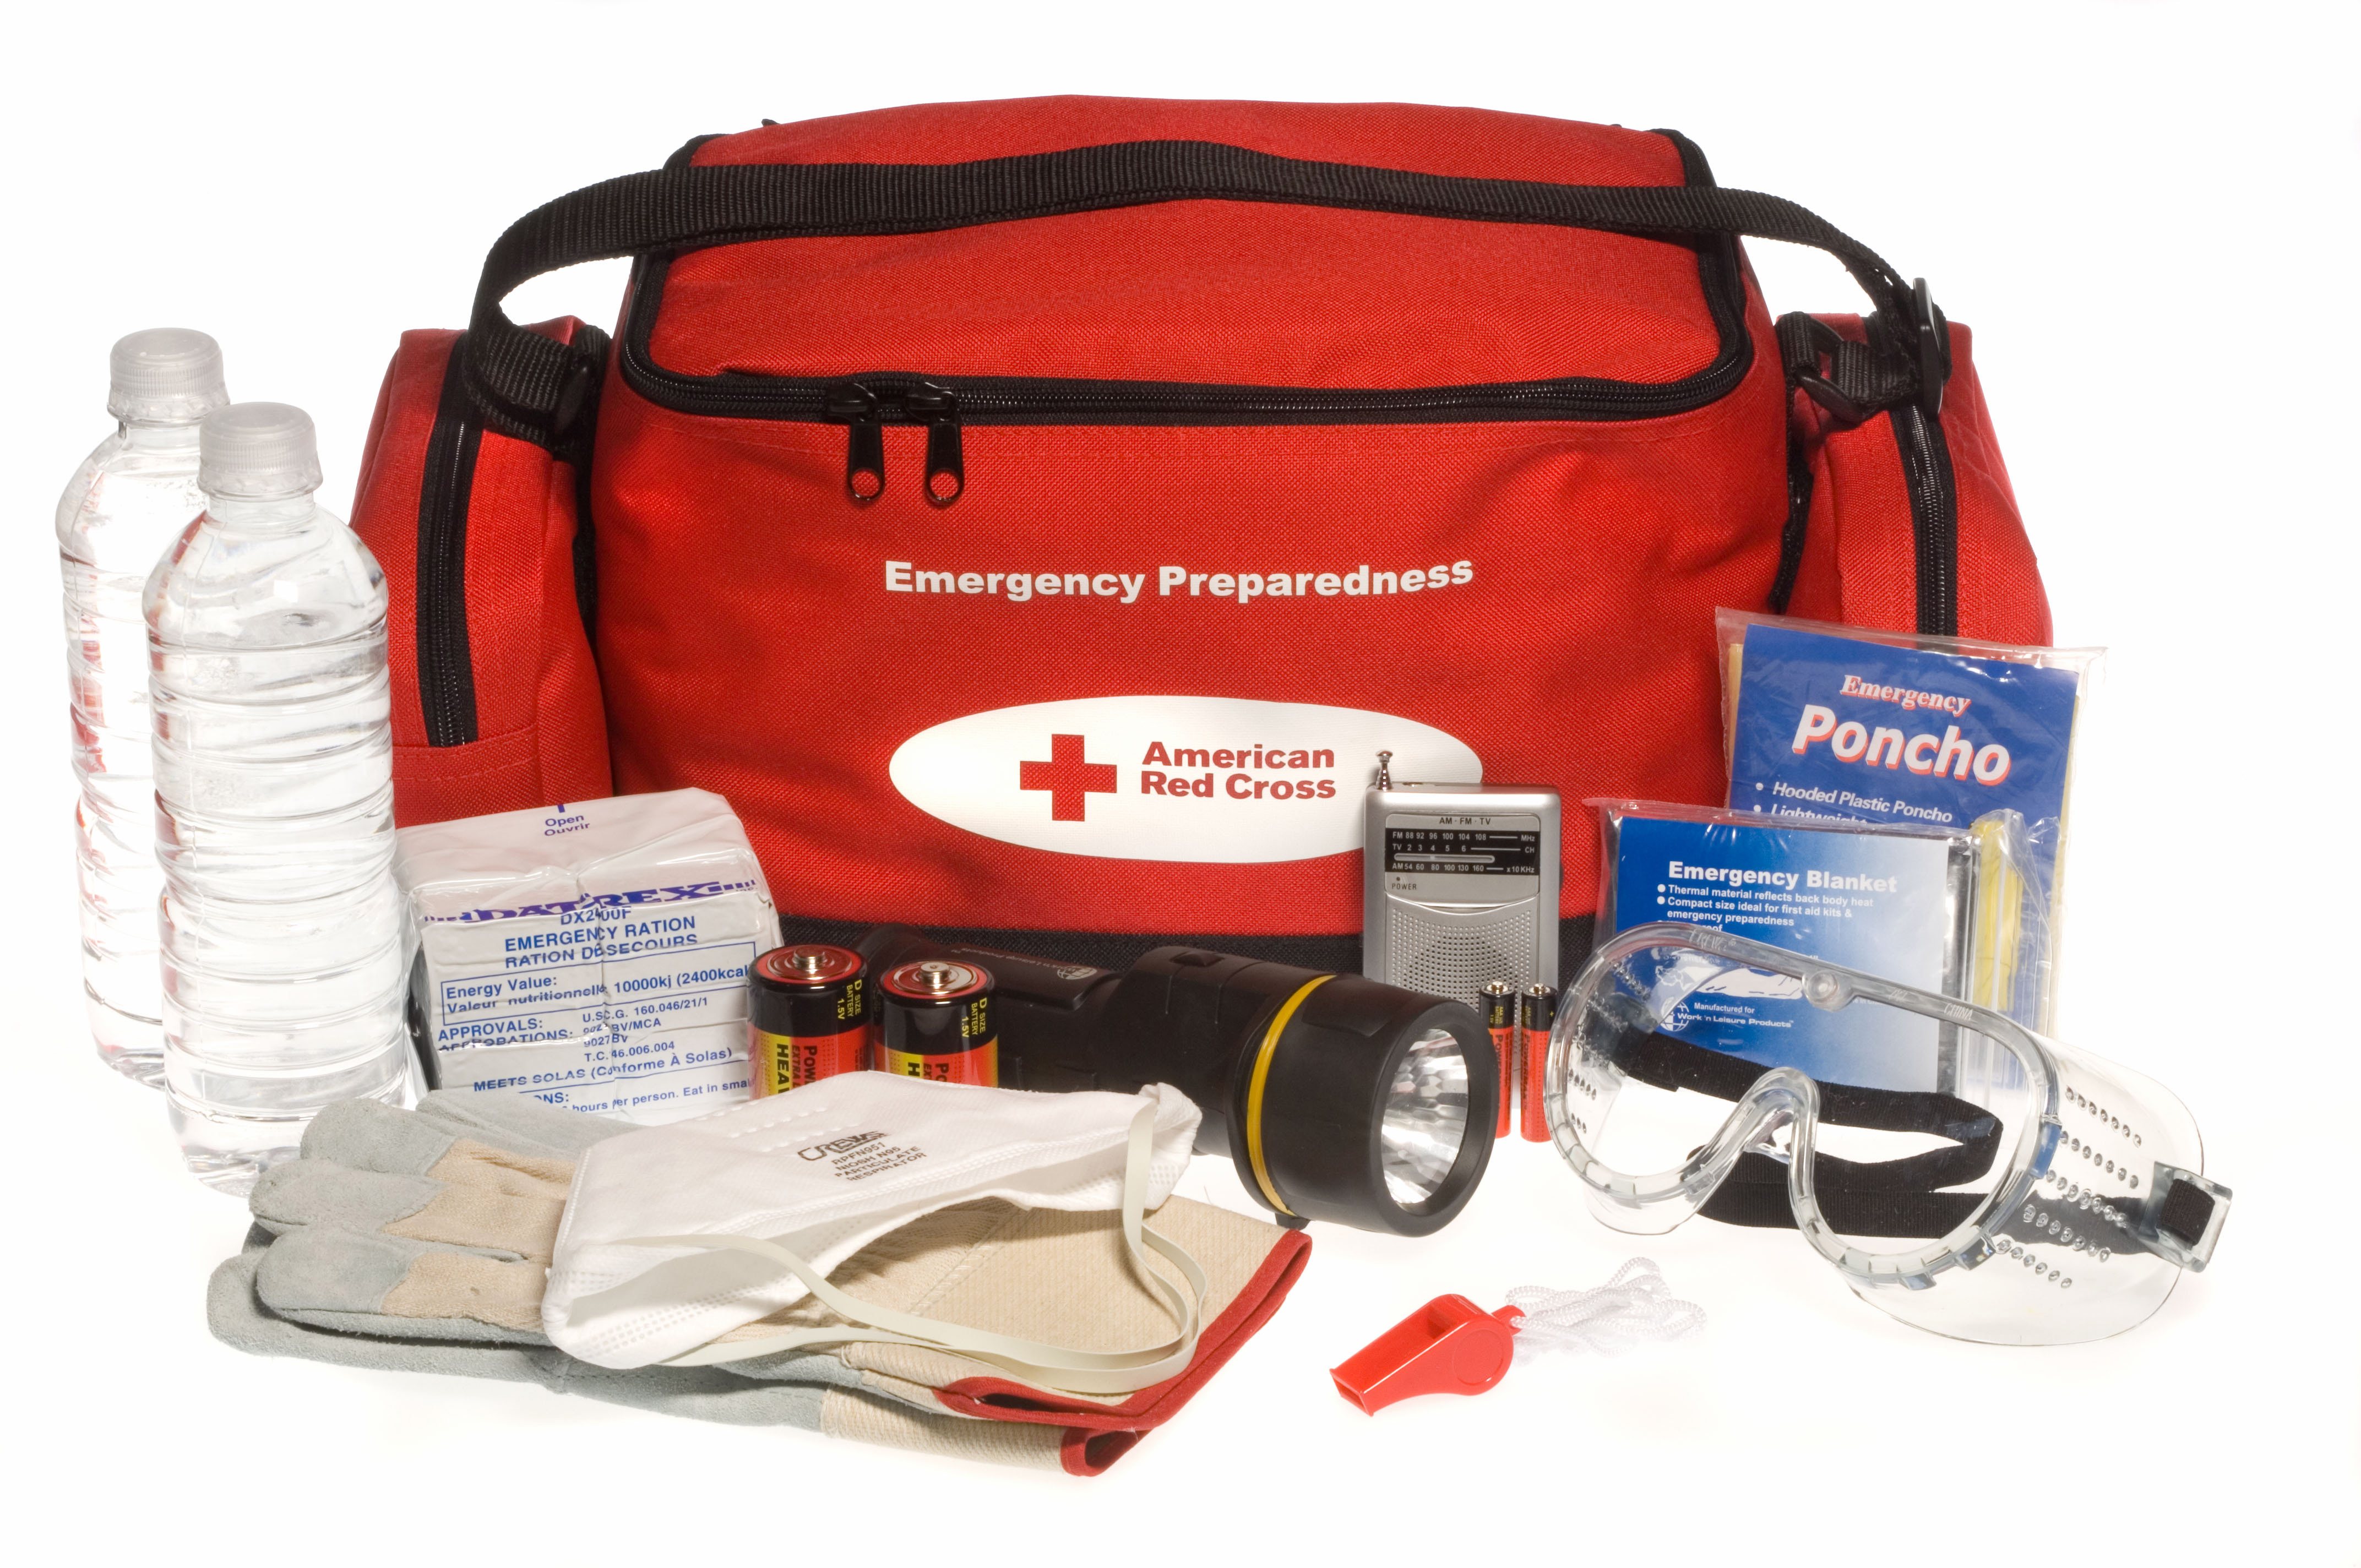
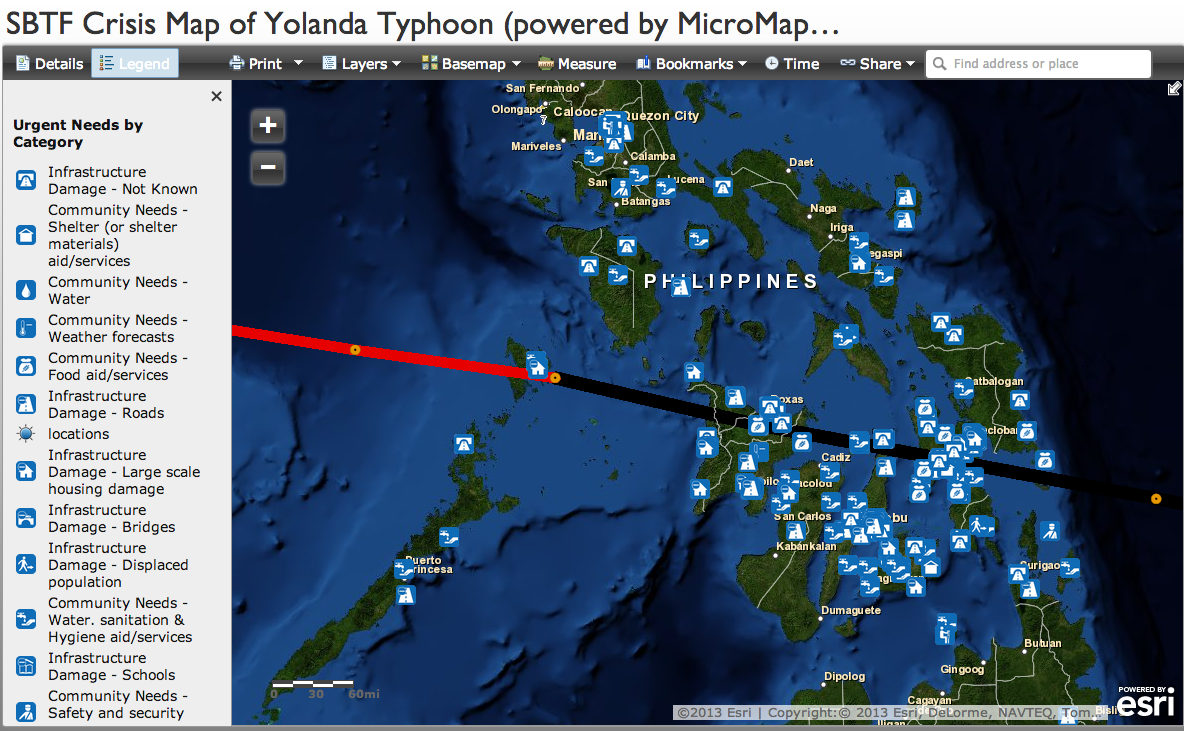
![By Michael L. Bak [Public domain], via Wikimedia Commons](http://commons.wikimedia.org/wiki/File:Fishing_boats_in_Banda_Aceh_after_2004_tsunami_DD-SD-06-07375.JPEG)
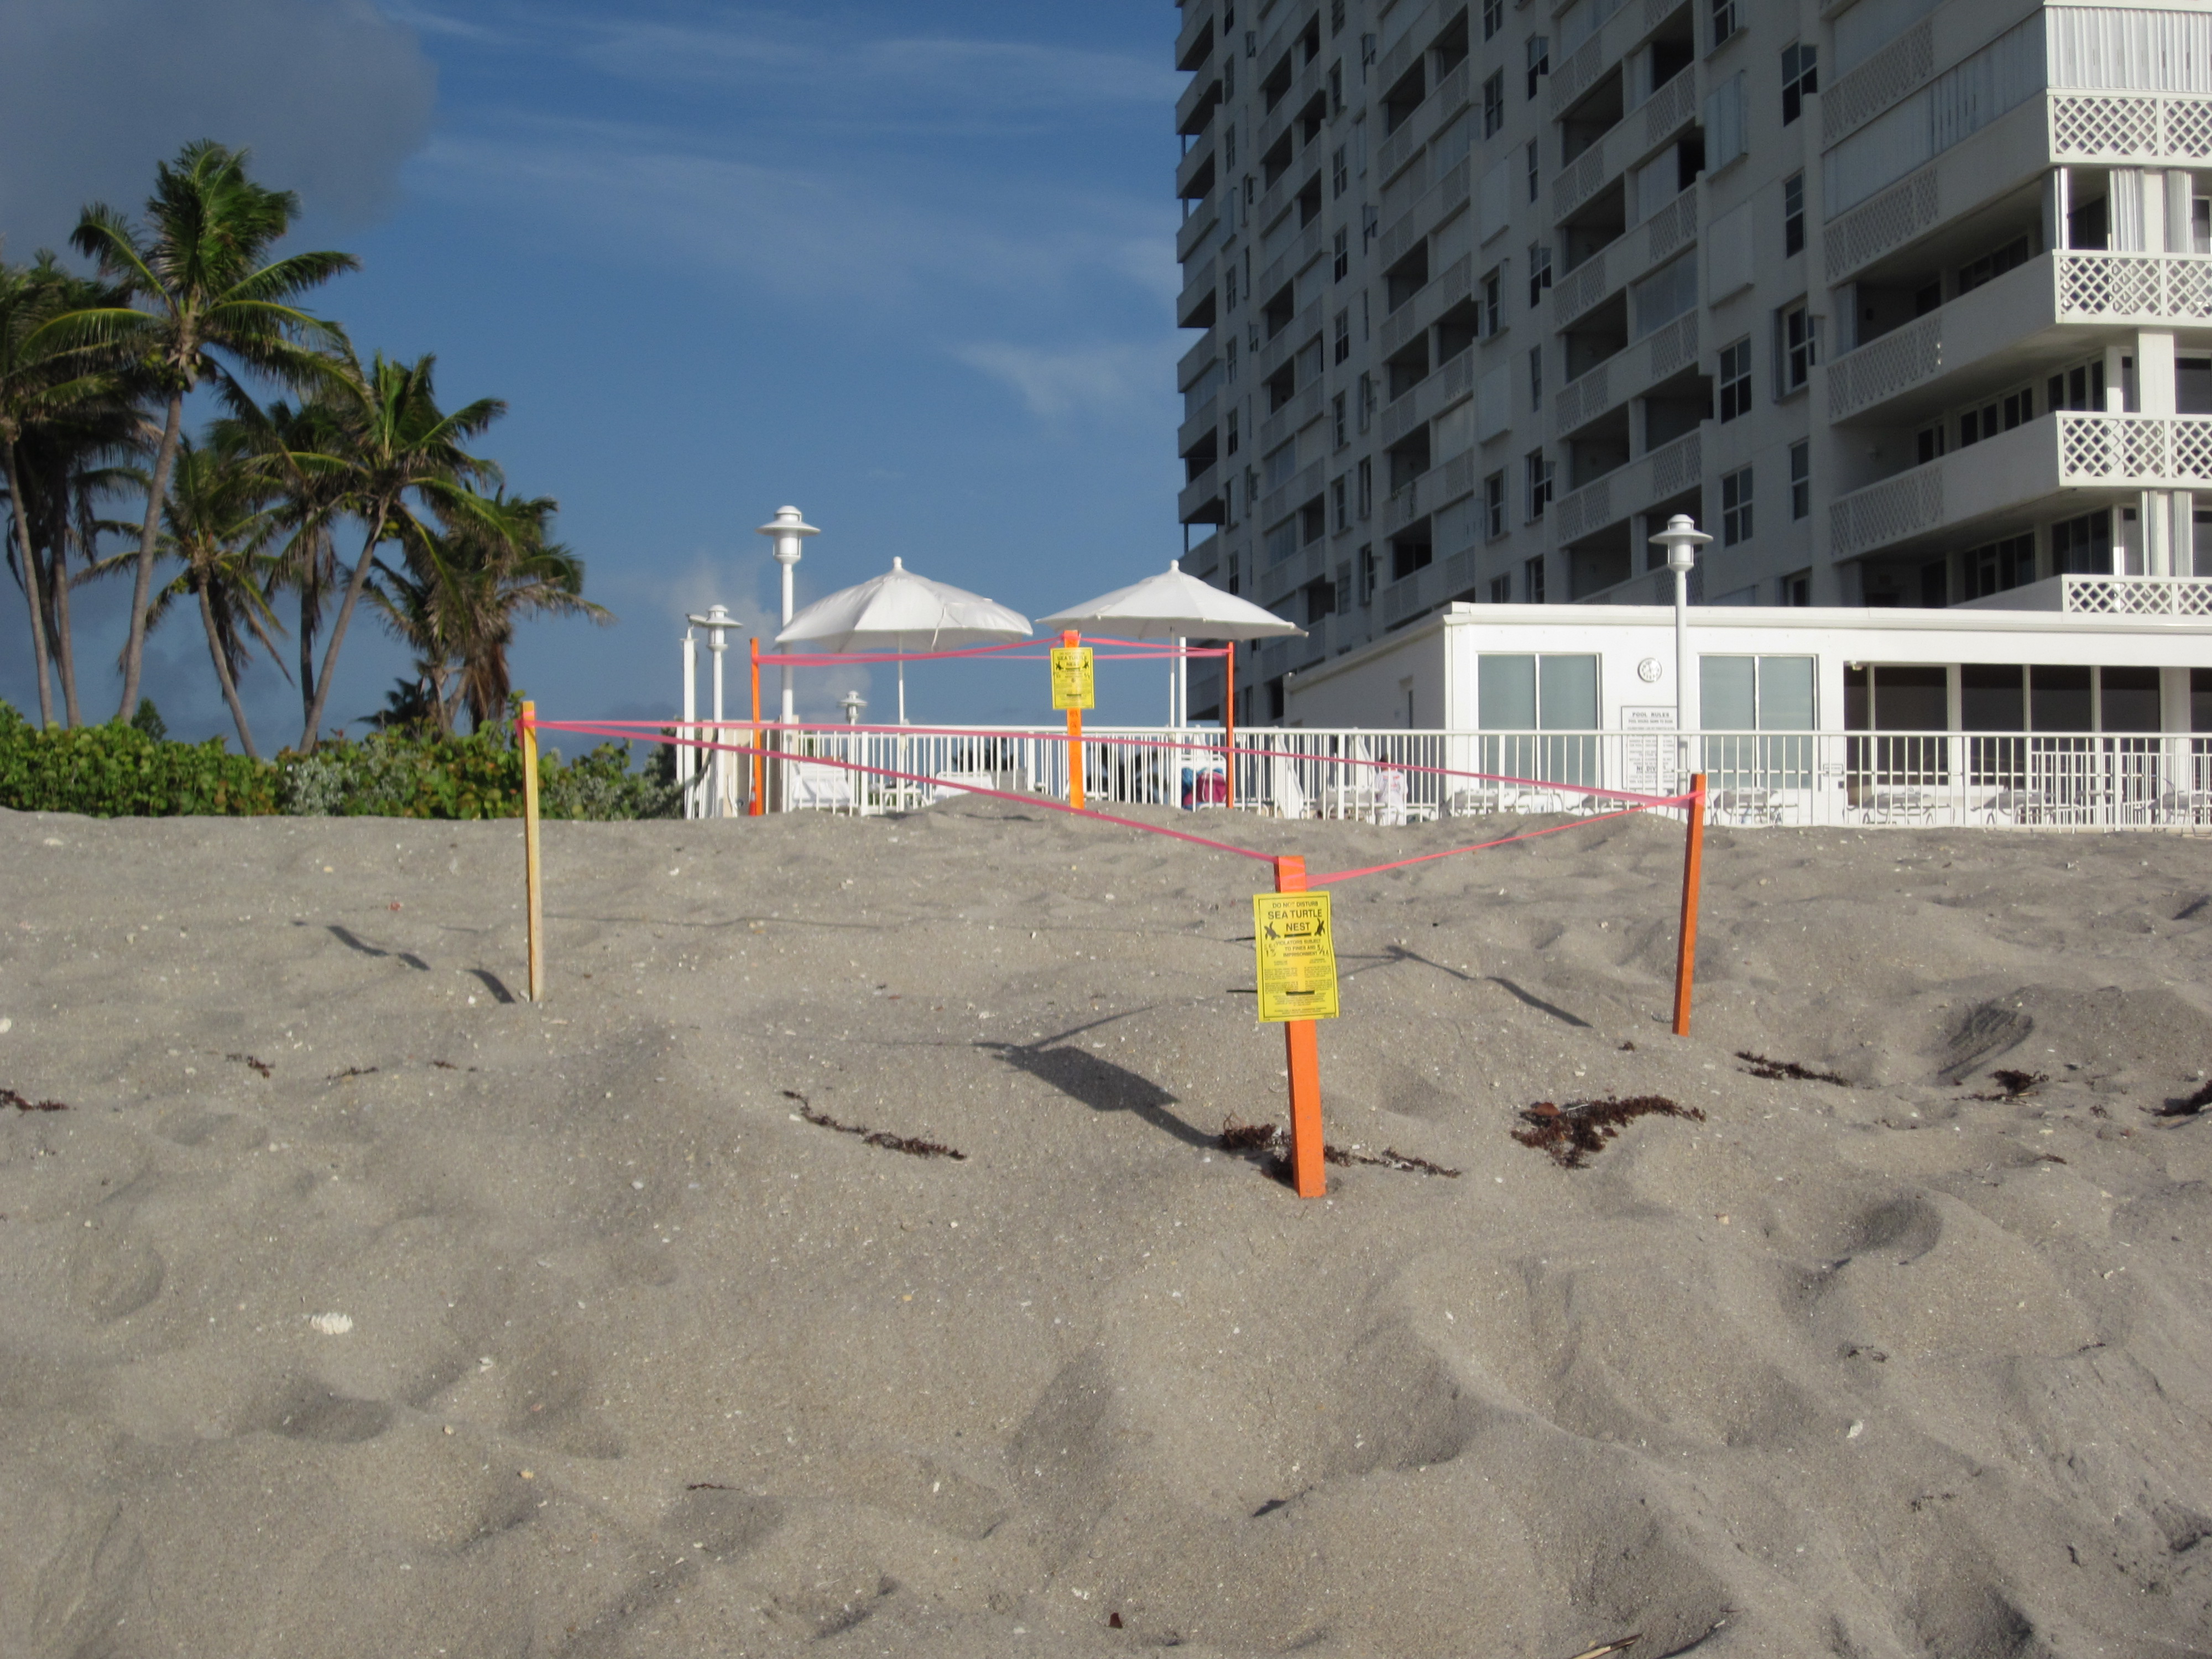
![By Conservation Measures Partnership (Open Standards for the Practice of Conservation) [Public domain], via Wikimedia Commons](http://en.wikipedia.org/wiki/Adaptive_management#mediaviewer/File:CMP_Cycle_-_2008-02-20.jpg)
Reminder - Complete all of the Module 13 tasks!
You have reached the end of Module 13! Double-check the to-do list on the Module 13 Roadmap to make sure you have completed all of the activities listed there.
References and Further Reading
- Coastal cities and sea level rise, Coastal Wiki
- Miami: Rising Seas, Sinking Infrastructure: Miami's Climate Conundrum. Kennedy School Review
- Frazier, T. G., N. Wood, and B. Yarnal. 2010. Stakeholder perspectives on land-use strategies for adapting to climate-change-enhanced coastal hazards: Sarasota, Florida. Applied Geography 30 (4):506–517
- NOAA Climate.gov: Restoring Surfer's Point