Scenarios
ScenariosPrioritize...
When you've completed this section, you should be able to:
- Define what a "climate scenario" is and why it is important for climate models to predict the future.
- Briefly describe how the scientific community defines scenarios has evolved over the past three decades, from Special Report on Emissions Scenarios (SRES) to Representative Concentration Pathways (RCP) to Shared Socioeconomic Pathways (SSP) and understand key improvements along the way.
Read...
OK, we've explored how climate models are excellent tools for "testing" different climate hypotheses, but I promised we'd also look ahead! Technically, projecting the future with these models isn’t all that complicated—we just start the models in the year 2025 and let them run forward. Remember, we're still focused on statistics, not predicting specific weather events or pinpointing exact outcomes.
But here’s the catch—when we “recreated” past climates with our models, we had the benefit of using observed data, like actual greenhouse gas concentrations. Looking forward raises a whole new set of questions! For instance, how will greenhouse gas concentrations change over time? Will they stabilize quickly, taper off later this century, or continue increasing at the same rate—or even faster? The answer depends on many factors, including technological advancements and decisions made by governments and policymakers about energy, the economy, and environmental priorities. If predicting future weather and climate is tough, predicting human behavior is even harder! To account for these unknowns, scientists use a range of scenarios to explore different possibilities for future emissions, air pollution, and land-use changes.
Scenarios: Mapping Out Plausible Futures
To address these uncertainties, scientists rely on something called scenarios. In climate modeling, a scenario is a “what if” story about the future. These stories give us plausible narratives for how greenhouse gas emissions, air pollution, land use, and socioeconomic conditions might evolve over time. For example, a scenario might imagine a future where humanity takes aggressive action to curb emissions by switching to renewable energy sources like wind and solar, while another might assume continued reliance on fossil fuels and little international cooperation between different countries. Importantly, these scenarios aren’t meant to predict the future—they aren’t crystal balls. Instead, they offer a way to explore different possibilities, helping scientists understand how various choices and actions could shape the climate.
Think of scenarios as roadmaps with different paths we might take, depending on technological developments, policy decisions, and societal priorities. Why are they important in this lesson? They act as inputs for climate models, setting the stage for researchers to simulate how the climate might respond under different conditions. Climate models are run multiple times under these different scenarios and by comparing the results, scientists can identify the potential consequences of specific pathways, providing valuable insights for policymakers, businesses, and communities. For example, one scenario might show limited warming if emissions peak soon and decline rapidly, while another might reveal significant warming and widespread impacts if emissions continue to rise unchecked. These insights help decision-makers weigh the risks and benefits of different strategies for addressing climate change. Over the rest of this page, we'll take a quick trek through the history of how these scenarios have evolved and changed.
The earliest storylines
Early in the history of climate modeling, scenarios were based on the Special Report on Emissions Scenarios (SRES), which came from the Intergovernmental Panel on Climate Change, or IPCC.
The Intergovernmental Panel on Climate Change (IPCC) is a United Nations body established in 1988 by the World Meteorological Organization (WMO) and the United Nations Environment Programme (UNEP) to assess the science related to climate change. It synthesizes research from scientists worldwide to provide policymakers with regular, evidence-based assessments on climate change, its impacts, and options for adaptation and mitigation. While the IPCC itself does not conduct research or develop models, it compiles and evaluates the results of climate simulations produced by General Circulation Models (GCMs) and Earth System Models (ESMs) from research institutions globally.
For climate models, the IPCC standardizes experiments and integrates model outputs into its Assessment Reports (ARs), which are published every six to seven years. These reports use scenarios like the ones we are learning about in this lesson to explore possible future climate trajectories based on different greenhouse gas emission levels and policy decisions. The IPCC’s work ensures consistency across models, enabling scientists to evaluate long-term climate risks and helping guide international climate policies like the Paris Agreement.
The SRES scenarios were quite simple. Each storyline painted a different picture of how global society, technology, and energy use might evolve... I won't make you remember the actual "letter/number" combinations, but some examples are...
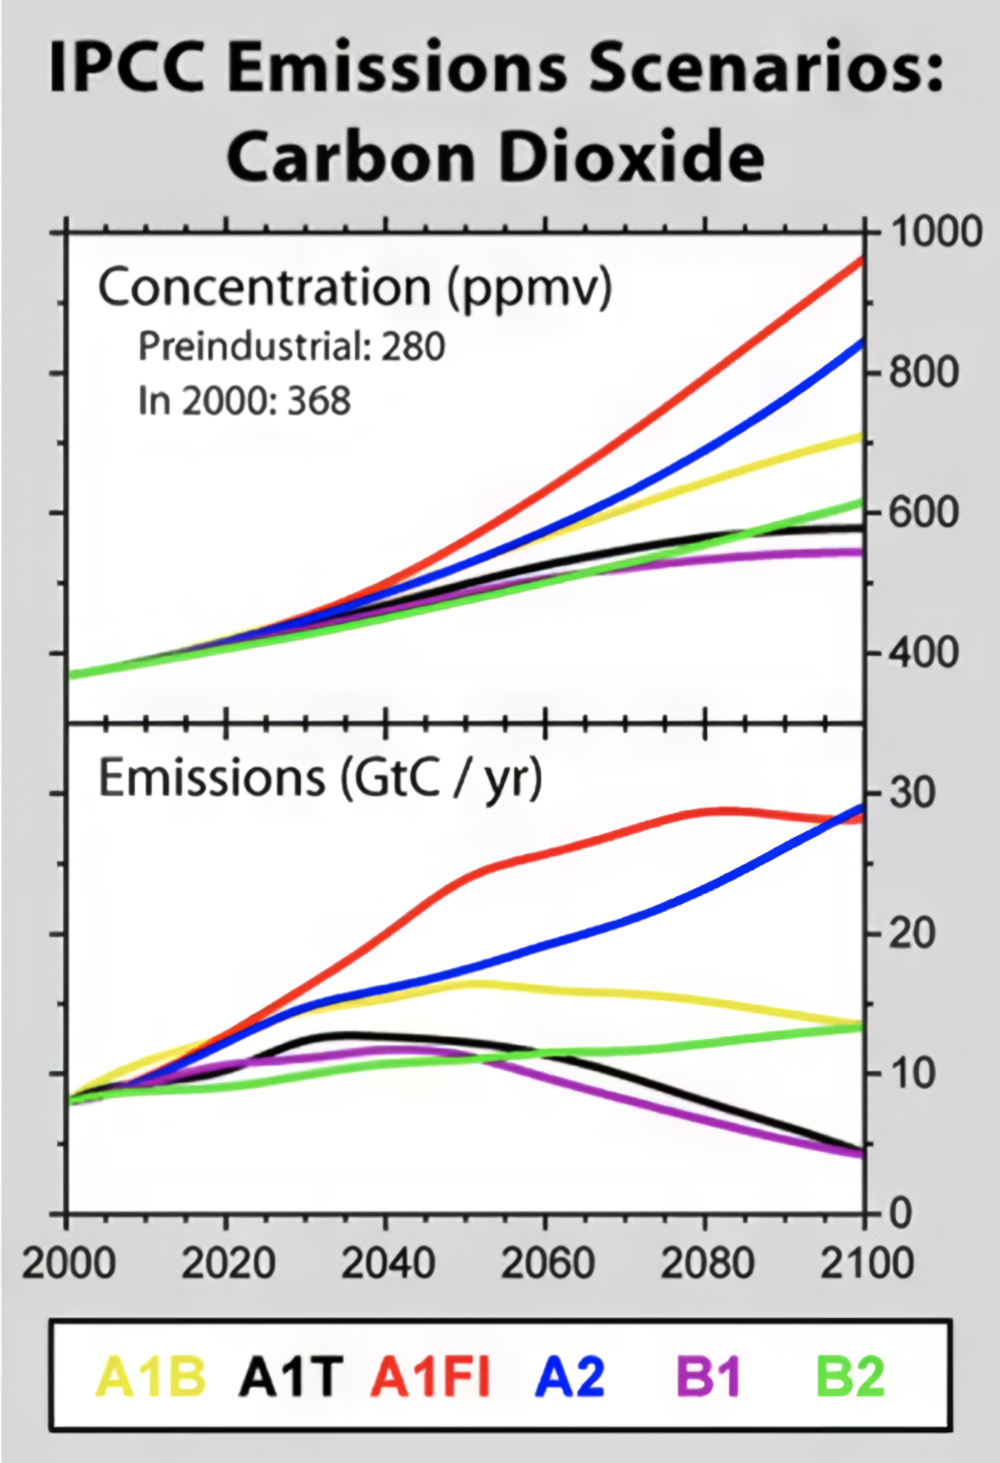
- The A1 storyline imagined a highly globalized world with rapid economic and technological growth. Within this storyline, sub-scenarios ranged from fossil-fuel-intensive development (A1FI) to a balanced energy mix (A1B).
- The A2 storyline depicted a more fragmented world, focused on national identities and slower technological progress, resulting in less global cooperation.
- The B1 and B2 storylines assumed more sustainable futures, with B1 emphasizing global cooperation toward environmental stewardship, and B2 focusing on regional efforts to achieve sustainability.
These storylines gave scientists a framework for modeling a broad spectrum of futures, from optimistic to worst-case scenarios. For instance, under the B1 scenario, carbon dioxide (CO₂) concentrations were projected to double relative to pre-industrial levels by 2100. In contrast, the A1FI scenario envisioned a fossil-fuel-heavy future, leading to CO₂ concentrations that could quadruple pre-industrial levels. The figure below illustrates the carbon emissions per year and the atmospheric concentrations of CO2 associated with each scenario. The A1FI is kind of "off the charts" ballooning our CO₂ concentration, while the B1 scenario assumes countries aggressively work together to combat climate change.
These early scenarios were groundbreaking because they represented some of the first systematic attempts to imagine and quantify possible futures for greenhouse gas emissions. They allowed scientists to model how different paths for economic growth, technological development, and societal choices could affect climate change. However, they had a notable limitation: they didn’t explicitly include the impact of policies aimed at reducing greenhouse gas emissions.
In other words, while the SRES scenarios accounted for broad societal trends—like whether the world became more globalized or whether economies relied more on renewable energy versus fossil fuels—they didn’t factor in specific actions to address climate change, such as implementing a carbon tax or international agreements. This omission meant that the scenarios couldn’t directly explore how intentional efforts to limit emissions might shape future climate outcomes. For example, they didn’t ask, “What happens if we aggressively cut emissions in the year 2030 to stabilize atmospheric carbon dioxide at a specific level?”
The Rise of RCPs: Adding Policy to the Equation
To address the gaps in earlier scenarios, the IPCC introduced Representative Concentration Pathways (RCPs) as part of its Fifth Assessment Report. These pathways offered a major improvement by explicitly including climate mitigation policies. Unlike the SRES scenarios, which focused on socio-economic storylines without specific climate action, RCPs are defined by their radiative forcing—the net change in Earth’s energy balance (in watts per square meter, W/m²)—projected for the year 2100. Remember, forcing measures how much energy the Earth retains due to factors like greenhouse gases, with higher values corresponding to greater warming. Bigger forcing numbers are like increasing the insulation on our cocoa mug, keeping more heat in!
Each RCP corresponds to a different level of radiative forcing, which in turn reflects varying levels of emissions and mitigation efforts:
- RCP2.6: This represents a very aggressive mitigation scenario where global greenhouse gas emissions peak soon and decline sharply, aiming to limit warming to around 2°C above pre-industrial levels. Achieving this pathway would require rapid reductions in fossil fuel use, widespread adoption of renewable energy, and potentially the use of negative emissions technologies like carbon capture.
- RCP4.5: This scenario assumes moderate mitigation efforts, leading to emissions peaking mid-century and then declining. It reflects a future where policies are implemented to stabilize emissions, and the radiative forcing is stabilized at 4.5 W/m² after 2100.
- RCP6.0: Similar to RCP4.5, but with less ambitious mitigation, this pathway assumes emissions stabilize later in the century, leading to a higher radiative forcing of 6.0 W/m². This scenario might represent a slower global transition to renewable energy or delayed policy implementation.
- RCP8.5: Often referred to as the “business-as-usual” scenario, this pathway assumes no significant global efforts to reduce emissions. Fossil fuel use continues to rise, and radiative forcing reaches 8.5 W/m² by 2100, leading to the highest levels of warming among the RCPs. This scenario is often used to explore the potential worst-case outcomes of climate change.
What makes the RCP scenarios stand out compared to the older SRES scenarios? Let’s look at one example (in the figure below). The RCP scenarios began incorporating projections for factors like human population (left in the chart) and gross domestic product ( GDP, center) when estimating carbon dioxide emissions (right).
Take population growth, for instance. If the Earth’s population grows, it means more demand for energy. Even if renewable energy production increases, a larger population often means we’ll still need to rely more on fossil fuels to bridge the gap. The RCP scenarios take this into account with a straightforward assumption: “more people, more energy demand, more emissions, more carbon dioxide.” While this might feel like an oversimplification, at first glance, it tracks.

© 2015 Dorling Kindersley Limited.
From RCPs to SSPs: Incorporating Human Choices
While RCPs marked an important step forward in projecting future climate scenarios, they still had limitations. One key shortcoming was their lack of direct linkage to specific socioeconomic and policy decisions. For instance, RCPs focused solely on the resulting greenhouse gas concentrations and radiative forcing levels. They did specify policies but in sort of a magic "global-dictator" like sense (i.e., the world will do X in year Y). However, they didn't incorporate how human choices—like technological innovation, economic trends, or political agreements—might lead to those outcomes.
To address this gap, the Sixth IPCC Assessment Report introduced Shared Socioeconomic Pathways (SSPs). SSPs provide an even more comprehensive framework by integrating socioeconomic factors like inequality, energy policies, and international cooperation into climate projections. This approach helps scientists and policymakers understand not just where we might end up in terms of emissions, but how human decisions influence those trajectories. In other words, what path do we take along the way? As people are walking along the path, how do they make decisions when they come to a fork?
SSPs are named based on a combination of their socioeconomic pathway and associated radiative forcing level by 2100. The first number in the name indicates the general storyline of socioeconomic development (ranging from SSP1, which emphasizes sustainability, to SSP5, which focuses on fossil-fueled development). The second number refers to the radiative forcing level (in watts per square meter) associated with that pathway. For example, SSP1-1.9 represents a highly sustainable socioeconomic scenario paired with aggressive mitigation efforts, achieving a radiative forcing level of 1.9 W/m² by 2100. Similarly, SSP5-8.5 describes a fossil-fuel-intensive development pathway leading to 8.5 W/m² of radiative forcing.
Consider SSP1-1.9, often referred to as the "Sustainability" or "Green Road" pathway. This scenario envisions a world focused on sustainable development, where governments prioritize reducing inequality, investing in renewable energy, and achieving net-zero emissions by the middle of the 21st century. In this pathway, economic growth is high, but it’s decoupled from heavy reliance on fossil fuels, and there’s strong global cooperation to tackle climate challenges. SSP1-1.9 aligns with a radiative forcing level of 1.9 W/m² by 2100. In contrast, SSP5-8.5, known as the "Fossil-Fueled Development" pathway, assumes rapid economic growth fueled by continued reliance on fossil fuels, minimal policy intervention, and a lack of global cooperation. This scenario leads to a radiative forcing level of 8.5 W/m² by 2100, driving global warming toward the upper end of projections, with catastrophic consequences for ecosystems and human societies.

The SSP framework is incredibly flexible, allowing scientists to combine different socioeconomic pathways with varying climate policy assumptions to explore a range of future possibilities. Take a look at the figure above—it organizes the SSPs based on their challenges for climate mitigation (vertical axis) and adaptation (horizontal axis). Each pathway presents a unique narrative about how socioeconomic factors, such as population growth, economic trends, and policy decisions, might shape humanity's ability to address climate change.
For instance, SSP5 assumes high challenges for mitigation (we don’t take significant steps to reduce greenhouse gas emissions, meaning they continue to rise) but low challenges for adaptation (countries actively work together to address the impacts of climate change, such as sharing financial resources or providing disaster relief). On the other hand, SSP3 is much more troubling. In this scenario, greenhouse gas emissions remain high (placing it high on the y-axis), but countries become more isolated, focusing on their own interests and refusing to cooperate globally. This creates high challenges for adaptation as well, making it a scenario where the world struggles to effectively respond to climate impacts. This framework helps us understand how different choices and policies could influence our collective ability to address climate change.
Summary of the history of climate scenarios
I've included a handy-dandy table covering what we've discussed here so you can better interpret how our climate model scenarios have evolved from SRES to RCP to SSP.
| SRES | RCP | SSP | |
|---|---|---|---|
| Full Name | Special Report on Emissions Scenarios | Representative Concentration Pathways | Shared Socioeconomic Pathways |
| Introduced | 2000 | 2014 | 2021 |
| Socioeconomic Assumptions | Fixed, defined storylines (A1, A2, B1, B2) | Flexible, with implicit socioeconomic assumptions for achieving forcing targets. | Directly linked to human choices and policy decisions |
| Climate Policies | None | Based on radiative forcing targets | Included and linked to human choices |
| Radiative Forcing | Based on emissions | Core metric for defining scenarios | Combined with socioeconomic pathways (e.g., SSP1-2.6) |
| Emissions Pathways | Defined purely based on storylines | Flexible, driven by radiative forcing targets | Based on socioeconomic and policy scenarios |
| Focus | Purely emission trajectories | Radiative forcing by 2100 | Combination of societal factors and climate forcing |
As of now, the SSPs are the standard framework used in climate models to predict the future, but that doesn’t mean they’ll stay this way forever. For example, SSPs currently focus on broad narratives of global cooperation or non-cooperation, but they don’t account for more specific geopolitical shifts, like the European Union expanding or breaking up. They also don’t factor in how humans might respond to major climate events—for instance, if a series of catastrophic global floods were to occur in 2050, it’s reasonable to expect policymakers to adapt quickly and change course. As our understanding of climate systems, geopolitics, and human behavior evolves, it’s likely that these frameworks will become more sophisticated. And, of course, we’ll need to keep updating our scenarios as real-world events and policies unfold in real time!