Lesson 11: Climate impacts, inequities, and climate justice
Lesson 11: Climate impacts, inequities, and climate justiceMotivate...

Let's suspend reality for a second. Penn State has a crucial basketball game on tap. Unfortunately, all their players start the game with three fouls, while the other team gets to send a couple of extra players onto the court. Referees should be there to keep things in check, but they seem more preoccupied with what they are having for dinner after the game rather than keeping everyone in line. No matter how hard PSU tries, the odds are stacked against them. This scenario sounds incredulously unfair (and thankfully is just a hypothetical!), but it is an all-too-real reflection of how climate challenges play out across the world. When it comes to what society is facing today with regard to climate change, not everyone is affected equally—nor responsible equally—and addressing these injustices is what we'll explore in this lesson.
Climate change is not just a scientific and environmental issue - it's a human issue that cuts across social, economic, and political lines. Wealthier nations have historically emitted far more greenhouse gases, fueling the industrial engines of progress, while less affluent countries, often contributing the least to the problem, bear the brunt of its impacts. Rising seas, extreme weather, and droughts force families from their homes, creating climate migrants in need of support and protection. Meanwhile, within cities, long-standing inequalities leave marginalized communities disproportionately vulnerable to extreme heat, flooding, and pollution.
But this lesson isn't just about identifying problems - it's about envisioning solutions. Climate and environmental justice demand equity, fairness, and the active involvement of all voices, especially those excluded or harmed. From increasing green spaces in urban areas to strengthening legal systems that hold corporations accountable, we'll learn how solutions can prioritize those most affected. Concepts like climate reparations and corporate accountability aim to address the imbalance of climate change impacts by providing financial resources and systemic changes to support resilience, adaptation, and/or recovery.
We'll also explore how science contributes to justice. Tools like detection and attribution allow us to pinpoint the fingerprints of human influence on extreme weather events, providing the evidence needed to hold responsible parties accountable. Climate litigation and reparations aim to right historical wrongs and secure a fairer future, while corporate accountability movements challenge polluters to change their ways or face consequences.
Climate science isn't just about math and physics, observations and models - it's about people. It's about ensuring that no one is left behind and that no group of people bears an unfair burden. As we learn about these concepts, we'll discover that justice isn't just an ideal (or even an allegory) - it's a necessity for building a sustainable and equitable future for everyone.
Introduction to Environmental and Climate Justice
Introduction to Environmental and Climate JusticePrioritize...
After completing this section, you should be able to:
- Define environmental and climate justice and list the three core pillars of both.
- Give at least one example of an environmental or climate injustice.
Read...
Imagine you're in a classroom where everyone has an equal opportunity to learn. The teacher doesn’t just hand out the same textbook to every student and call it “fair.” Instead, they (hopefully) provide tailored support to those who need it—whether that means offering extra help, a quiet place to focus, or even translating the material into another language! This is what true justice looks like: going beyond equality to ensure everyone has the tools they need to succeed.
Analogy aside, let’s zoom out a bit. What if we applied this concept of justice to the environment and climate? That’s where the ideas of environmental justice and climate justice come in. They remind us that fairness isn’t just about equal distribution; it’s about meaningful inclusion and equity in environmental decision-making. It’s about ensuring that no one, regardless of race, income, or geography, is unfairly burdened by environmental harm—or left out of the conversation about how to fix it.
Key Definition
Environmental Justice
The United States Environmental Protection Agency (EPA) defines environmental justice as “the fair treatment and meaningful involvement of all people regardless of race, color, national origin, or income with respect to the development, implementation, and enforcement of environmental laws, regulations, and policies. The EPA has this goal for all communities and persons across this Nation. It will be achieved when everyone enjoys the same degree of protection from environmental and health hazards and equal access to the decision‐making process to have a healthy environment in which to live, learn, and work.”
More simply, there are three core pillars of environmental justice.
- Equity: No group should suffer more environmental burdens or enjoy fewer environmental benefits than others.
- Human Rights: Protecting and promoting human rights as a fundamental part of environmental action.
- Participation: All communities must have a say in decisions that affect their environment and health.
What’s an example of an environmental injustice? See the graph below. It illustrates disparities in exposure to particulate matter, a form of pollution harmful to health. In particular, it shows exposure to PM 2.5, fine particles with diameters generally 2.5 micrometers and smaller. These particles are easy to inhale and can get deep into the lungs where they can cause respiratory diseases. Black Americans face greater-than-average exposure from nearly every major source, including construction, power plants, and industrial facilities. In contrast, white Americans experience lower-than-average exposure across most sources. These data highlight stark inequities in environmental burden and risk. Statistically, if you are a black American, you are far more likely to get sick from air pollution. This disparity is a direct consequence of systemic issues, such as the historical placement of polluting facilities in areas of less affluence near marginalized communities.

OK, while I’ve defined “environmental justice,” you may wonder how it relates to “climate justice.” Are they two different things? Not really. In fact, climate justice is a natural extension of environmental justice. It zeros in on the ethical dimensions of climate change, emphasizing how its impacts disproportionately harm vulnerable communities. The core principles of climate justice mirror those of environmental justice but specifically frame things through the lens of climate change. Let’s revisit the three pillars from above…
- Equity: Climate justice highlights the fact that those who contribute the least to climate change—like low-income and marginalized communities—are often the hardest hit. It ensures that policies to address climate change are fair and inclusive.
- Human Rights: Protecting human rights is central to both environmental and climate justice, ensuring that every person has access to a safe, healthy, and sustainable environment.
- Participation: Climate justice calls for amplifying the voices of those most affected by climate change, ensuring they have a meaningful role in shaping solutions.
Simply put, both of these flavors of justice share a single, common goal: a fairer, more inclusive world where the burdens of environmental harm and the benefits of climate solutions are shared equitably by all.
Quiz Yourself...
The Disproportionate Emissions of Climate Change
The Disproportionate Emissions of Climate ChangePrioritize...
After completing this section, you should be able to:
- Understand which countries and regions have historically emitted most of the world's greenhouse gases.
- Define the "Global North" and "Global South" and give some examples of countries in each region.
Read...
OK, so now we’ve locked in some definitions… but what exactly is inequitable with climate change? In the last couple of lessons, we’ve discussed climate change and its possible impacts. I mean, extreme heat, rising sea levels, acidifying oceans, increased flooding… sounds pretty bad for everyone, right? But to understand climate justice, we need to understand climate injustice: who causes climate change and who's hurt by it.

Check out the graph above. This shows global carbon dioxide emissions – our "primo" greenhouse gas -- in 2021, broken down by country and region. Note how the emissions don't seem to be evenly allocated. For example, more than 1 out of every 3 molecules of carbon dioxide emitted to the atmosphere were emitted by China and India (38% between the two!). The United States emits almost 85% of all the carbon dioxide that comes from North America, more than 5 times that of Canada and Mexico combined! It is clear that different countries are emitting at different rates.
We could also get a historical perspective by evaluating how emissions have evolved over time. The graph below is an area chart – time is on the x-axis, and the area "fanning out from the plume" is the relative emission contribution. Emissions have increased globally since 1950 (plume getting wider), which is unsurprising based on what we know. While we just learned China and the United States are the big emitters currently, the United States and Europe were the key emitters until around the 1970s China’s contribution didn’t really start increasing until around 1980 and then exploded during the 2000s. Comparatively, all of Africa and South America (the purple and green curves), two entire continents, have emitted only a tiny fraction of the carbon dioxide!

So, all of the above implies that not every country should be considered “equal” in contributing to carbon dioxide emissions. Is there a way we can actually measure the imbalance? Is there a way we can actually measure this imbalance? In 2020, scientists developed a new approach to identify which countries bear the most significant responsibility for climate change damage (link to study, but not required reading!). Their method started with a simple “rule:” Every nation (and every citizen of every nation) should have an equal right to use the atmosphere. They used a benchmark of 350 parts per million (ppm) of CO2 in the atmosphere—considered a “safe” level based on research using some of those climate scenarios we talked about—and calculated each country’s fair share of the global carbon budget needed to stay under that threshold.
To do this, they compared each country’s actual CO2 emissions to its fair share, looking at two periods: territorial emissions (1850–1969) and consumption-based emissions (1970–2015). Territorial emissions refer to the CO2 released within a country’s borders, while consumption-based emissions account for emissions embedded in goods and services imported and consumed. In other words, if it took a lot of energy to build a TV in China that was shipped to the United States, that was also considered (so countries can't just "outsource" their pollution and say, "not my fault!")
This comprehensive timeline allowed them to track how countries used their emission allocation. “Excess” CO2 means countries have emitted more than equitably. Here’s what they discovered:
- By 2015, the United States alone was responsible for 40% of the excess CO2, while the European Union (EU-28) accounted for 29%.
- The G8 nations (the United States, EU-28, Russia, Japan, and Canada) contributed 85% of the excess.
- 90% was accounted for by countries categorized as Annex I under the UN Framework Convention on Climate Change (wealthier, industrialized nations).
- The Global North, a term that includes most developed nations, contributed 92% of the excess CO2.
Meanwhile, many countries in the Global South—primarily developing nations—remained within their fair share of emissions. For instance, despite their large populations, India and China had not yet exceeded their limits as of 2015, although China is projected to surpass its fair share soon (and may have by the time you are reading this).
Key Definition
Global North and Global South
The terms "Global North" and "Global South" refer to a way of categorizing countries based on socioeconomic and political factors rather than geography. The Global North includes wealthier, industrialized nations like the U.S., Canada, Europe, Japan, and Australia, while the Global South comprises developing and least-developed countries, including much of Africa, Latin America, and Asia. Countries in the Global South often face challenges such as lower incomes, limited access to education and healthcare, and infrastructure deficits, whereas the Global North is characterized by diversified economies and higher living standards.
This research highlights an important – albeit somewhat uncomfortable -- truth: wealthier countries have historically contributed far more to climate change than previously recognized. By centering the idea of equal atmospheric rights, this method provides a fairer way to assess which nations bear the greatest responsibility for addressing climate damage.

Quiz Yourself...
The Disproportionate Impacts of Climate Change
The Disproportionate Impacts of Climate ChangePrioritize...
After completing this section, you should be able to:
- Explain how climate impacts can be "decoupled" from emissions, and give at least one example of how poorer countries may bear the brunt of climate impacts at the expense of richer, highly emitting ones.
- Define Gross Domestic Product (GDP) and explain why it's helpful in understanding "uneven" climate impacts.
Read...
We’ve established that the “Global North” emits more greenhouse gases than the “Global South.” And if you are concerned with restricting global CO2, this inequity in emissions means that the “Global North” must recognize it as such. But emissions are just one side of the coin. The other side—and to be honest, the real injustice—is how climate change disproportionately impacts countries with the least responsibility for causing it.
Things wouldn’t be unfair if impacts were proportional to emissions. If climate change were like a restaurant bill split based on who ordered what—you had an extra drink and ordered the most expensive dessert, so you pay your fair share—that would make sense. But imagine sitting at the table while your friend drinks the priciest bottle of wine (all by themselves!), racks up the biggest tab, and then suggests, “To make it easy, let’s just split the check evenly!” Not ideal, right?

Climate change doesn’t hit everyone equally. Unfortunately, it overwhelmingly tends to magnify existing inequalities and hits those least equipped to handle its effects the hardest. Nations that have contributed the least to global emissions—the ones that historically used fewer resources—are, in many cases, now the most vulnerable to climate disasters. Meanwhile, wealthier, industrialized countries that released the bulk of greenhouse gases have the financial resources to buffer themselves against the worst impacts. This imbalance is one of the defining injustices of our time. Do you believe that poorer countries are getting the short end of the stick? Let’s look at why certain nations bear the brunt of the climate crisis.
Many poorer nations are located in regions particularly vulnerable to climate change—low-lying islands, arid zones, and tropical areas. These places face rising sea levels, more intense droughts, heatwaves, and storms. For example:
- Small island nations like Kiribati and the Maldives are grappling with the existential threat of rising seas. Entire communities are being displaced as their homes are swallowed by the ocean.
- Sub-Saharan Africa is enduring prolonged droughts and extreme heat, devastating agriculture and putting millions at risk of famine.
- South Asia, including heavily populated countries like Bangladesh, faces severe flooding and cyclones, displacing millions and eroding already fragile infrastructure.
Look at the image below—it's a striking example of what I mean. This graphic comes from the IPCC AR6 report we’ve referenced before. It maps the projected number of days different regions around the world will experience extreme heat and humidity by the end of this century. The top row is the “present” day (note that unfortunate IPCC typo… “pressent!”), and the three columns in the bottom two rows represent three climate scenarios we discussed in the last lesson for the middle and end of the 21st century.
As expected, we see an increase in "redder" colors across the map, signaling more days of extreme heat as the climate warms. That part isn’t surprising—as our surface air temperature distribution shifts to higher values, we know we should expect fewer extreme cold events and more extreme hot ones. But look closely at where these increases are most pronounced. It’s not the densely populated areas in the mid-latitudes—countries like the United States, Europe, or most of China. Instead, the ballooning extremes are occurring in regions like northern South America, sub-Saharan Africa, India, and parts of the Pacific. These areas are often less economically developed (and we’ll dive into why that matters in just a moment).

But geography is not the only factor. A nation’s resources make a huge difference. Wealthier nations have infrastructure and systems in place to protect their residents—seawalls, advanced weather forecasting, and disaster relief programs. In contrast, many developing nations lack these safety nets. A heatwave in Europe might mean higher electricity bills for air-conditioning, but in South Asia, it can lead to mass casualties for people without access to cooling or reliable power grids. Flooding in the Netherlands is mitigated by one of the world's most sophisticated systems of dikes and floodgates, preventing widespread devastation. Meanwhile, flooding in Bangladesh regularly displaces millions, as communities lack the infrastructure and resources to protect against rising waters. After a hurricane hits Florida, rebuilding efforts begin almost immediately, thanks to insurance and federal disaster funds. But after a cyclone devastates Mozambique, recovery can take years—or may never fully happen.
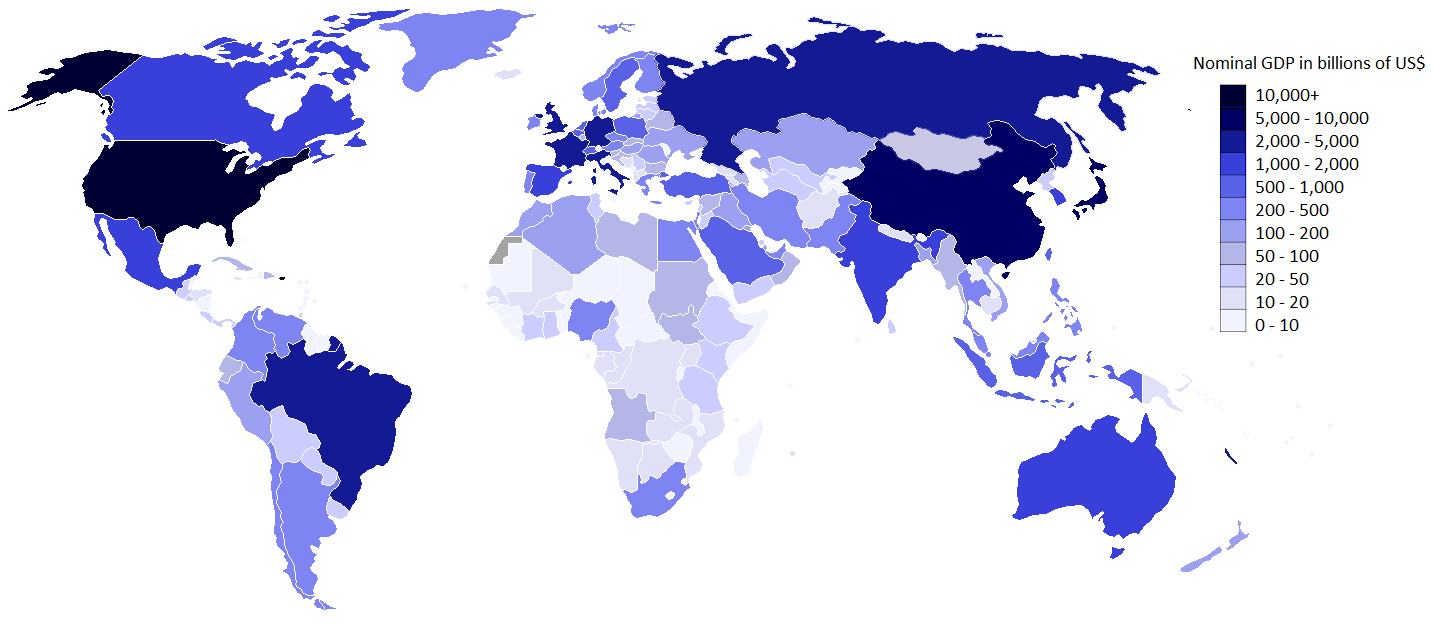
Wait, how can I say that Florida has more resources than Mozambique? Some of you may think, “That’s obvious,” but quantitative ways exist to evaluate it. One way to measure a country’s resources is through something known as Gross Domestic Product (GDP), a metric often used to quantify economic output and wealth. GDP is basically the total amount of money a country makes in a year from everything it produces and sells. You’ve probably heard the term on the news – economists and politicians love to talk about it!
Below is another map (we do love maps!) that shows the world’s nations by GDP. Darker blues to near-black represent wealthier, richer countries, while lighter shades closer to white indicate poorer ones. To put things into perspective, the GDP of the United States is generously about 1,000 times greater than that of Mozambique. It stands to reason that hurricane recovery resources would be much, much better in one country versus the other.
Now, scroll back up and take a moment to notice the inverse relationship between GDP and projected heat waves. The areas with lower GDP (the lighter areas on the map below) often align with regions facing the most dramatic increases in extreme heat (the redder areas on the map above). Sadly, this pattern isn’t unique; many global maps of economic and climate vulnerabilities tell a similar story.

The irony is hard to ignore: wealthier nations built their prosperity on a foundation of carbon emissions. Industrialization fueled the progress we often take for granted: the convenience of same-day delivery, year-round fresh produce, and the ability to fly across the country in hours. All of this was (and is) made possible by burning fossil fuels—and lots of them.
Despite their small carbon footprints, many poorer countries face the steepest costs of climate adaptation. For example, some of the things -- and far from an exhaustive list -- they must consider working on:
- Building seawalls to combat rising seas.
- Developing drought-resistant crops to cope with failing agricultural systems.
- Establishing disaster response systems to protect lives during increasingly frequent extreme weather events.
- Implementing water management systems to address shrinking freshwater supplies caused by prolonged droughts and glacial melt.
- Reforesting degraded lands to stabilize soil, reduce flooding, and sequester carbon, especially in regions like sub-Saharan Africa and Southeast Asia.
- Relocating entire communities from areas rendered uninhabitable by rising seas or desertification, a costly and logistically complex process faced by small island nations and arid regions.
- Investing in resilient healthcare infrastructure to combat the spread of diseases like malaria and dengue, which are becoming more prevalent due to shifting climate patterns.
For many nations in the Global South, these costs are insurmountable. When dealing with high poverty fractions across their populations, spending additional money on climate adaptation is a non-starter. The same countries that have been least responsible for emissions are now being asked to invest in solutions they can barely afford—solutions wealthier nations have long had the resources to develop.
Quiz Yourself...
Climate Migration and Refugees
Climate Migration and RefugeesPrioritize...
After completing this section, you should be able to:
- Define climate migration and what a climate refugee is, explain why climate migration occurs, and give an example of why someone would flee an area due to climate change.
Read...
We’ve already talked about how climate change hits certain places harder—think low latitudes or coastal areas. While geography is mostly fixed, people aren’t. When the impacts become too severe, it’s no surprise that many are forced to leave their homes to find safety and survive. This gives rise to one of today’s biggest humanitarian challenges: climate migration. In very simple terms, it’s when people are displaced because of climate change-driven disasters like rising sea levels, prolonged droughts, extreme storms, and other environmental disruptions.
Climate migration often stems from compounding vulnerabilities—multiple challenges that make it impossible to “just tough it out.” Here are some examples:
- Rising Seas: Low-lying island nations like the Maldives and Kiribati face the existential threat of being swallowed by rising sea levels. In Bangladesh, millions are being displaced as coastal land disappears under encroaching tides.
- Extreme Weather: Hurricanes and typhoons repeatedly devastate regions like the Caribbean and Southeast Asia, leaving communities with no option but to move after their homes are destroyed time and again.
- Drought and Water Scarcity: Prolonged droughts in sub-Saharan Africa and Central America are wiping out livelihoods for farmers who depend on rainfall, forcing families to leave in search of a more secure future.
The image below, originally published by the United Nations Environment Programme (UNEP) in 2005 and later modified, highlights areas where people might move away if climate impacts worsen. It’s qualitative, so don’t take it as definitive, but it aligns with some key topics we’ve covered. For instance, regions marked in purple could face growing challenges from wetter hurricanes in a warmer atmosphere (thanks to the Clausius-Clapeyron relationship: warmer air holds more moisture). Meanwhile, yellow areas might struggle with agricultural declines due to increased drought, making local crop production unsustainable. Take a moment to explore the map—while I won’t cover every detail, it’s worth seeing how these patterns connect to what we’ve discussed.

One major challenge is the lack of an international legal framework to protect "climate refugees." You might know—or maybe not—that there are international agreements for political refugees. The 1951 Refugee Convention defines who qualifies as a refugee, outlines their rights, and establishes rules for countries to protect them, including a critical principle: refugees cannot be forced to return to unsafe conditions. But no such protections exist for people displaced by climate impacts. This legal gap leaves millions in a precarious situation, unable to seek asylum or access international aid.
Take the Pacific nation of Tuvalu, for example. Its citizens face the harrowing prospect of becoming "stateless" as their homeland is swallowed by rising seas, and the nation has been vocal about the need to recognize climate-induced displacement as a refugee crisis. Similarly, communities in the Sahel region of Africa and Central America are being uprooted by a mix of climate stressors and political instability, making safe migration even more difficult.
So, you might be asking, how we do we solve this? It’s a difficult question, but some solutions to climate migration must balance humanitarian needs with proactive planning:
- International Cooperation: Developing a legal framework to recognize and protect climate refugees is essential. Organizations like the United Nations High Commissioner for Refugees (UNHCR) have called for action, but progress remains slow.
- Climate Adaptation: Investing in infrastructure, such as seawalls, resilient housing, and water management systems, can help communities adapt to climate impacts and reduce displacement.
- Economic Support: Programs that provide resources for adaptation can empower vulnerable communities to stay in place rather than being forced to migrate.
- Planned Relocation: In some cases, governments are initiating managed relocation efforts. For example, the government of Fiji has begun relocating entire villages threatened by rising seas, ensuring that communities are resettled together rather than scattered.
Quiz Yourself...
US Climate Justice and Redlining
US Climate Justice and RedliningPrioritize...
After completing this section, you should be able to:
- Define "redlining" and how redlining sets the stage for inequities within cities based on class and ethnicity.
- Explain how the urban heat island effect actually varies within a city and why this is the case.
Read...
When we talk about climate justice, it’s not just "far away global issues" -- it hits close to home, too. Even here in the U.S. – a country we’ve already noted as a high GDP one -- climate change impacts don’t play out equally across communities. Some groups, particularly low-income families, communities of color, and indigenous peoples, are hit harder. How does this happen?
First, you need to know that not all neighborhoods are created equal when it comes to dealing with climate change. Vulnerable communities are often located in areas more prone to flooding, extreme heat, and pollution. They’re also less likely to have the resources to adapt. For example, during a heatwave, wealthier neighborhoods might crank up the air conditioning or visit nearby cooling centers. However, lower-income areas may not have access to reliable AC or safe public spaces to cool off. Similarly, coastal communities composed of more marginalized populations face rising sea levels and stronger storms, but they often lack the financial means to rebuild after disasters, trapping them in a cycle of risk and recovery. This stands in stark contrast to coastal communities of more affluent denizens.
Redlining
These inequalities didn’t just happen by chance. They are deeply tied to systemic practices like redlining. Starting in the 1930s, redlining was a discriminatory policy in which banks and financial institutions refused to offer mortgages or loans to people in certain neighborhoods—usually communities of color. These areas were literally outlined in red on maps, signaling them as too risky for investment. This practice is where the term redline comes from. The result? Widespread disinvestment in these neighborhoods, leaving them with poor infrastructure, underfunded public services, and limited opportunities for growth.
Take Bedford-Stuyvesant in Brooklyn, for example. In the 1930s, a government appraiser assessed the neighborhood, noting its aging brownstones and residents who were mainly clerks, laborers, and merchants, with about 30% being foreign-born Jewiss and Irish. They also flagged "colored infiltration" as a negative factor. This led the Home Owners’ Loan Corporation to redline the area, labeling it “hazardous” for mortgages and cutting it off from critical investments. Check out the map below; these neighborhoods were literally marked in red.

Over time, redlined neighborhoods became more vulnerable to environmental hazards, offering a stark example of environmental racism. They were undesirable, not areas where new homeowners with wealth were flocking to. These are the same communities—often communities of color—that are disproportionately exposed to pollution and other environmental risks. Thanks to redlining and similar discriminatory practices, many minority neighborhoods ended up near factories, highways, and other sources of pollution. They often lack parks, green spaces, and clean air or water, and rarely receive the resources needed to deal with environmental challenges.
Unfortunately, the consequences are severe. Living close to industrial zones means increased exposure to air pollution, which leads to higher rates of asthma and other respiratory problems. When natural disasters like floods or hurricanes strike, these neighborhoods typically suffer the most because they already have underfunded infrastructure and poorly equipped emergency services.
Urban Heat Islands
But what does redlining have to do with climate change? On the surface, this feels like a social policy issue, not one that is concerned with climate science. Yet, the legacy of redlining is deeply intertwined with how communities experience the effects of climate change today. Let’s take a closer look at one example: urban heat islands.
We've already talked about these effects a bit. You may remember our earlier discussion about how cities can influence local climate, creating areas that are significantly warmer than their surroundings. What we didn't talk about was that urban heat islands are most intense in poorer neighborhoods, which often have disproportionately high Black and Hispanic populations. That is, the added "juice" to the air temperature from urbanization is highest in these redlined areas.
The figure below highlights this connection in Baltimore, Maryland. The map on the left shows surface air temperatures by zip code, while the map on the right shows income levels. Notice the pattern: the warmer areas (darker red) tend to overlap with the poorer neighborhoods (lighter green). Why is this happening? Redlined neighborhoods often lack trees and green spaces to provide shade and cooling. Instead, they’re dominated by concrete, asphalt, and other heat-trapping surfaces. These neighborhoods are also more likely to be near highways and factories, which adds to the problem.
And there’s another layer of inequity: the “double whammy” effect of heat generated elsewhere. In downtown business districts, for example, office buildings rely on air conditioning that pumps heat into the surrounding air. Really, that's all an air conditioner is doing -- moving heat from inside a building to outside. If you've ever walked by a central or window AC unit on a hot day, you've gotten a blast of hot air and you know what I am talking about! Breezes then carry this hot air into nearby residential areas—often poorer neighborhoods—making an already hot environment even hotter. It’s essentially a "heat island within a heat island," compounding the risks for the most vulnerable communities.
Take some time to go to this website to check out some other major cities and see if you see the same trends. You can even download their source code and play with it yourself if you are so inclined (not required!).

(left) Zip code level map of the magnitude of the urban heat island effect in Baltimore, Maryland and (right) the median income for those zip codes.
Quiz Yourself...
Cites and Heat
Cites and HeatPrioritize...
After completing this section, you should be able to:
- Explain why green spaces, like parks within cities, can reduce the urban heat island effect.
- Define what a "cool roof" is and how it works.
Read...
We've just established that specific neighborhoods in cities get the "raw end of the deal." It’s obvious how this effect can be tied to climate change, too. As carbon emissions increase global temperatures, the number of extremely hot days become more common and intense. As this happens, it further stresses the warmest areas of cities, the areas already registering as the hottest in our current climate.
Let’s use another specific example. Over the past 25 years or so, New York City has averaged 3 days above 95°F during the summer months. However, there are estimates that, by 2075, the number could increase to 31 days -- a factor of 10! Below is a map of New York City from the same source we discussed previously, with the “South Bronx,” an area with a historical legacy of redlining, circled. As we saw before, this area is less affluent and has one of the most intense heat island effects within New York City as a whole. The infrastructure in neighborhoods like the South Bronx, often neglected and underfunded, is ill-equipped to deal with extreme heat. Many residents live in public housing where antiquated wiring limits the use of air conditioners. This creates dangerous living conditions during heatwaves. These conditions exacerbate health issues and stress, particularly for vulnerable populations like the elderly, young children, and those with pre-existing health conditions.

Below is another look at the same city and the same data using a different map and colorbar. The South Bronx pops out with lots of bright, nearly white dots -- along with many other neighborhoods in New York City, too.

So, what can we do about all this mess caused by redlining and climate change? While it is by no means a solved problem, there are some solutions on the table. First, we could start by planting more trees in these neighborhoods. Trees provide shade, cool down the area, and clean the air – greening inner cities can have a huge “bang for your buck!”
In one study, researchers used satellite data and climate models to identify the best strategies for cooling New York City. They first looked at the figure below and noticed that areas with high amounts of vegetation (grass, trees, etc.) tended to be cooler than surrounding areas of asphalt and concrete. To see this, compare the vegetation map below with the heat island effect map above that we just looked at. Notice how all the darker areas with more grass, trees, and other plants correspond to cooler temperatures? For example, Central Park in Manhattan sticks out like a sore thumb! I've annotated a few others as well. Feel free to load up Google Maps and scan for the green spaces yourself!
The scientists involved in this research ran simulations and showed that increased urban forestry and growing plants on roofs could lower New York City's average temperature by almost 2 degrees Fahrenheit throughout the day, with some areas seeing even greater reductions. And which areas saw the greater reductions? The ones that are the hottest and with the least green space at this time; the ones that are most likely to be stressed by climate change.

Satellite map of how “green” different areas of New York City are. Greener colors mean more trees and other plants, whereas whiter areas lack vegetation throughout whereas whiter areas lack consistent vegetation throughout and consist mostly of buildings and impervious surfaces like roads and parking lots.
Cool Roofs
Another promising solution is painting the roofs of buildings white. Remember when we learned about albedo earlier in the semester? Brighter (i.e., whiter) colors have a higher albedo and are, therefore, more effective at reflecting sunlight than absorbing it. As a result, white roofs are called "cool roofs." It sounds simple, but it really helps by reflecting the sun's heat instead of absorbing it, keeping houses cooler during those scorching summer days. Proponents of this argue that it provides a low-cost solution that helps buildings reduce energy costs and cool the atmosphere, particularly in highly urbanized areas. While there are some disadvantages, such as unwanted glare (not unlike walking outside on a sunny day after a fresh snowfall) and potentially higher heating costs in winter, the benefits during summer months are likely worth it in many areas. In addition to reducing urban heat island effects and decreasing risk in inner cities, roofs can improve air quality, reduce strain on the electrical grid, enhance comfort, and decrease emissions from power plants.

Painting roofs white or using lighter colored building materials can increase the albedo of urban areas during sunny days, reducing the amount of solar radiation absorbed and, therefore, reducing surface air temperature.
If the figure doesn't do it for you, here's a neat (and short!) video on "cool roofs" from the U.S. Department of Energy.
Video: Energy 101: Cool Roofs (2:16)
Narrator: Maybe you’ve never given much thought about what color your roof is or what it’s made of, but your roof could be costing you more money than you know to cool your home or office building, especially if you live in a warmer climate. Think about it this way: In the summertime, we wear light-colored clothes because they keep us cooler. Lighter clothes reflect rather than absorb the heat of the sun. It’s the same with your roof. A cool roof is often light in color, and made of materials that have what’s called high solar reflectance. That means it’s able to reflect a lot of the sun’s light that a conventional roof would absorb, heating up the building.
Narrator: You see, when the weather is warm, a conventional roof is the hottest place in the building. It can be well over 50 degrees hotter than the temperature outside. So if you don’t have air conditioning, a lot of that discomfort you feel may be coming from the roof. If a building with a standard darker roof is air-conditioned, the cost for comfort is much higher in order to counteract all that heat pouring in from above. Insulation slows the transfer of heat inside but doesn’t eliminate it. Researchers have measured energy savings up to 10 to 15 percent for homes with cool roof coatings. And if a standard dark roof reaches 150 degrees or more, a cool roof can actually reduce the roof temperature a lot. A cool roof may only be five or 10 degrees warmer than the temperature outside on a hot, sunny day. All right. So here’s a big plus for the environment. A cool roof helps mitigate a phenomenon known as the “urban heat island.” The temperature in developed urban areas tends to be two to five degrees warmer than surrounding areas. That’s because ground covered by pavement and dark buildings absorbs more heat. So the heat stays in the atmosphere longer. A variation of the cool roof is the green roof, sometimes called a living roof. That’s because flowers and plants and even a vegetable garden grow in a special soil system right on top of the building. Cool roofs aren’t super high-tech, and that’s part of their appeal. They’re a relatively simple and effective way to improve our environment and lower energy costs.
Lastly, it is crucial to enhance community support systems, particularly for the elderly and those more vulnerable during extreme heat or other adverse conditions. This can be achieved by organizing neighborhood watch programs, establishing cooling centers, and creating networks of volunteers to check on and assist at-risk individuals. Strengthening these community connections ensures that everyone receives the necessary care and support during challenging times. These steps won't fix everything overnight, but they’re a solid start toward making things fairer and cooler, literally!
Quiz Yourself...
Detection and Attribution in Climate Justice
Detection and Attribution in Climate JusticePrioritize...
After completing this section, you should be able to:
- Define "detection" and "attribution" and explain how they are used in climate science.
- Explain what a "counterfactual" experiment means with respect to climate attribution.
Read...
When we're talking about climate justice, it's not just about recognizing the impacts of climate change; it's about understanding the science that helps us pinpoint these impacts and their causes. This is where detection and attribution come into play. Sort of like CSI: Climate Science.
Detection is noticing that something fishy is going on with the climate. It's about identifying changes in the climate system that stand out and can't be chalked up to natural variations. For example, if you see that global temperatures are rising, detection helps us figure out if this change is unusual and significant.
Attribution, on the other hand, is about figuring out what and who is to blame for these changes. It’s like finding the culprit in a mystery novel. Attribution links observed changes to specific causes, like greenhouse gas emissions from human activities. Scientists do this by comparing real-world data with climate models. They look at different scenarios, such as natural factors like volcanic eruptions and human factors like emissions from cars and factories. If the models show that the observed warming only happens when human activities are included, it’s a strong indication that we're the ones driving these changes.
So why are the ideas of detection and attribution important for climate justice? Well, remember earlier when we said we shouldn’t think about climate change as “causing” a particular extreme event (for example, a hurricane), but rather, whether climate change increased the probability of that event occurring or enhanced its impacts. Detection involves asking the question, “Is there something that climate change did here?” and attribution is asking the question, “What percentage of this event’s impact was caused by climate change?” Answering these two questions can prove important for understanding how societal choices regarding emissions, land use changes, etc., are potentially causing harm to parties less responsible for such decisions.
So, how do scientists do this? There is no one answer. They use a variety of methods and tools. These approaches often involve sophisticated climate models, historical climate data, and statistical techniques to isolate the influence of human activities from natural variability. For detection, researchers analyze long-term climate records to identify trends and anomalies that deviate from expected natural patterns. This process requires meticulous examination of temperature records, precipitation patterns, and extreme weather events, ensuring that identified changes are robust and significant.
See an example of detection below.
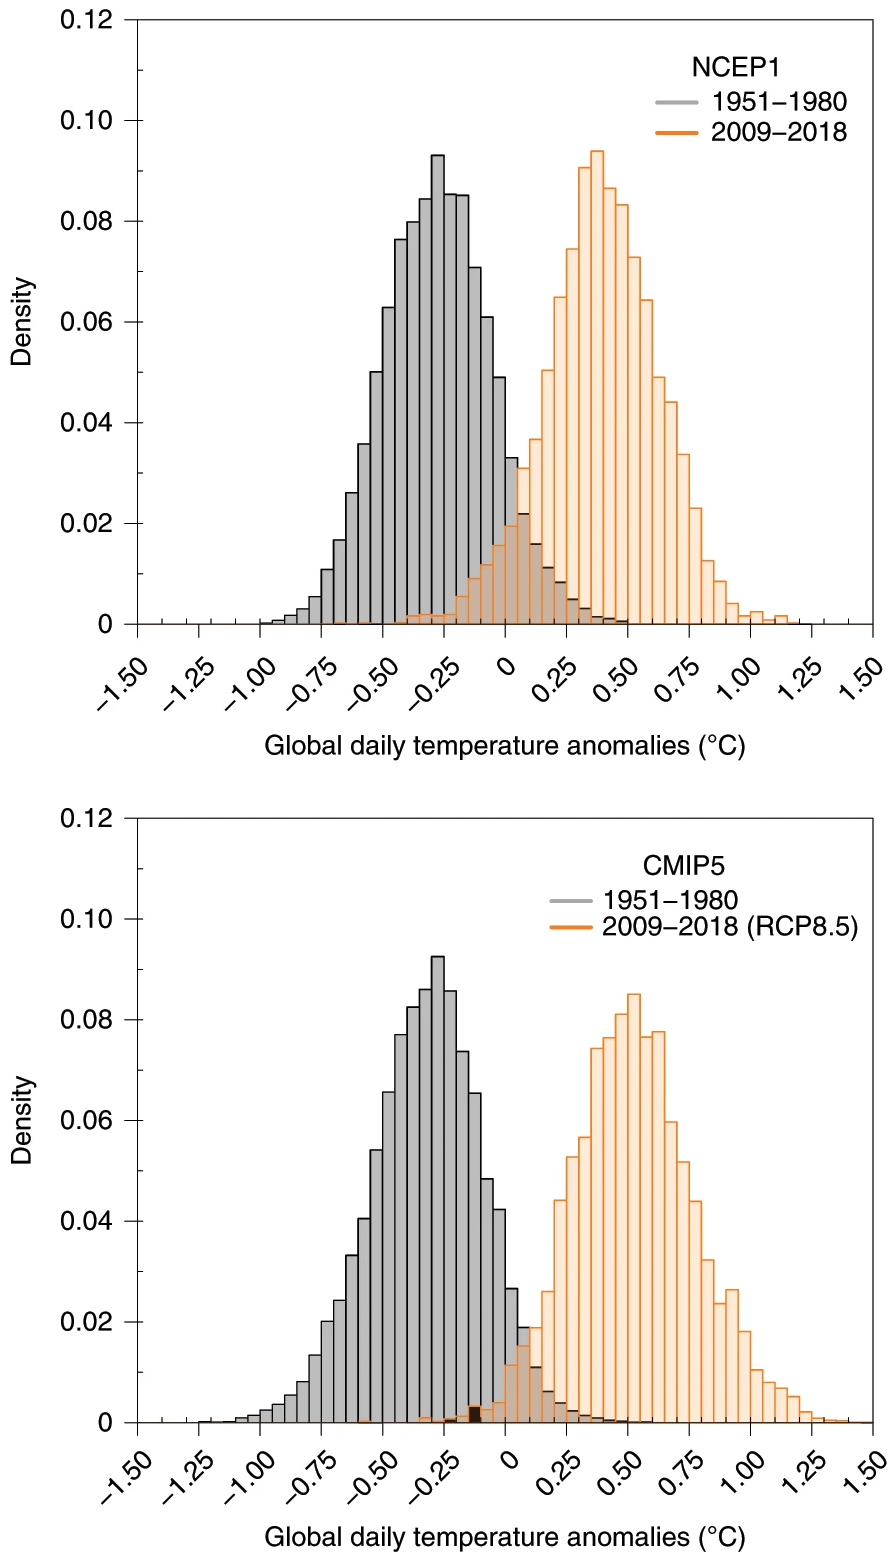
The graphs compare global daily temperature anomalies using data from (top) the NCEP dataset and (bottom) CMIP5 models.
These graphs show how daily temperatures have changed globally over time. The black bars represent temperatures from 1951–1980, while the orange bars show temperatures from 2009–2018. The top panel uses data from the National Center for Environmental Prediction (NCEP), whereas the bottom panel comes from verification of climate model simulations. Notice how the orange bars have shifted to the right compared to the black bars. We’ve seen similar graphs before in this course—these results clearly "detect" climate change, confirming that the most recent period is warmer than the past! Another cool takeaway here is that our models capture the same warming signal seen in observations—a reassuring sign that they’re trustworthy tools for understanding climate trends.
For attribution, scientists use climate models to simulate Earth’s climate under different scenarios. They run these models with and without human influences—like greenhouse gas emissions and land-use changes—to see how the climate would behave in each case. By comparing the results to observed data, researchers can figure out how much human activity has contributed to specific climate events or trends.
Let’s break this down with an example. Hurricane Florence, a major storm from the 2018 Atlantic season, caused prolonged heavy rain and catastrophic flooding in the Carolinas, leading to 54 deaths and $24.23 billion in damages. How much of this flooding was due to climate change? To answer this, scientists used atmospheric models to simulate two versions of Hurricane Florence. One version closely matched the real storm as it happened. The other, called a "counterfactual," used the same meteorological setup but removed the human-induced fingerprint of climate change from the conditions leading up to the storm. To account for variability, they ran hundreds of slightly different simulations (an ensemble) for each version. By comparing the “actual” and “counterfactual” results, they could determine how much of the storm’s impact was influenced by human-driven climate change.
Emphasize!
A counterfactual experiment in climate attribution is a method used to isolate the impact of human activities, like greenhouse gas emissions, on specific weather events or climate trends. It involves running climate model simulations under two scenarios:
- The actual scenario (in red), which includes both natural factors (like volcanic eruptions and solar variations) and human influences (such as emissions and land-use changes).
- The counterfactual scenario (in blue), which removes human influences and only includes natural factors.
By comparing the outcomes of these simulations, scientists can determine how much of an event’s severity, likelihood, or impact can be attributed to human-induced climate change. For example, in studying a heatwave, a counterfactual experiment might reveal that the event was made significantly more intense or frequent due to human activities.
The figure below shows histograms (with solid lines) of the maximum rainfall (i.e., the highest precipitation peak at any weather station over the Carolinas) and the total accumulated precipitation over the region impacted by Florence. The red (“actual”) and the blue (“counterfactual”) histograms come from the ensemble of model simulations, and the vertical black stripe is the single value that was observed by satellite data. To make it easier to see the differences, the researchers fit smooth curves (illustrated by dashed lines) to the results. For both quantities, the blue curve is to the left of the red curve, which means the blue curve is composed of less rainfall. In other words, climate scientists found that when they removed the “fingerprint” of human induced climate change from Hurricane Florence precipitation decreased. Put another way, approximately 5% of Hurricane Florence’s precipitation was due to climate change. This may not seem like a big number, but in many cities around the United States, this can be the difference between levees being breached or not or buildings being flooded and lives being lost.

Additionally, advancements in climate science have improved the precision of these studies, allowing for more accurate (and rapid) attribution of extreme weather events. For instance, after a heatwave, scientists can assess the probability of such an event occurring in a pre-industrial climate versus today’s climate in near real-time. These rapid attribution studies provide timely insights into the role of human activities in intensifying extreme weather, which is essential for public awareness and helps make sure that media outlets are communicating the best possible science to individuals interested in understanding such impacts.
Explore Further...
Curious about how scientists determine whether climate change influenced a recent heatwave, flood, or drought? Visit World Weather Attribution (WWA) to explore real-time analyses of extreme weather events. WWA uses climate models and weather observations to assess how human-driven climate change affects the intensity and likelihood of these events. From heatwaves in Europe to flooding in Africa, their studies provide insights into the role of climate change and highlight the actions needed to prepare for a world of increasing extremes.

Quiz Yourself...
Climate Litigation
Climate LitigationPrioritize...
After completing this section, you should be able to:
- Define climate litigation, explain it's intended purpose, and give an example of what climate litigation looks like.
Read...
Remember how we opened this lesson. Understanding and addressing climate change is about more than science—it’s about justice. At its core, climate justice means recognizing responsibility for climate damages and taking action to rectify these injustices. So, who’s responsible? And how can we ensure that those affected by climate change get the support they need? Let’s dive into the different perspectives on responsibility, the mechanisms for compensation, and the path forward.
We talked earlier in this lecture about how the planet is somewhat split between the “haves” and the “have-nots”—that is, from a geographic or country perspective. However, the responsibility doesn’t just rest with nations. Corporations—especially fossil fuel giants like ExxonMobil, Shell, and BP—played a massive role. These companies not only extracted and sold fossil fuels for profit, but they also knew about the risks of climate change as early as the 1970s. Internal documents reveal they understood how their activities would heat the planet, but they chose to mislead the public and delay action to protect their bottom lines.
Mechanisms for Accountability: Climate Litigation
One of the most powerful tools for holding historical emitters accountable is climate litigation. Climate litigation refers to the use of legal systems and processes to address issues related to climate change, often focusing on holding governments, corporations, and other entities accountable for their contributions to greenhouse gas emissions and climate impacts. It encompasses a broad range of legal actions, from lawsuits seeking compensation for damages caused by climate-related disasters to cases demanding stronger climate policies or the enforcement of existing environmental regulations. Plaintiffs in climate litigation might include affected individuals, communities, advocacy groups, or even governments, while defendants often include major polluters like fossil fuel companies or policymakers accused of inaction. By leveraging the law, climate litigation aims to achieve justice for those disproportionately affected by climate change, enforce accountability, and catalyze systemic changes in how societies address the climate crisis.

Over the past decade, we’ve seen a surge in lawsuits targeting governments, corporations, and even financial institutions for their roles in contributing to or enabling climate change. Check out the explosion in the graph above! These legal actions aim to achieve several key goals:
- Establishing Responsibility: Proving that specific entities bear significant responsibility for climate impacts.
- Securing Compensation: Providing financial resources to communities hit hardest by climate disasters.
- Driving Policy Change: Pressuring governments and corporations to adopt more sustainable practices.
The infographic below is useful to digest. I'll let you sit with it for a little while since I can't cover everything on it. There are several takeaways from it:
- The number of cases has gone up over time (as we saw above)
- The U.S. is the "leader" in filed cases, with Europe coming in second and Australia leading the pack of non-US, non-EU countries.
- The number of jurisdictions is increasing, indicating that not only is the number of cases going up but the number of locations pursuing climate litigation is as well.

Case Study
Massachusetts v. EPA (2007): A Milestone in Climate Litigation
In Massachusetts v. Environmental Protection Agency, the U.S. Supreme Court issued a landmark ruling that established the federal government’s responsibility to address greenhouse gas emissions. The case came about when Massachusetts, joined by other states and cities, sued the EPA for failing to regulate carbon dioxide emissions from vehicles under the Clean Air Act (CAA). Massachusetts argued that the EPA was legally obligated to regulate "any air pollutant" that endangers public health or welfare. The EPA countered by claiming it lacked authority to regulate greenhouse gases and cited scientific uncertainty as a reason for inaction. So, who is right?
At the time -- in a 5–4 decision -- the Court ruled in favor of Massachusetts, holding that the EPA had both the authority and the obligation under the CAA to regulate greenhouse gases if they posed a risk to public health. The decision marked the first time the Supreme Court recognized greenhouse gases as pollutants, setting a crucial precedent for climate-related litigation.
The outcome reinforced the idea that laws like the Clean Air Act could be used to address environmental challenges. The ruling also highlighted the importance of "standing" in climate lawsuits, with the Court acknowledging Massachusetts' claim that rising sea levels directly threatened its coastal land. “Standing” is a key part of climate litigation!
However, things are far from settled. A later Supreme Court case in 2022, West Virginia v. EPA, actually found that the EPA had overstepped its authority under the "major questions doctrine" by attempting to regulate emissions and promote alternate energy sources in the Clean Power Plan. The Inflation Reduction Act of 2022 codified the findings in Massachusetts v. EPA, reaffirming that carbon dioxide and other greenhouse gases fall under the EPA’s authority to regulate as pollutants under the Clean Air Act.
Quiz Yourself...
Climate Reparations
Climate ReparationsPrioritize...
After completing this section, you should be able to:
- Define climate reparations, explain their intended purpose, and describe the concept behind a "climate fund."
Read...
Mechanisms for Justice: Climate Reparations
Climate reparations are a framework for addressing the injustices of climate change by compensating those who have been disproportionately harmed by its impacts. Reparations are a way to make up for harm caused in the past by giving money, resources, or help to those who were unfairly hurt. In climate change, it means helping people or countries that didn’t cause much of the problem but are suffering the most from its effects.
The concept centers on the principle that those most responsible for greenhouse gas emissions—historically wealthier nations and major polluters—should provide financial and material support to vulnerable communities and nations that have contributed the least to climate change but suffer the most from its effects. Reparations go beyond traditional aid or charity, emphasizing accountability and justice, acknowledging historical inequities, and fostering global solidarity.
A key mechanism for delivering climate reparations is the establishment of climate funds. These funds, often facilitated through international agreements like the United Nations Framework Convention on Climate Change (UNFCCC), are designed to channel financial resources from wealthier nations to those most affected by climate change. For example, the Loss and Damage Fund was recently created by countries working together at a global meeting to address climate change (at the 2022 United Nations Climate Change Conference or Conference of the Parties, if you aren’t into the whole brevity thing). This fund is designed to help communities and countries that are facing damage from climate change that cannot be reversed, like when rising seas destroy homes, floods wipe out farmland, or powerful storms force people to leave their communities. The idea is to provide money and resources to help these people recover and rebuild their lives.
The push for climate reparations has focused on achieving three main objectives:
- Acknowledging Historical Responsibility: Recognizing that industrialized nations and corporations have historically driven climate change through unchecked emissions and benefiting from fossil fuel consumption. For example, say a factory has been dumping toxic waste into a river for decades and making huge profits, while communities downstream suffer from polluted water. Holding the factory accountable is like acknowledging historical responsibility for the harm caused.
- Providing Fair Compensation: Leveraging climate funds to ensure vulnerable nations and communities receive resources to rebuild, recover, and adapt to climate-related impacts. If a hurricane with an attributable climate change signal destroyed a small island nation’s homes and infrastructure, fair compensation would mean wealthier nations, who contributed most to climate change, help pay for the island's recovery and adaptation to future storms.
- Promoting Global Equity: Bridging the gap between the Global North and Global South by redistributing resources through mechanisms like the Green Climate Fund and the Adaptation Fund to address systemic inequities exacerbated by climate change. Wealthier countries might contribute to these funds with an eye towards achieving goals like the Global South countries building more flood-resistant infrastructure and develop early-warning systems.

Case Study...
The Green Climate Fund: Addressing Global Climate Challenges
The Green Climate Fund (GCF) is the world’s largest fund dedicated to helping developing nations tackle climate change. Created under the United Nations Framework Convention on Climate Change (UNFCCC), it’s designed to support countries that often contribute the least to climate change but face its harshest impacts. With a portfolio of $13.5 billion (and over $51 billion when including co-financing) as of 2023, the GCF funds projects like building climate-resilient infrastructure, scaling up renewable energy, and preparing communities for disasters like floods and heatwaves. Governed by a 24-member board and based in South Korea, the GCF is a key player in global efforts to channel resources from wealthier countries to those that need them most. The above figure highlights the “buy-in” the fund has been getting from major nations. While the overall commitment pales in comparison to what is needed to address climate issues, the financial outlay indicates a real commitment!
But like any massive program, the GCF isn’t without its challenges. Critics argue that some funded projects don’t go far enough, sticking to “business-as-usual” solutions instead of fostering real innovation. There’s also ongoing debate about whether the money is being distributed fairly or efficiently, with some pointing out that it’s tough for smaller countries to access funds for adaptation projects. Cynics are concerned about the possibility of corruption and cronyism, meaning stringent oversight of the funds is a key request from contributors.
Despite these hurdles, the GCF remains a vital piece of the puzzle in addressing climate injustices, especially as wealthier nations work to fulfill their promises of supporting vulnerable communities around the globe.
Quiz Yourself...
Corporate Responsibility and Accountability
Corporate Responsibility and AccountabilityPrioritize...
After completing this section, you should be able to:
- Explain the role of fossil fuel giants in climate change and how legal avenues can be used to hold them accountable
- Define Environmental, Social, and Governance (ESG) business criteria and divestment, give an example of how they work, and offer at least one strength and weakness for each.
Read...
When it comes to responsibility for climate change, corporations—especially fossil fuel giants like ExxonMobil, BP, and Shell — play a massive role. These companies have been major contributors to greenhouse gas emissions, not just from extracting fuels but also from the emissions generated when those fuels are burned. The figure below highlights some of the biggest corporate sources of greenhouse gases, underscoring their significant impact on the planet's energy budget.

Even more troubling, internal documents dating back to the 1970s reveal that many of these corporations were fully aware of the devastating consequences of burning fossil fuels. They had access to research predicting rising global temperatures, melting ice caps, and more extreme weather events. Instead of acting responsibly, these companies made a calculated choice: they funneled money into misinformation campaigns aimed at casting doubt on climate science and delaying meaningful action. For example, check out the graph below. Each gray line predicts climate change from internal ExxonMobil models that were available to company leadership but not the general public. You could actually make an argument that their models of climate change in the 1970s and 1980s were as good, if not better, than some of the leading research models at the time!

Through funding think tanks, lobbying against regulations, and crafting misleading ads, these corporations actively sowed doubt, framing the science as "unsettled." This calculated approach didn’t just delay action—it amplified the climate crisis. The result? Vulnerable communities are now bearing the brunt of intensifying disasters, collapsing ecosystems, and rising seas, all while the clock keeps ticking.
Case Studies in Corporate Accountability
In recent years, efforts to hold these corporations accountable have gained momentum. Climate litigation has become a powerful tool for seeking justice. For example:
- New York City v. ExxonMobil (2021): New York City sued ExxonMobil, Chevron, and other fossil fuel giants, alleging they misled investors and the public about the risks of climate change. While the case faced legal challenges, it brought critical attention to corporate deception.
- Royal Dutch Shell in the Netherlands (2021): In a landmark ruling, a Dutch court ordered Shell to cut its carbon emissions by 45% by 2030, emphasizing its responsibility to align with the Paris Agreement. This case marked the first time a court held a corporation legally accountable for reducing its emissions.
- Climate Liability Cases in the Philippines (2022): The Philippine Commission on Human Rights found fossil fuel companies legally and morally responsible for climate harms, setting a global precedent for corporate accountability in human rights contexts.
How much all of these lawsuits will actually have teeth remains up for debate. For example, Shell appealed the ruling in the Netherlands, arguing that it was not the court's role to enforce emissions targets. But beyond legal means, other strategies have become a powerful tool for holding corporations accountable.
Environmental, Social, and Governance (ESG)
A newer development in corporate accountability is the integration of Environmental, Social, and Governance (ESG) criteria into business practices. ESG criteria measure how well companies address environmental sustainability, social responsibility, and ethical governance. Investors increasingly prioritize ESG-compliant companies, recognizing that long-term profitability is tied to sustainable practices. For instance, companies like Unilever and Microsoft have committed to achieving carbon neutrality in their operations, while the Task Force on Climate-Related Financial Disclosures (TCFD) has encouraged businesses to disclose climate risks and outline strategies for mitigation. Even major financial companies like BlackRock have pledged to align their portfolios with net-zero emissions by 2050, signaling a shift in the financial sector’s approach to sustainability.
Meanwhile, divestment campaigns have become another powerful tool for holding corporations accountable. Divestment is the process of withdrawing investments from companies or industries, often as a form of protest or ethical stand, to pressure them to change practices deemed harmful or unethical. In other words, rather than apply legal pressure like we talked about above, apply financial pressure instead! Universities, pension funds, and cities are divesting billions from fossil fuel investments, signaling societal disapproval of the industry’s environmental impact. For example, New York City and London have committed to moving their funds out of fossil fuel companies, and prestigious institutions like Harvard and Oxford have followed suit, citing both moral and financial risks. These efforts not only create financial pressure but also reshape public perceptions, positioning fossil fuel investments as increasingly unacceptable. The graph below demonstrates the rapid increase in divestment from fossil fuel companies -- the black line is the dollar amount, and the red bars are counts of "institutions," which are composed of all sorts of entities from colleges to non-profits to other companies to even religion organizations/churches!

Shareholder activism is amplifying these trends. Investors are demanding greater transparency and genuine commitments to sustainability, using their influence to push for internal change. In 2021, activist investors secured board seats at ExxonMobil to advocate for stronger climate action—a move that underscored the growing dissent even within major corporations.
Note that both ESG practices and divestment campaigns do face criticism. In particular, one can make an argument that ESG business criteria can be used as a "marketing tool" to make companies look good (and investors feel better) without any meaningful action -- a form of virtue signaling. Likewise, some argue that divestment has a limited financial impact, even though the graph above above indicates $40 trillion US dollars in divestments. It's a bit misleading because the divestment total reflects the total value of the institutions' assets, not the specific value of fossil fuel investments. For example, a university endowment committing to divest might be worth $5 billion, but only $50 million of that could be tied to fossil fuels.
However, ESG business criteria and divestment do represent significant shifts in how society and financial markets hold corporations accountable. Together, these strategies highlight an evolving expectation: that businesses must align with global climate goals and take responsibility for their role in the climate crisis.
Quiz Yourself...
Summary
SummaryRead...
- Environmental and climate justice focus on equity, human rights, and meaningful participation to ensure no group bears disproportionate environmental burdens or is excluded from solutions, emphasizing fairness and inclusivity in addressing environmental harm and climate change impacts.
- Inequity can include both emissions and impacts
- Wealthier nations in the Global North have historically contributed disproportionately to climate change, while many countries in the Global South have remained within their fair share of emissions, highlighting the need for equitable responsibility in addressing climate damage.
- Climate change disproportionately impacts nations in the Global South, which have contributed the least to emissions but face the steepest adaptation costs due to vulnerabilities like geography, limited resources, and economic constraints, amplifying global inequalities.
- Climate migration arises when people are displaced by climate change-driven disasters like rising seas, extreme weather, and drought, highlighting the need for international legal protections, proactive adaptation measures, and equitable economic support to address this growing humanitarian challenge.
- Redlining has led to systemic disinvestment in minority neighborhoods, resulting in poor infrastructure and limited green spaces, which amplify the urban heat island effect and leave these communities disproportionately vulnerable to climate change impacts like extreme heat and pollution.
- Increasing urban green spaces and implementing cool roofs can significantly reduce the urban heat island effect, particularly in historically neglected neighborhoods, while strengthening community support systems helps protect vulnerable populations during extreme heat events.
- Detection identifies significant climate changes beyond natural variability, while attribution determines the role of human activities, often using counterfactual experiments to isolate climate change’s contribution to extreme events, providing essential insights for understanding and addressing climate justice.
- Climate litigation uses legal systems to hold governments, corporations, and other entities accountable for their contributions to climate change, aiming to establish responsibility, secure compensation for affected communities, and drive systemic policy changes.
- Climate reparations aim to address historical inequities by holding wealthier nations and major polluters accountable for their disproportionate contributions to climate change, providing financial and material support through mechanisms like climate funds to help vulnerable nations recover, rebuild, and adapt.
- Corporate accountability for climate change focuses on holding major emitters like fossil fuel companies responsible through legal actions, Environmental, Social, and Governance (ESG) practices, and divestment campaigns, aiming to drive systemic change despite challenges like greenwashing and limited financial impacts.