Testing Climate Models: Validation
Testing Climate Models: ValidationPrioritize...
After completing this page, you should be able to:
- Define validation, verification, and hindcasting.
- Give at least two examples of how scientists might validate a climate model.
Read...
We finished off the last section by noting that climate models aren’t perfect, but they can be useful to scientists. Let's predict the future! But wait, I mentioned we first need to ask, how do scientists determine if they can trust models? Surprisingly, making future predictions is only a small part of a climate modeler’s job. A significant portion of their work focuses on testing the accuracy and reliability of the models themselves.
Testing climate models is essential for understanding and predicting the Earth’s climate system. Reliable models build confidence in their use for policy decisions, disaster preparedness, and long-term planning for climate change. Without rigorous testing, models could produce inaccurate predictions, leading to ineffective strategies for mitigating and adapting to climate impacts. In short, before scientists look ahead, they spend a lot of time looking back to ensure the models are up to the task.
So how do scientists do this? Validation involves comparing model outputs with independent observational data to determine how well the model represents reality. This process checks if the model can accurately simulate historical climate conditions and whether it can reproduce observed phenomena. Verification, on the other hand, focuses on ensuring that the model correctly implements the scientific theories and algorithms it is based on. This process involves code checking, debugging, and ensuring that the numerical methods used in the model are correctly executed.
Let’s talk about validation first. What is the best way to check if a climate model does a good job of simulating the Earth’s climate? Well, imagine you’re testing a new oven for making a birthday cake. You’ve made the cake before, and you know exactly how it’s supposed to taste, what kind of texture it has, how it should look... To test the new oven, you make the cake again and compare it to your previous cake. Does it look the same? Taste the same? If it does, then you can be confident that your new oven works. If, after one bite, everyone at the table spits it out, saying, "No more, I'm good," well, you have a problem with your new oven!
Climate modelers use a similar approach called hindcasting. Hindcasting is a technique where climate models are run backward in time to simulate past climate conditions. Technically, they aren't really run backwards, but climate models are *started* (the fancy word is "initialized") back in a previous year, say 1900, and they are then run to the present day. It's almost as if we took a time machine back to 1900 and tried to predict what was going to happen between then and now. Except we know what happened between then and now!
By comparing the model outputs with historical climate data, scientists can assess the model's accuracy. Hindcasting provides a robust test because the conditions are known, and the model's ability to replicate these conditions can be directly evaluated. This involves examining temperature records, precipitation patterns, and other climate variables over a significant period. If a model can accurately reproduce past climate variations, it increases confidence in its predictions for future climate scenarios. If my cake tasted good when cooked with the new oven yesterday, it's likely it'll taste good, even with some tweaks, when cooked with the new oven tomorrow.
Check out the graphic below. It compares the global average temperature over the past 50 or so years as predicted by a climate model built by NASA with what was observed. To “back test” the climate model, the model was run over the historical period from 1979 through 2023 and then the model predicted global mean temperature (black line) was compared with observations collected by surface stations and satellites (red line). The fact that the black and red lines are very close to one another provides confidence that the model is doing a reasonable job simulating the climate system, thereby providing confidence in using the model to predict future climate.

Observational datasets are a crucial part of validating climate models. And it’s not just surface temperatures that climate modelers focus on. Other observational datasets include information from satellites, weather stations, and ocean buoys. By comparing model outputs to these observations, scientists can assess how well a model captures various elements of the climate system, like temperature, humidity, and sea surface conditions. These comparisons go a bit above-and-beyond just tracking the global surface temperature For the cake analogy, in addition to tasting good, does your cake look nice? Does it have the right texture? The right amount of frosting?
Take water vapor, clouds, and precipitation, for example—quantities for which climate models are still improving. The graphic below illustrates how satellite data are used to verify the Department of Energy’s climate model. It shows satellite observations of atmospheric water vapor (gray/faint white shading) and precipitation (colors and bright white) alongside a “synthetic version” created by the model. By comparing the two, scientists can identify strengths and weaknesses in the model. For instance, in this graphic, the satellite observations are on top, and the model results are on the bottom. While the overall patterns of water vapor and precipitation are similar, the model appears “noisier” in the light gray contours. This tells scientists that tweaking certain equations or pieces of code might produce smoother results that align more closely with the satellite data. This could improve the model’s accuracy.
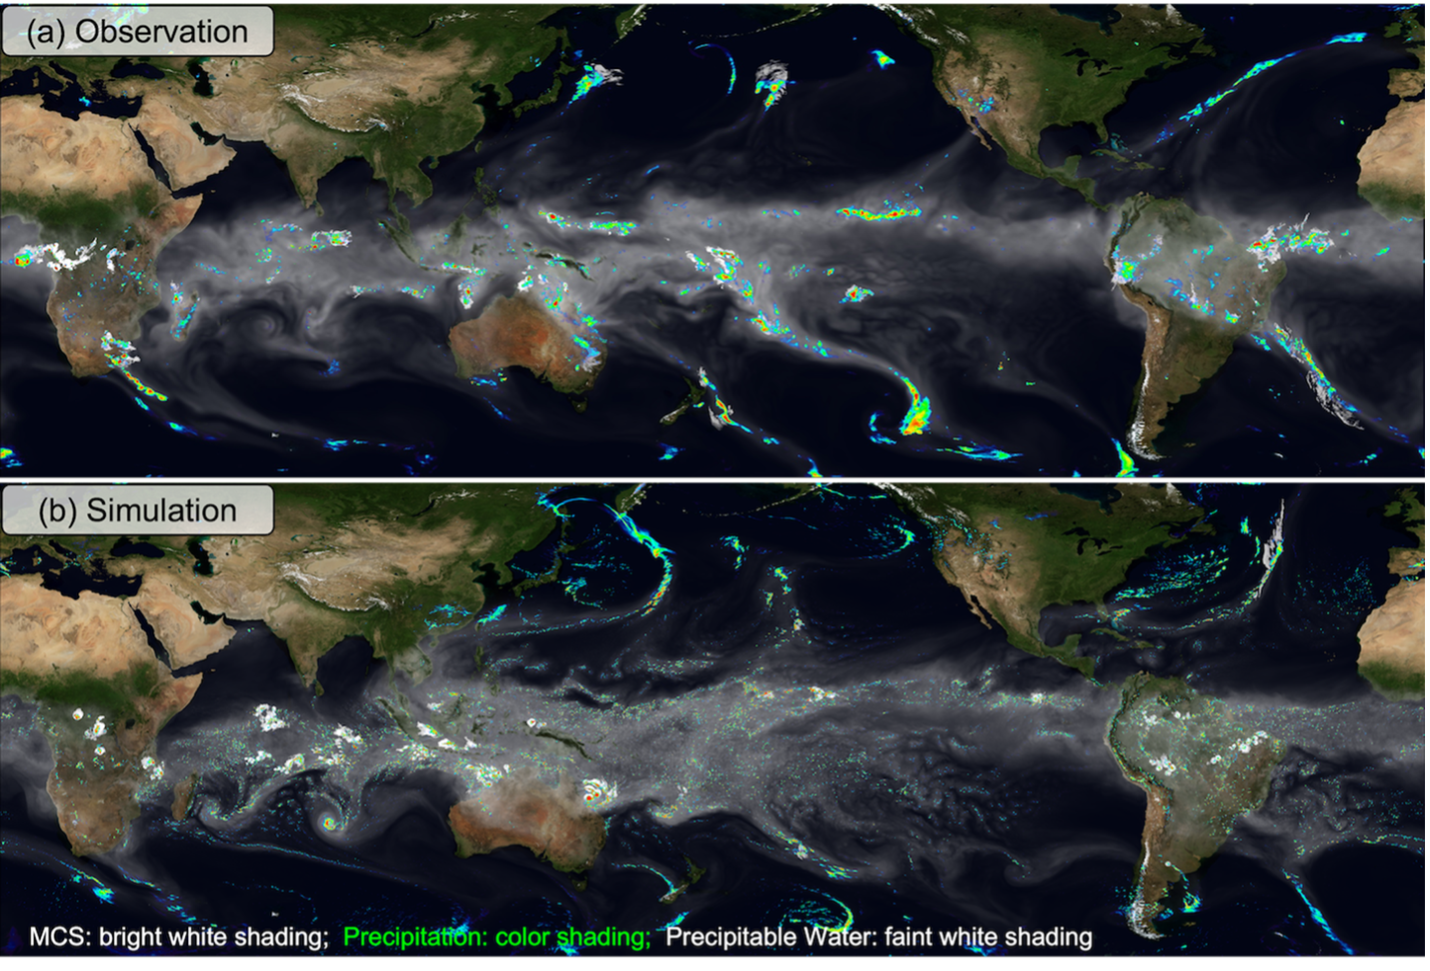
(top) Observed and (bottom) simulated amounts of atmospheric water vapor (faint white to gray shading), mesoscale convective system (MCS) clouds (bright white shading), and precipitation (color shading).