The Carbon Cycle
The Carbon CyclePrioritize...
After you've finished this section, you should be able to:
- Define the carbon cycle.
- Explain the difference between the two "speeds" of the carbon cycle, and give examples of processes in both.
Read…
Carbon (you might recognize it as "C" from the periodic table!) is one of the most important elements in the universe. Perhaps most critical for us, it plays a central role in life on Earth. It’s in everything from our bodies and the food we eat to the infrastructure we build and the way our economies function. While carbon is essential for life, it’s also at the heart of one of the biggest challenges we face today - climate change.
Originally formed deep in the cores of ancient stars, carbon is actually the fourth most common element in the universe, right after hydrogen, helium, and oxygen. On Earth, though, the vast majority of carbon—around 90 million petagrams (I won't write it out, but that’s 90 followed by 15 zeros!)—is locked away in the lithosphere. If you remember from earlier in the course, the lithosphere is the rigid outer layer of the Earth that includes the crust and part of the upper mantle. This carbon exists mostly in solid minerals and carbonate rocks like limestone and dolomite right under our feet.
But not all of Earth’s carbon is socked away in rocks. Smaller, but still significant, amounts of carbon are found in other parts of the Earth system. The ocean holds around 40,000 petagrams (abbreviated Pg), while soil and plants contain about 2,300 Pg, and the atmosphere has roughly 750 Pg. As you can see, these numbers are all much smaller compared to the carbon stored in the lithosphere. However, they are key players in the carbon cycle—especially when it comes to how carbon moves between the lithosphere, oceans, living organisms atmosphere. This movement is what ties carbon directly to climate change.

What is the carbon cycle, you may ask? Well, the word cycle gives a hint: it’s a continuous process. Carbon doesn’t just stay in one place—it moves through different parts of the Earth’s system. This movement is what scientists mean when they use the term carbon cycle. How carbon circulates between the land, oceans, living organisms, and atmosphere shapes the carbon cycle, and any disruption in this movement can lead to a buildup of carbon in one of the areas.
There are two “speeds” to the carbon cycle: slow and fast. So, I guess the carbon cycle has something in common with The Tortoise and the Hare.
The “slow” (or “deep”) carbon cycle—just like its name suggests—operates over long periods of time. Think millions of years. In the slow carbon cycle, carbon is stored in rocks, soils, and the oceans, and gradually released through processes like volcanic activity, rock weathering, and sediment formation. This cycle plays a crucial role in transferring carbon from the atmosphere back into the land, helping to prevent dangerous carbon buildups in the atmosphere. It is a bit like Earth’s long-term climate thermostat, keeping the planet habitable over the ages. But because it works on such a slow timescale, its impacts on climate over a few human lifetimes are minimal; it cannot counteract large buildups of atmospheric column that are now ongoing as a result of human activities since the beginning of the industrial revolution.
What we’re more concerned with is the “fast” carbon cycle, also known as the biological carbon cycle. This is the part of the cycle that we experience on human timescales—years, decades, or centuries. It involves the rapid movement of carbon between the biosphere, atmosphere, and ocean. Each year, somewhere between 1 and 100 petagrams of carbon are shuffled naturally through processes like:
- plant growth, where plants take in carbon dioxide during photosynthesis
- wildfires, which release stored carbon from trees and vegetation into the atmosphere
- carbon dissolving in ocean waters, as the oceans absorb carbon dioxide from the air
- respiration, when plants and animals (including humans) exhale carbon dioxide into the atmosphere
- decay of organic matter, where dead plants and animals break down, releasing carbon
Now, that doesn't sound like a lot relative to the numbers we talked about earlier. But 100 petagrams isn't nothing! To put that into perspective, that’s the equivalent of 56,000 bowling balls’ worth of carbon being transformed every, single second! Next time you're at the bowling alley, picture that!
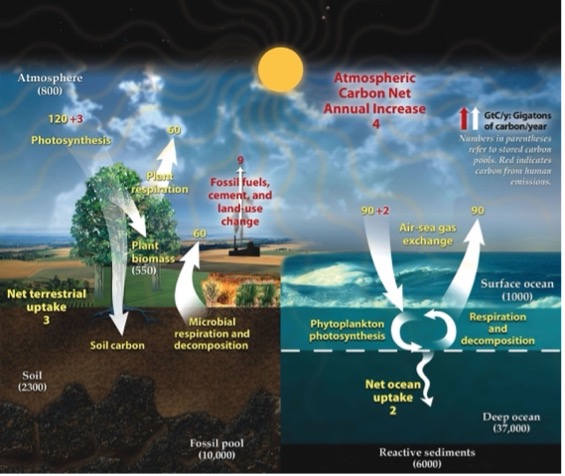
The image is a detailed illustration of the global carbon cycle. It is divided into two primary sections: the terrestrial environment on the left and the ocean environment on the right. The terrestrial side features a tree, representing plant life, and shows processes like photosynthesis, plant respiration, microbial respiration, and decomposition. Numbers next to arrows indicate carbon exchange rates, with a net terrestrial uptake of 3 gigatons of carbon per year. The soil and fossil pool are depicted beneath the surface, with the soil carbon measured at 2300 gigatons and the fossil pool at 10,000 gigatons.
On the right, the ocean environment shows processes such as air-sea gas exchange, marked by arrows indicating movement of carbon between the atmosphere and ocean with a net ocean uptake of 2 gigatons per year. Phytoplankton photosynthesis and oceanic respiration/decomposition are noted. Reactives sediments, surface and deep ocean layers are labeled with carbon measurements.
A sun shines over both sections, symbolizing energy driving these cycles. At the top, an arrow indicates an atmospheric carbon net annual increase of 4 gigatons. This is attributed to fossil fuels, cement, and land-use change.
Quiz Yourself...