Lesson 8: Anthropogenic Climate Change
Lesson 8: Anthropogenic Climate ChangeMotivate...

So, as we've learned, on large time and space scales, climate is not static; a variety of natural factors cause it to change. Solar variability, volcanic activity, and even how the Earth "wobbles" in its orbit around the sun have all played key roles in shaping the planet's climate over the past 4+ billion years.
There's no doubt that Earth's climate can change dramatically (though usually very slowly) due to these natural factors. But what about the rapid changes we're witnessing today? Are they purely natural? Decades of research overwhelmingly show that human activities—like burning fossil fuels and deforestation—are now driving climate change at an unprecedented rate. This acceleration has sparked widespread debate about how society should respond, with a flood of opinions in the media. With so much "noise" surrounding climate change, it can be challenging to separate fact from fiction.
That's why understanding the science behind climate change is essential, especially when we examine the carbon cycle, which is central to this issue. Parts of this cycle have worked together for millennia to maintain Earth's delicate climate balance. However, human activities since the Industrial Revolution have dramatically increased the release of carbon, particularly through fossil fuel combustion, disrupting that equilibrium.
In this lesson, we'll learn about the carbon cycle -- both its "slow" and "fast" components -- and how human actions are tipping the scales. We'll explore physically why the buildup of greenhouse gases in the atmosphere is such a concern and introduce you to key climate concepts like "forcings" and "feedbacks." By understanding the science of climate change, you'll be better equipped to interpret historical trends and consider future climate projections -- both in this class and in the real world.
The Carbon Cycle
The Carbon CyclePrioritize...
After you've finished this section, you should be able to:
- Define the carbon cycle.
- Explain the difference between the two "speeds" of the carbon cycle, and give examples of processes in both.
Read…
Carbon (you might recognize it as "C" from the periodic table!) is one of the most important elements in the universe. Perhaps most critical for us, it plays a central role in life on Earth. It’s in everything from our bodies and the food we eat to the infrastructure we build and the way our economies function. While carbon is essential for life, it’s also at the heart of one of the biggest challenges we face today - climate change.
Originally formed deep in the cores of ancient stars, carbon is actually the fourth most common element in the universe, right after hydrogen, helium, and oxygen. On Earth, though, the vast majority of carbon—around 90 million petagrams (I won't write it out, but that’s 90 followed by 15 zeros!)—is locked away in the lithosphere. If you remember from earlier in the course, the lithosphere is the rigid outer layer of the Earth that includes the crust and part of the upper mantle. This carbon exists mostly in solid minerals and carbonate rocks like limestone and dolomite right under our feet.
But not all of Earth’s carbon is socked away in rocks. Smaller, but still significant, amounts of carbon are found in other parts of the Earth system. The ocean holds around 40,000 petagrams (abbreviated Pg), while soil and plants contain about 2,300 Pg, and the atmosphere has roughly 750 Pg. As you can see, these numbers are all much smaller compared to the carbon stored in the lithosphere. However, they are key players in the carbon cycle—especially when it comes to how carbon moves between the lithosphere, oceans, living organisms atmosphere. This movement is what ties carbon directly to climate change.

What is the carbon cycle, you may ask? Well, the word cycle gives a hint: it’s a continuous process. Carbon doesn’t just stay in one place—it moves through different parts of the Earth’s system. This movement is what scientists mean when they use the term carbon cycle. How carbon circulates between the land, oceans, living organisms, and atmosphere shapes the carbon cycle, and any disruption in this movement can lead to a buildup of carbon in one of the areas.
There are two “speeds” to the carbon cycle: slow and fast. So, I guess the carbon cycle has something in common with The Tortoise and the Hare.
The “slow” (or “deep”) carbon cycle—just like its name suggests—operates over long periods of time. Think millions of years. In the slow carbon cycle, carbon is stored in rocks, soils, and the oceans, and gradually released through processes like volcanic activity, rock weathering, and sediment formation. This cycle plays a crucial role in transferring carbon from the atmosphere back into the land, helping to prevent dangerous carbon buildups in the atmosphere. It is a bit like Earth’s long-term climate thermostat, keeping the planet habitable over the ages. But because it works on such a slow timescale, its impacts on climate over a few human lifetimes are minimal; it cannot counteract large buildups of atmospheric column that are now ongoing as a result of human activities since the beginning of the industrial revolution.
What we’re more concerned with is the “fast” carbon cycle, also known as the biological carbon cycle. This is the part of the cycle that we experience on human timescales—years, decades, or centuries. It involves the rapid movement of carbon between the biosphere, atmosphere, and ocean. Each year, somewhere between 1 and 100 petagrams of carbon are shuffled naturally through processes like:
- plant growth, where plants take in carbon dioxide during photosynthesis
- wildfires, which release stored carbon from trees and vegetation into the atmosphere
- carbon dissolving in ocean waters, as the oceans absorb carbon dioxide from the air
- respiration, when plants and animals (including humans) exhale carbon dioxide into the atmosphere
- decay of organic matter, where dead plants and animals break down, releasing carbon
Now, that doesn't sound like a lot relative to the numbers we talked about earlier. But 100 petagrams isn't nothing! To put that into perspective, that’s the equivalent of 56,000 bowling balls’ worth of carbon being transformed every, single second! Next time you're at the bowling alley, picture that!
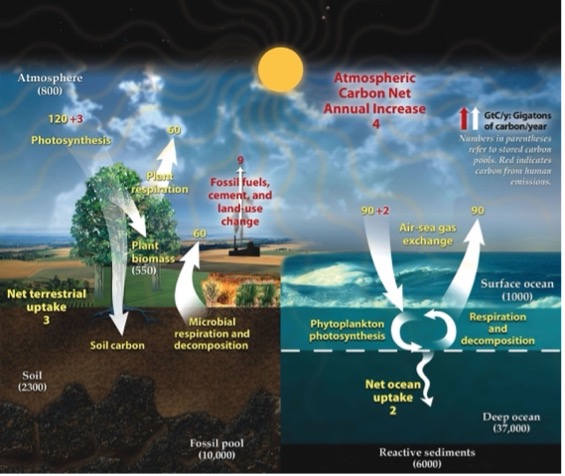
The image is a detailed illustration of the global carbon cycle. It is divided into two primary sections: the terrestrial environment on the left and the ocean environment on the right. The terrestrial side features a tree, representing plant life, and shows processes like photosynthesis, plant respiration, microbial respiration, and decomposition. Numbers next to arrows indicate carbon exchange rates, with a net terrestrial uptake of 3 gigatons of carbon per year. The soil and fossil pool are depicted beneath the surface, with the soil carbon measured at 2300 gigatons and the fossil pool at 10,000 gigatons.
On the right, the ocean environment shows processes such as air-sea gas exchange, marked by arrows indicating movement of carbon between the atmosphere and ocean with a net ocean uptake of 2 gigatons per year. Phytoplankton photosynthesis and oceanic respiration/decomposition are noted. Reactives sediments, surface and deep ocean layers are labeled with carbon measurements.
A sun shines over both sections, symbolizing energy driving these cycles. At the top, an arrow indicates an atmospheric carbon net annual increase of 4 gigatons. This is attributed to fossil fuels, cement, and land-use change.
Quiz Yourself...
Carbon Cycle: Combustion
Carbon Cycle: CombustionPrioritize...
After you've finished this section, you should be able to:
- Define fossil fuels and give three examples of them, including how they were formed.
- Define combustion and qualitatively describe why burning these fuels leads to CO₂.
- Use your knowledge of the carbon cycle and its speeds, along with fossil fuels, to explain why burning these fuels disrupts the natural timescales of carbon storage and release in the Earth.
Read…
So, why is carbon such a big deal?
Well, carbon is essential in living organisms because it forms stable bonds with other atoms, creating many complex molecules. Insert chemistry flashbacks here! These complex molecules are the building blocks of life on Earth, forming everything from proteins and fats to carbohydrates and nucleic acids. A great example is DNA, the molecule that carries genetic information, which has a backbone made of carbon atoms. When these carbon-based molecules break apart and form bonds with oxygen to create carbon dioxide, they release energy that is critical for all life forms - from the tiniest microorganisms to the largest mammals.
In the carbon cycle, plants and tiny ocean organisms called phytoplankton play a crucial role by absorbing carbon dioxide from the air. Through the process of photosynthesis, a process that requires energy from the sun, they convert carbon dioxide and water into sugars (storage containers of energy initially from the sun) and release oxygen as a byproduct. You've probably heard how trees “clean” the air by taking in carbon dioxide and releasing oxygen. This process can be summarized by the chemical equation:
Plants return carbon to the atmosphere in four main ways: through cellular respiration (which breaks down sugars using oxygen, releasing energy and CO₂), when animals consume them, when they decompose after dying, and when they burn. In each of these processes, the sugars in plants are broken down, releasing energy, water, and carbon dioxide back into the air:
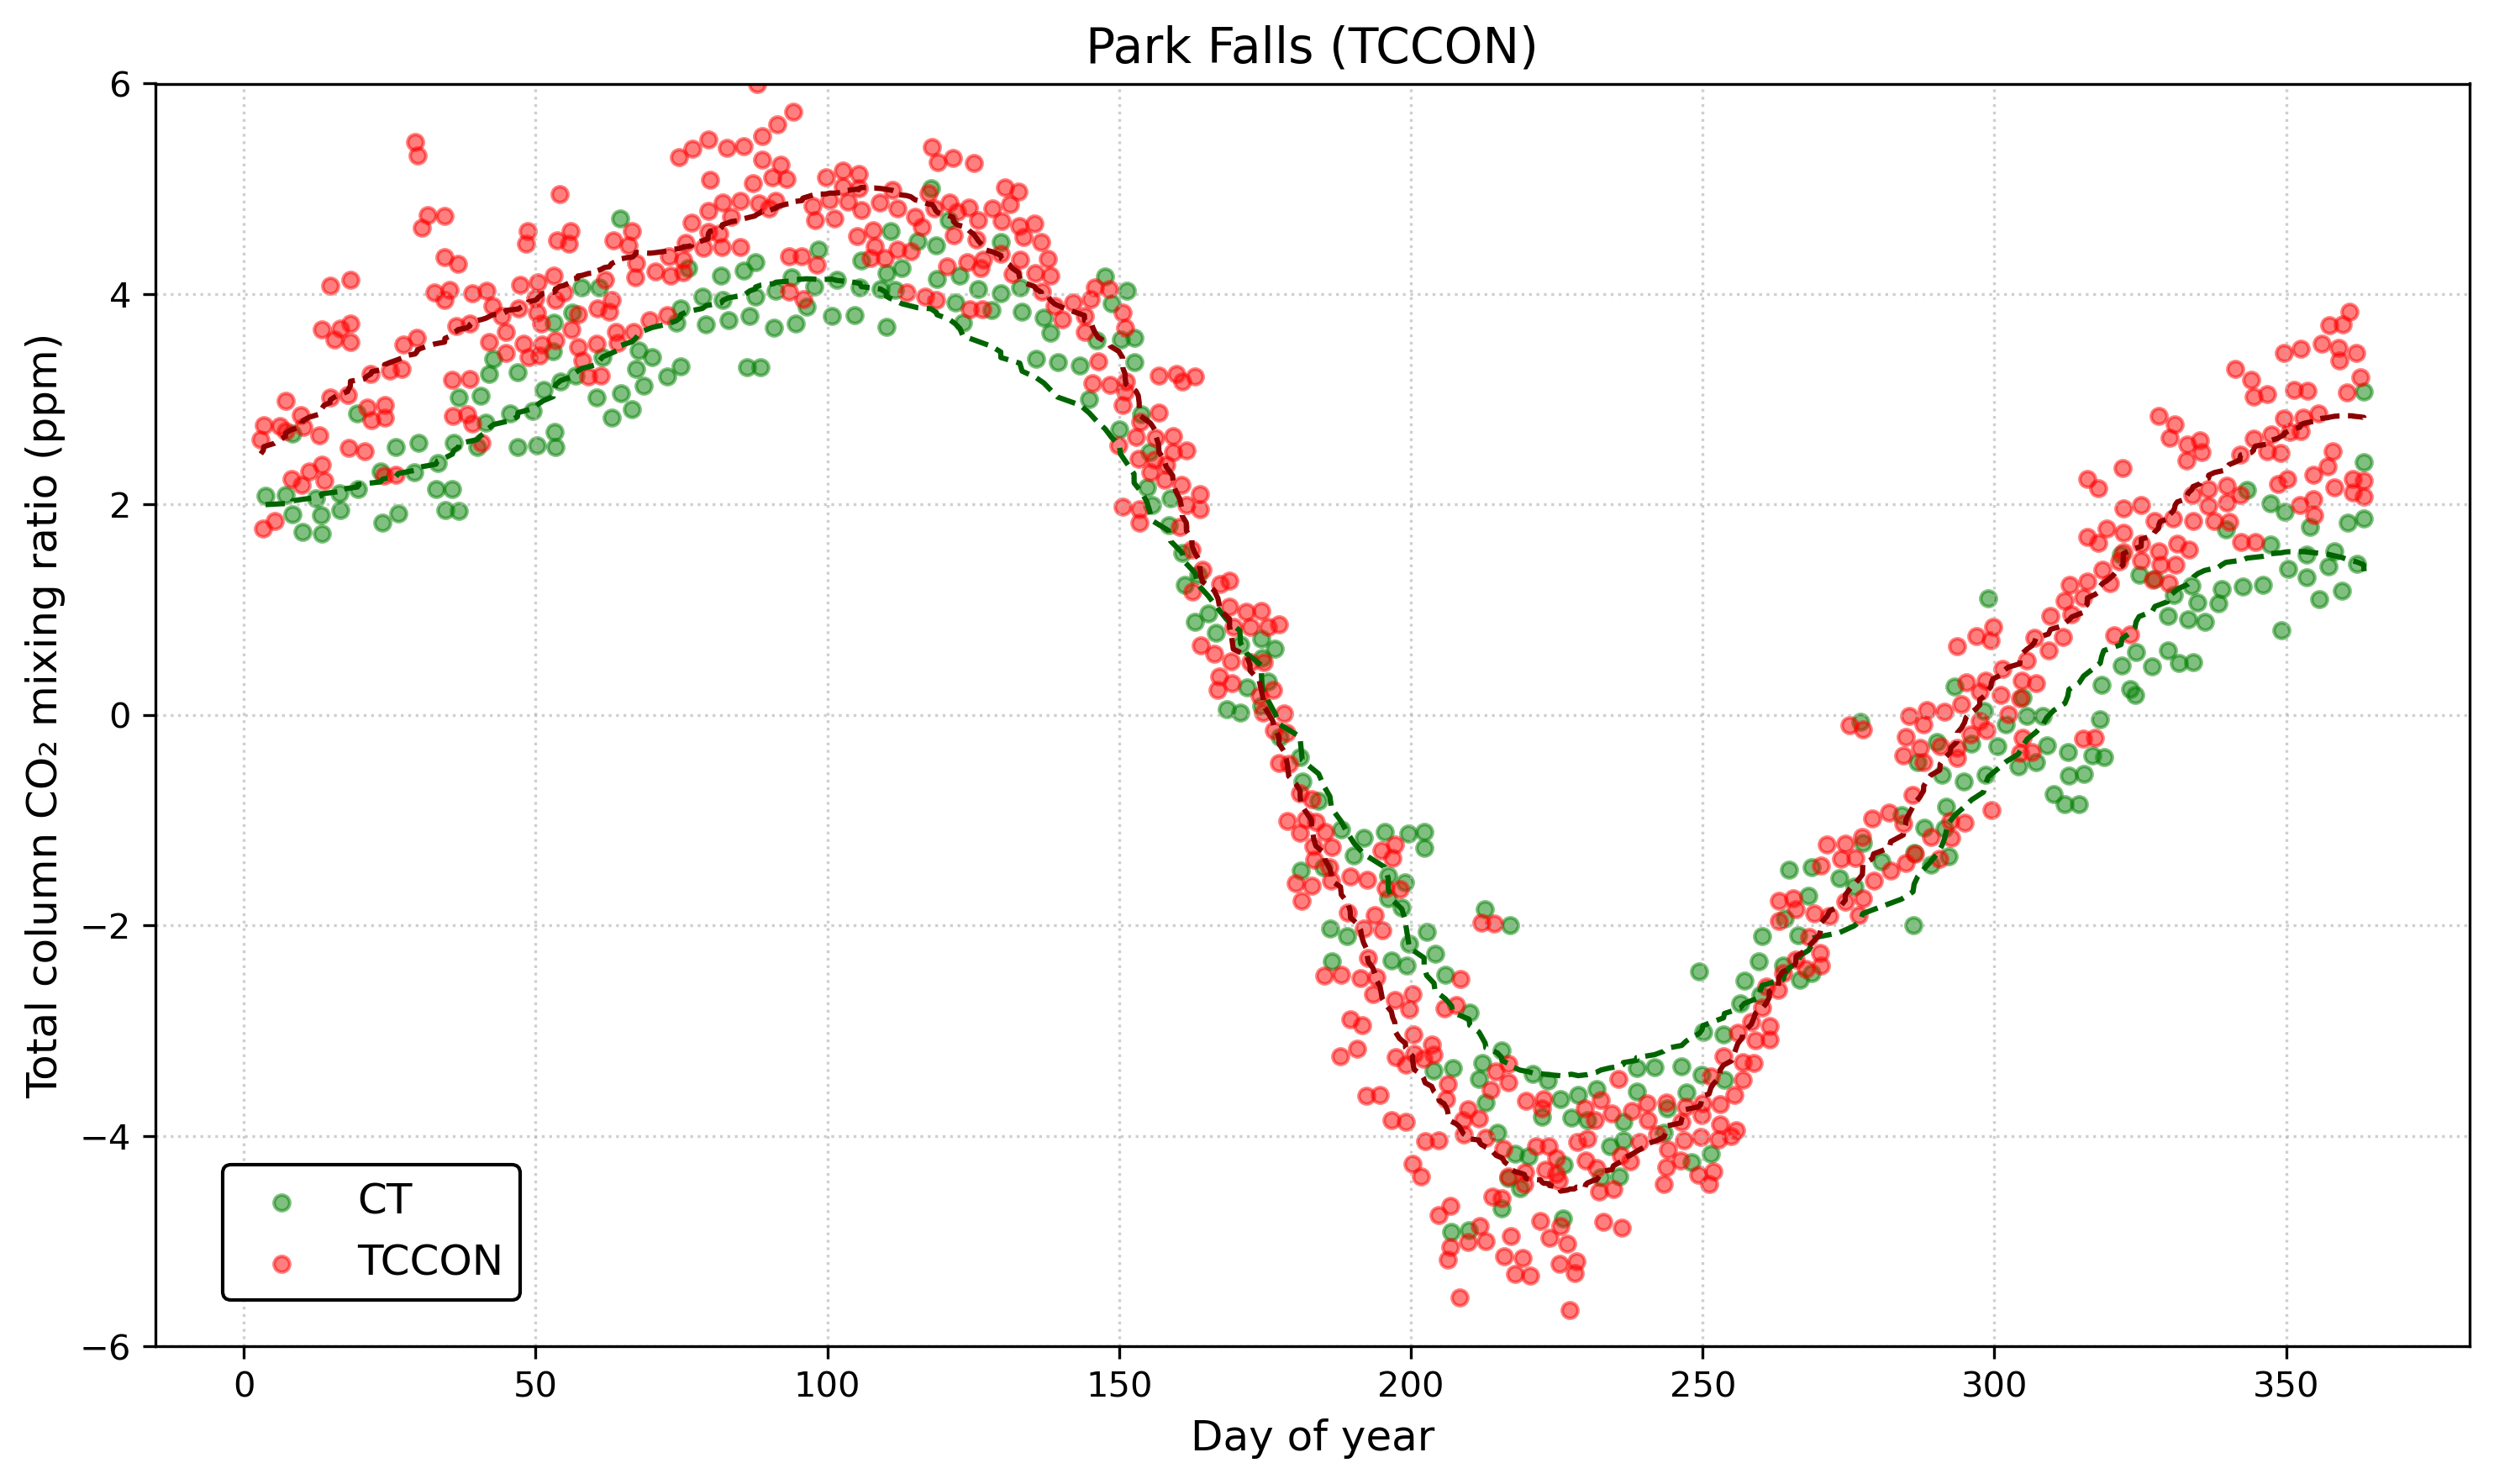
This release of carbon dioxide is part of the fast carbon cycle and is closely linked to how plants grow and change with the seasons. For example, in the Northern Hemisphere, atmospheric carbon dioxide levels go up in the winter when fewer plants are growing (and taking up CO₂) and more are decaying (releasing CO₂), and then they drop in the spring when plant growth picks up again. This yearly cycle shows how the Earth itself seems to “breathe” with the seasons. See the graph below, which shows CO₂ measurements in the air at Park Falls, Wisconsin. The time series is plotted as an anomaly (think back to lesson 1) relative to the annual mean. It is highest at the very left and very right of the graph, representing the colder, darker winter months in the Northern Hemisphere (“Day of Year” equal to 1 is January 1st), when very little photosynthesis occurs. It then rapidly drops starting around day 110-120, which corresponds to mid-to-late April as trees leaf out and ground vegetation grows robustly. It bottoms out around day 225 or so, which corresponds to mid-August, the very end of the growing season, when plants in the area start to become dormant.
So, under natural conditions, the interplay between the fast and slow carbon cycles helps maintain a balanced level of carbon in the atmosphere, land, plants, and ocean. However, any disruption in one area of this balance can create ripple effects across the others!
This is where scientists grow concerned. Currently, human activities are significantly altering the carbon cycle in ways that amplify these imbalances. While we’ll dive into topics like deforestation (i.e., removing plants as natural carbon vacuums) later, let’s first focus on how fossil fuels fit into the picture.
Fossil fuels—like coal, oil, and natural gas—are energy sources that trace their origins back to ancient organic matter, formed millions of years ago. They’re called “fossil” fuels because they come from the preserved remains of long-dead plants and animals, stored deep within the Earth’s layers. It’s like nature’s slow cooker, but instead of a delicious stew, we get coal, oil, and gas when the dial is set to “geologic time.” I think I’ll stick to using my crockpot for chili, though!
Coal, for instance, formed from the dense, swampy forests that existed during the Carboniferous period, around 300 million years ago. The name Carboniferous literally means “coal-bearing,” from the Latin carbō (“coal”) and ferō (“carry”), and refers to the many coal beds formed globally during that time! As these plants died, they became buried in waterlogged environments where oxygen was scarce, slowing their decay. Over time, layers of sediment piled on top, fully cutting the dead plants off from the atmosphere. Eventually, increasing pressure and heat gradually transformed this plant material into coal.
Oil and natural gas, on the other hand, originated from tiny marine organisms—microscopic plants and animals—that drifted to the ocean floor when they died. As layers of mud and sediment buried them, similar forces of heat and pressure worked on this organic matter. However, unlike coal, the combination of factors caused the formation of liquid oil and gaseous natural gas. Over millions of years, these hydrocarbons migrated through porous rocks, eventually getting trapped in pockets deep beneath the Earth's surface.
So why does it matter when we extract these long-buried materials? Fossil fuels are packed with energy because they’re made of hydrocarbons—molecules composed of carbon and hydrogen atoms. The name says it all: hydrocarbons. When we burn these fuels in the presence of oxygen, the bonds between the carbon and hydrogen atoms break, and then the carbon forms strong bonds with oxygen, forming carbon dioxide and releasing energy that had been stored for millions of years in the weaker carbon and hydrogen bonds. The burning process, called combustion, transforms hydrocarbons into carbon dioxide (CO₂) and water vapor (H₂O), while releasing energy as heat—and sometimes light, like the flame on a gas stove or the thrust from a rocket engine.
For instance, when methane (CH₄), the main component of natural gas, combusts, it follows this chemical equation:
Combustion & Incomplete Combustion | Environmental Chemistry | FuseSchool
- Introduction
The video opens with the FuseSchool logo and the title “Combustion & Incomplete Combustion.”
An animated flame appears, symbolizing the topic of combustion. - Complete Combustion
What Combustion is:
The difference between complete and incomplete combustion.
The products of the two types of combustion.
The effects of the products of combustion.
Exothermic Reaction
Gives out heat
Fuel stores potential energy.
Examples of fuels, natural gas, methane.
Methane undergoes complete combustion
An animation shows a hydrocarbon fuel (like methane) reacting with oxygen.
Equations: CH₄ + 2O₂ → CO₂ + 2H₂O
Visuals depict the release of carbon dioxide (CO₂) and water (H₂O), with bright flames indicating the complete combustion process.
The text explains that complete combustion occurs with sufficient oxygen, producing CO₂ and H₂O. - Incomplete Combustion
Methane undergoes incomplete combustion.
The animation changes to show limited oxygen availability.
Equations: 2CH₄ + 3O₂ → 2CO + 4H₂O and CH₄ + O₂ → C + 2H₂O
Visuals depict the release of carbon monoxide (CO), water, and carbon (soot), with dull flames and smoke indicating incomplete combustion.
Water vapor is harmless.
The text explains that incomplete combustion occurs with insufficient oxygen, producing CO and soot. - Environmental and Health Impacts
Animations show the harmful effects of carbon monoxide and soot on health and the environment.
Visuals depict carbon monoxide binding to hemoglobin in the blood, reducing oxygen transport, leading to health issues.
Carbon monoxide is colorless, odorless.
Faulty gas appliances
It is important
Gas fires and boilers regularly serviced.
Unburnt carbon is a particulate.
A pollutant in the air.
Soot particles are shown to cause respiratory problems and contribute to air pollution. - Summary
A recap of the key points: Complete combustion needs enough oxygen, producing CO₂ and H₂O. Incomplete combustion lacks oxygen, producing CO and soot.
Combustion is burning, usually in air or oxygen.
Complete combustion of hydrocarbons produces carbon dioxide and water.
Incomplete combustion produces either carbon monoxide and water, or carbon and water.
The products of combustion have various effects.
Left to the Earth’s natural devices, this carbon from fossil fuels would slowly enter the atmosphere over millions of years due to volcanic activity or rock weathering (hey, it’s that slow cycle!). However, when humans extract and burn fossil fuels, things speed up dramatically—essentially moving carbon from the slow cycle into the fast cycle. This rapid release of carbon into the atmosphere is what concerns scientists most about climate change. It disrupts the natural balance of the carbon cycle, causing a spike in atmospheric carbon dioxide -- a potent greenhouse gas -- over a relatively short span of geological time (instead of talking thousands, millions, or billions of years, we're now talking tens of years!).
Quiz Yourself...
The King of All Greenhouse Gases: Carbon Dioxide
The King of All Greenhouse Gases: Carbon DioxideThe King of All Greenhouse Gases: Carbon Dioxide
Prioritize...
After reading this section, you should be able to:
- Identify the century when carbon dioxide emissions from human activities started increasing and why.
- Describe the relative contribution of different fossil fuel sources to the world’s total carbon dioxide emissions.
Read...
Remember earlier in the class when we talked about “greenhouse gases” and how they absorb and emit infrared radiation? The contributions of greenhouse gases to downwelling infrared radiation from the atmosphere to surface are what create the greenhouse effect, which plays a crucial role in warming our planet.
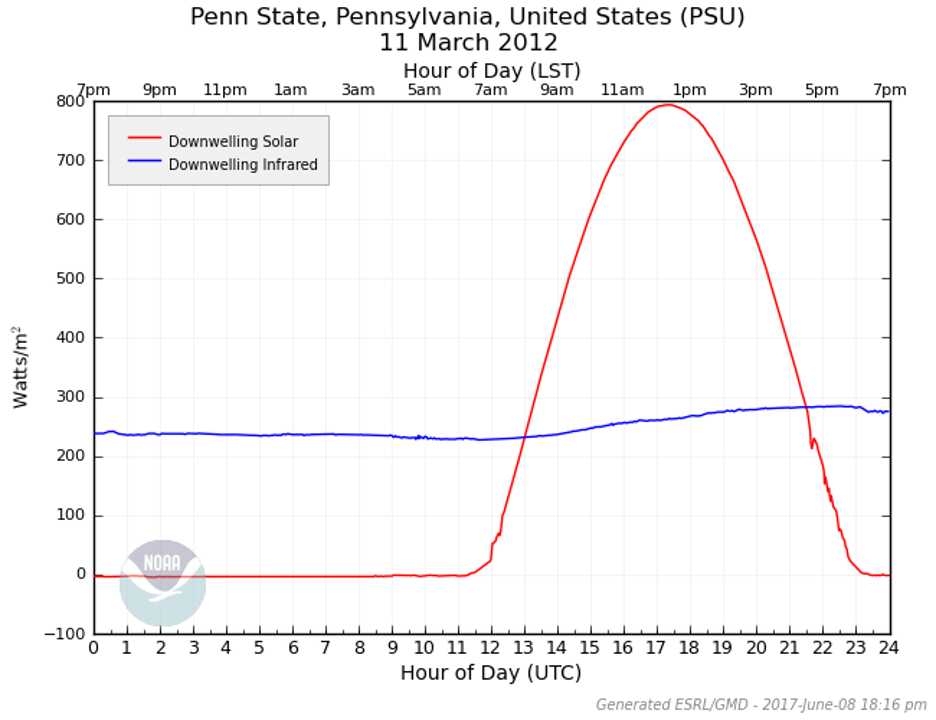
Take a look at the graph below. It shows measurements of downward shortwave and longwave radiation in State College, PA, taken on March 11, 2012. The red curve represents the diurnal cycle of sunlight. It's what we expect: hitting “0” at night (it's dark!) and reaching its peak around local noon. That makes sense, right? Sunlight drives the shortwave radiation, so the cycle follows the sun’s rise and set.
But now look at the blue line. This represents downwelling longwave radiation. Unlike the red curve, it’s nearly constant throughout the day, with a slight peak during the hottest part of the afternoon. Here’s the interesting part: this was a perfectly sunny day—no clouds, no rain—so this blue line isn’t doing anything sneaky. Rather, it shows the constant emission of infrared energy from greenhouse gases in the atmosphere, warming the surface below. Whether day or night, greenhouse gases are always radiating energy down to the surface, which is why this line stays steady. We've used the 24/7 analogy in this class before -- greenhouse gases are no different... always there, always on.
Now I want you to remember that without the greenhouse gases in our atmosphere the Earth system would be much (MUCH!) colder than it is today. The greenhouse effect is a completely natural process, and the warmth it generates is essential for life on our planet. In fact, the greenhouse effect is not just normal—it’s something we absolutely depend on!
So, if the greenhouse effect is both natural and essential, why are we so concerned about human-driven climate change? Great question. It all comes down to balance. As we’ve talked about, burning fossil fuels takes carbon that’s been stored deep within the Earth and releases it by combining it with oxygen in the air, creating extra carbon dioxide (CO₂) beyond the natural levels the atmosphere normally handles.
Think of it this way: imagine the atmosphere as a bathtub already filled to a certain level. Adding CO₂ from burning fossil fuels is like pouring extra water into that tub. Sure, it can handle a little more water, but if you keep pouring too fast and too much, it’s bound to overflow. Similarly, excessive CO₂ emissions from human activities are disrupting the Earth’s finely tuned climate balance, tipping the scales toward global warming.
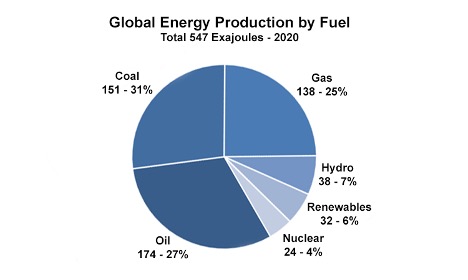
CO₂ emissions grew slowly in the 1800s, but emissions skyrocketed as the population expanded and fossil fuels became the backbone of industrialization. In fact, carbon dioxide emissions have increased more than tenfold since 1900 (Credit: U.S. Department of Energy). While renewables like wind, solar, and nuclear power have chipped away at the dominance of fossil fuels over the past few decades, around 80 percent of the world’s energy still comes from "the big three" of coal, natural gas, and oil. The figure below for 2020 shows this split, with coal, oil, and gas each contributing a sizable portion to global energy production.
Quiz Yourself...
The Recent Rise of Carbon Dioxide
The Recent Rise of Carbon DioxidePrioritize...
After reading this section, you should be able to:
- Explain what the “Keeling” curve is and place today’s carbon dioxide concentrations in context with those from the past few hundred thousand years.
Read...
So how much has carbon dioxide grown over the past century or so? Before the Industrial Revolution, the atmospheric concentration of carbon dioxide was around 280 parts per million. "Parts per million" (commonly abbreviated ppm) asks the question... given a million molecules in a random parcel of atmosphere, how many of them are carbon dioxide? However, through the burning of fossil fuels like coal, oil, and natural gas, humans have added carbon dioxide to the atmosphere. The concentration of carbon dioxide in the atmosphere now exceeds 420 parts per million, and you can see the upward trend in atmospheric carbon dioxide concentration since the late 1950s in the data from the Mauna Loa Observatory in Hawaii below. We've already observed a 50% increase in the amount of CO2 in the atmosphere over the span of a few human generations.
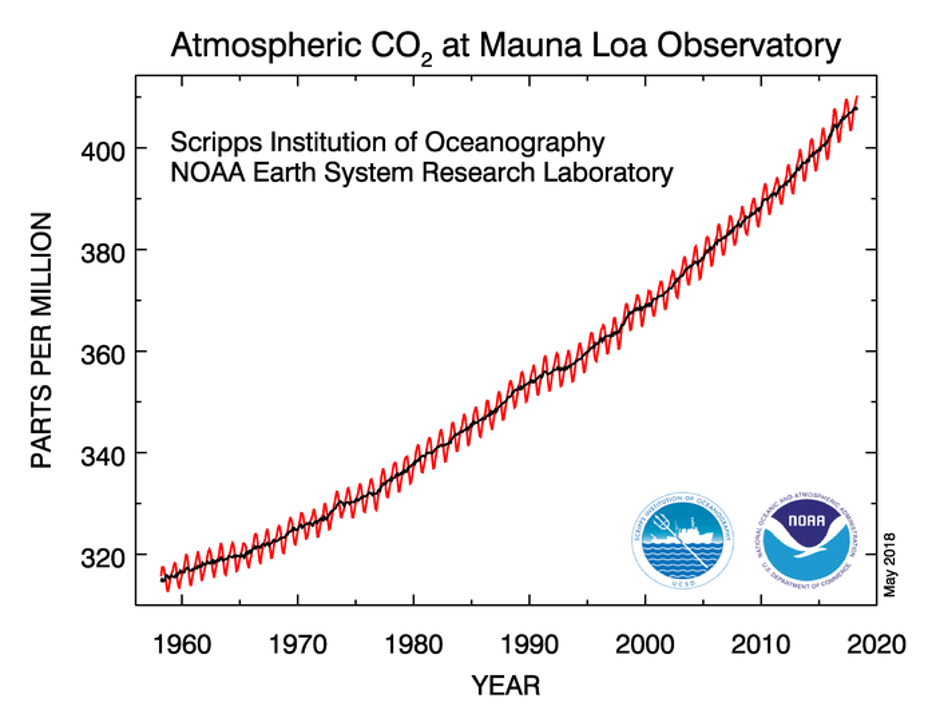
This graph of carbon dioxide (CO₂) over time is iconic. Known as the “Keeling Curve”, it was named after Charles David Keeling, who began consistently measuring atmospheric CO₂ in 1958. The red line reflects the seasonal fluctuations in CO₂ levels—CO₂ decreases during the Northern Hemisphere summer, when widespread plant photosynthesis draws carbon from the atmosphere. However, the black line, representing the long-term average, reveals a steady, unmistakable upward trend over time.
Remember, carbon dioxide is the second most important greenhouse gas after water vapor. Increasing CO₂ concentrations in the atmosphere amplify the greenhouse effect, absorbing more upward directed infrared radiation from the surface, thereby leading to an increase in atmospheric temperature, hence more downward directed infrared radiation as a result of both increasing CO2 concentrations and increased atmospheric temperature. This intensification of energy in the Earth system leads to global warming, which is at the heart of our concerns about climate change.
While the topic of global warming only began to dominate headlines in the late 1980s and 1990s, the idea has been around for much longer. As early as 1903, Swedish scientist Svante Arrhenius, a Nobel Prize-winning chemist, predicted that burning carbon-rich fossil fuels (like coal) would increase CO₂ concentrations and warm the planet. His ideas were largely ignored at the time, not because other scientists doubted the greenhouse effect. Indeed, knowledge of the greenhouse can be traced back to Eunice Foote's research in 1856 and John Tyndall's work in 1859. Rather, incomplete knowledge of Earth's carbon cycle at the time, which we'll study more in depth shortly, did not compel other scientists to fully appreciate the ramifications of such an increase.
Naturally, CO₂ levels have varied throughout Earth's history, but studies of ice cores, which trap air bubbles from the distant past, reveal that the CO₂ concentrations we see today are unprecedented in at least the past hundreds of thousands of years. As the graph below shows, CO₂ levels historically fluctuated between about 180 parts per million (ppm) and 300 ppm for millennia, until the mid-20th century. Since then, however, CO₂ concentrations have skyrocketed, now exceeding 400 ppm, largely due to the burning of fossil fuels.

Quiz Yourself...
Other Greenhouse Gases
Other Greenhouse GasesPrioritize...
After reading this section, you should be able to:
- List the other three greenhouse gas families that are most important for anthropogenic climate change.
- Describe their most common sources in terms of human activities.
Read...
While carbon dioxide tends to grab most of the headlines when we talk about human-driven climate change (and for good reason!), it’s not the only player in the atmosphere affected by our activities.
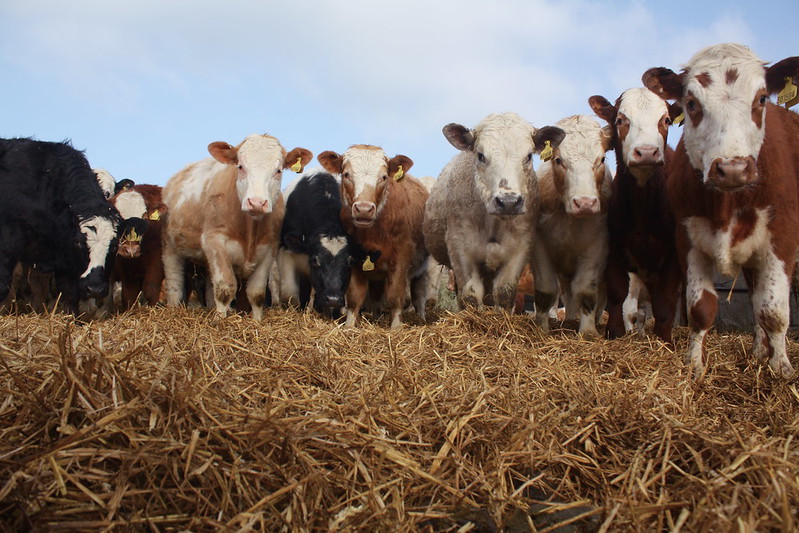
Methane (CH₄) is another potent greenhouse gas, with both natural and human-made sources, and its atmospheric concentration has more than doubled since pre-industrial times. Like carbon dioxide, methane levels began rising around 1800, as human activities became more widespread. Today, about 60% of methane emissions can be traced directly to human activities, with agriculture and waste management being the biggest contributors. For example, livestock like cows, goats, and sheep produce methane during digestion, a process that results in the gas being released into the atmosphere. You may have heard the term “cow farts” thrown around in jokes, but while oversimplified, it’s true that livestock farming contributes significantly to methane emissions.
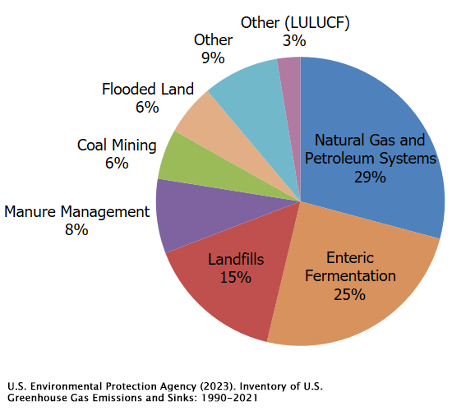
Other major human sources of methane include landfills, where bacteria break down organic waste and generate methane, and rice paddies, where waterlogged soils become breeding grounds for methane-producing bacteria. Then there’s the oil and gas industry: during drilling and extraction, methane often leaks into the atmosphere—a phenomenon known as “fugitive emissions.” These leaks, along with other industrial activities, make up a notable portion of methane emissions.
Below is the breakdown of anthropogenic methane emissions in the United States over the 1990-2021 period. Almost 80% of methane comes from gas leaking, agriculture, and landfills.
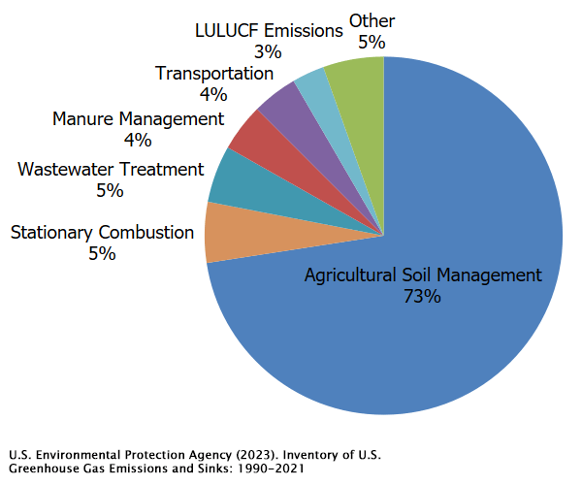
There are two other gases that round out the "core four" greenhouse gases, and nitrous oxide (N₂O) is one of them. You might know it as "laughing gas" from dental procedures, but in the context of climate change, it’s no laughing matter. Since pre-industrial times, the concentration of N₂O in the atmosphere has risen steadily. The main culprit? Nitrogen-based fertilizers.
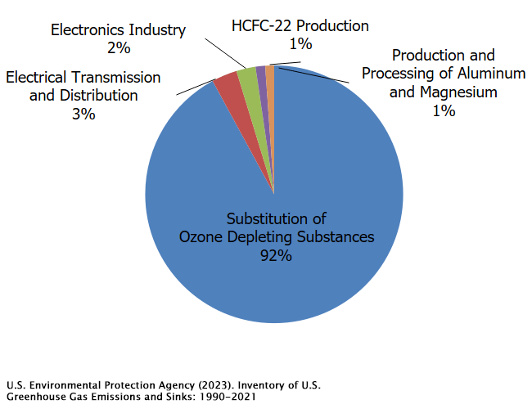
Nitrogen fertilizers are key to enhancing plant growth and boosting crop yields. However, not all of that nitrogen stays in the soil. Some of it escapes into the atmosphere as nitrous oxide. This makes agricultural practices the primary source of N₂O emissions, as shown in the pie chart below. Beyond agriculture, N₂O is also released from a variety of industrial processes, such as burning solid waste, fossil fuel combustion, and wastewater treatment.
Halogenated gases (HGs) are also significant contributors to anthropogenic greenhouse warming. These gases are mainly used in refrigeration, air conditioning systems, and as propellants in products like spray paint and canned cleaners. What sets them apart is the presence of at least one halogen atom—fluorine, chlorine, bromine, iodine, or astatine—in their molecular structure. HGs are primarily the result of human activities, though there are some natural sources like volcanic eruptions and certain oceanic biological processes. However, the amount emitted naturally is quite small compared to human-made sources. In fact, some halogenated gases are entirely synthetic, with no natural counterparts, created in labs for specific uses.
Once these gases are released into the atmosphere, they become well-mixed globally, meaning their concentrations spread out and stabilize around the world. They persist for a long time in the atmosphere, only being broken down in the upper layers where ultraviolet rich sunlight breaks apart their molecular bonds. Unfortunately, this breakdown process is quite slow, making halogenated gases some of the most long-lasting and stubborn greenhouse gases, contributing to warming for many years after their release.
How are all these gases changing? Well, they look a lot like what we saw earlier with CO2. Below is another timeseries, but this time, instead of just including CO2, we also include CH4 and N2O. (The halogenated gases also follow a similar trend.) They all look remarkably similar -- relatively stable for a long period of time before a sharp uptick coinciding with the industrial revolution. Given what we have learned about the sources of these emissions, this indicates that all three gases have seen recent increases that are linked to human activities – increases that go far above and beyond their environmental backgrounds that come about as a result of natural sources.

Quiz Yourself...
Putting the Pieces Together
Putting the Pieces TogetherPrioritize...
After reading this section you should be able to:
- Relate the concentrations of the "big four" greenhouse gases to one another.
- Explain in simple terms why CO₂ is the most important greenhouse gas, and why the properties of the other three gases make them important, even if their concentrations are much smaller.
Read...
We've just covered how human activities have driven up concentrations of methane, nitrous oxide, and halogenated gases (HGs). However, even with these increases, their concentrations are still much lower compared to carbon dioxide. Take a look at the table below, where the concentrations are listed in "parts per billion." It’s clear that CO₂ dominates by a wide margin. To put it in perspective, if fluorinated gases were a single person, they’d be like one person among four sold-out games at Beaver Stadium, while carbon dioxide would represent everyone else in the stands! This massive difference is a key reason why CO₂ often takes center stage in discussions about greenhouse gases and their impact on climate.
| Constituent | Concentration (ppb) |
|---|---|
| CO2 | 400,000 |
| CH4 | 1,900 |
| N2O | 320 |
| HGs | 1 |
It’s important to point out that while methane, nitrous oxide, and halogenated gases may be present in much smaller concentrations than carbon dioxide, the impact of these gases on emission and absorption of atmospheric infrared radiation for a fixed increase in concentration is far greater than for carbon dioxide. The physics behind this is a bit complex and might be better suited for a dedicated physics class, but in simple terms, it has to do with the molecular structure of these gases and the wavelengths at which they emit and absorb infrared radiation. Averaged all methane and carbon dioxide molecules in the atmosphere, it is as if one molecule of methane is 28 times more effective at absorbing and emitting infrared radiation than one molecule of carbon dioxide. So even though their concentrations are smaller—sometimes drastically so—we definitely can’t overlook their role as their concentrations change. In our atmosphere, a little bit of something can go a long way!
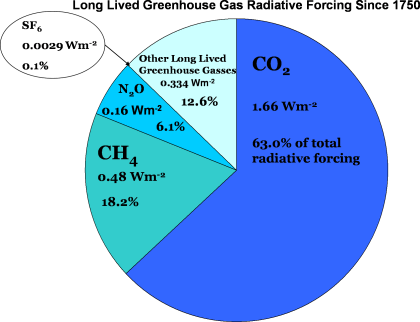
When you factor in both the absolute concentration of these gases and their relative ability to emit and absorb infrared radiation at different wavelengths, you get a clearer picture of their overall impact. The chart below shows how much additional radiation has been added to the climate system since 1750 due to these greenhouse gases, relative to a perfect balance of incoming and outgoing energy.
Roughly two-thirds of the warming caused by human activities can be attributed to carbon dioxide, while another 20% or so comes from methane. The rest is due to nitrous oxide and other greenhouse gases, including halogenated gases. So, while CO₂ might not be as potent on a molecule-for-molecule basis, its sheer volume in the atmosphere—thanks to fossil fuel combustion—still makes it the “top dog” among greenhouse gases.
The end result of these increases in greenhouse gases is that the atmosphere is now retaining about one percent more energy compared to pre-industrial times. Now, that might not sound like much, but when you remember that the atmosphere absorbs around 240 W/m² of energy from the sun, that extra one percent adds up! It’s a key factor in explaining why the planet has warmed nearly 1 degree Celsius (1.8 degrees Fahrenheit) globally since 1970. That small shift in energy balance has big consequences!
Quiz Yourself...
Aerosols Enter the Equation
Aerosols Enter the EquationPrioritize...
After reading this, you should be able to:
- Define aerosols and explain how they can either cool or warm the atmosphere.
- Describe how aerosols falling onto a surface (particularly "white" surfaces, like snow) impact climate.
Read...
When we consider the impact of human activities on global climate, it's important to recognize that not all outcomes have to lead to warming. An obvious example is the emission of aerosols into the atmosphere. The combustion of fossil fuels, while a primary driver of climate change, is also a major source of air pollution! This pollution comprises various gases and particulates, including sulfur compounds and an assortment of small solid particles like soot and ash. On a small scale, if you’ve ever lit a wood fire like the one below, you know all about this particulate matter that is emitted during the combustion process.

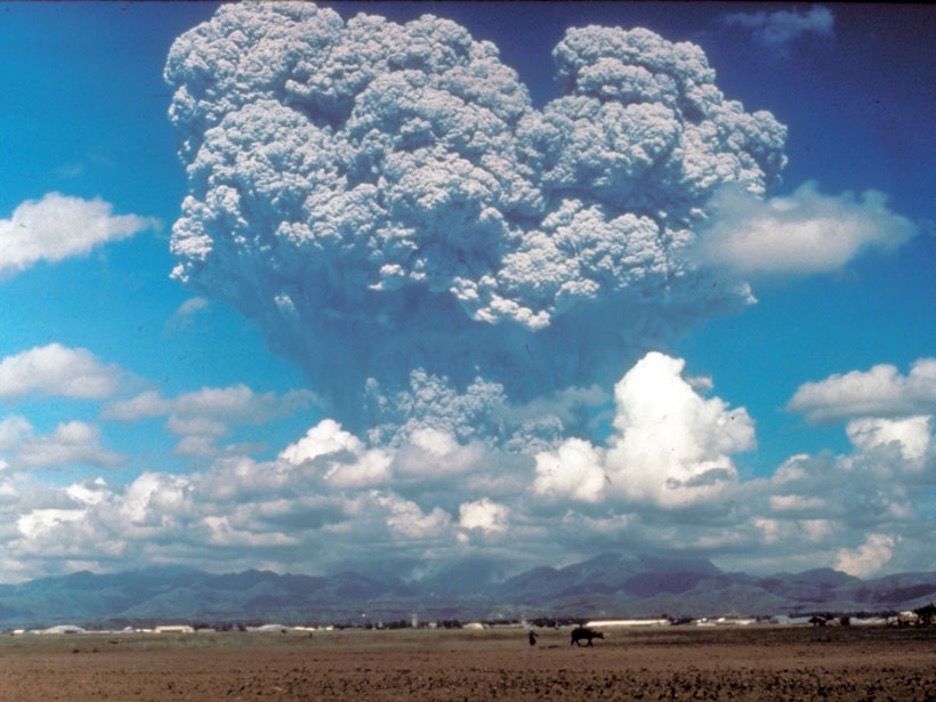
While these aerosols are harmful to air quality, they also have a complex impact on the Earth's climate. Remember when we talked about volcanoes ejecting sulfur dioxide (SO₂) into the stratosphere? Once there, it combines with water vapor to form sulfate aerosols. These aerosols act like tiny mirrors, reflecting incoming solar radiation away from Earth and reducing the amount of energy that reaches the surface. This reflection leads to a cooling effect.
But volcanoes aren’t the only source of sulfate aerosols. Sulfur gases released during combustion can also undergo chemical reactions in the atmosphere, producing aerosols. These tiny liquid droplets or solid particles often serve as cloud condensation nuclei—the seeds around which cloud droplets form. More aerosols in the atmosphere can lead to more clouds, and more clouds mean more sunlight is reflected back into space, increasing Earth's albedo. This is referred to as a "secondary" effect, since the cooling impact comes not directly from the aerosols themselves, but from their role in enhancing cloud formation and cloud reflectivity.
It’s also important to note that human-produced aerosols are more of a constant presence compared to those from volcanoes, which are sporadic. Scientists have observed that aerosols had a significant influence on the Earth's climate, especially during the first half of the 20th century. In fact, it’s estimated that the warming effect of greenhouse gases at the time was largely offset by the cooling effect of aerosols. Essentially, humans were pumping both warming and cooling pollutants into the atmosphere, and the overall impact was more or less a balancing act!
But by the mid-20th century, it became clear that aerosols weren’t just affecting the climate—they were also taking a toll on human health. Long-term exposure to aerosols and particulate pollutants was linked to respiratory issues and increased cancer risk. This led to the implementation of stricter air quality regulations, like the Clean Air Act of 1970 in the United States, which successfully reduced the amount of aerosols released into the atmosphere. While this has been a huge win for public health, it’s had some unintended climate consequences. As aerosol levels have dropped, so has their cooling effect.
The Clean Air Act: good for health, meh for climate
The Clean Air Act of 1970 was a landmark piece of legislation in the U.S. that set out to regulate air pollution and protect public health. At the time, cities were grappling with thick smog, acid rain, and rising rates of respiratory illnesses. The Act gave the federal government the authority to set and enforce limits on pollutants like sulfur dioxide (SO₂), nitrogen oxides (NOx), and particulate matter. This had an immediate and dramatic effect on air quality, reducing the pollutants that were causing health issues like asthma, lung disease, and even cancer.
But there’s more—by cutting down on aerosol emissions, the Clean Air Act also had a ripple effect on the climate. Cleaner air means fewer aerosols to mask the warming caused by greenhouse gases, which has led to a faster rate of warming. In short, it helped us breathe easier, but it also pulled back the curtain on the true extent of global warming. So, while we’ve made progress on air quality, the flip side is that the pace of global warming has picked up.
However, I should finish by noting that not all aerosols have a cooling effect on the climate. One key player that does the opposite is black carbon - also known as soot. This aerosol comes from incomplete combustion in sources like diesel engines, wood stoves, and the open burning of biomass. If you've ever been behind a big diesel tractor-trailer moving up a hill, you've probably seen black carbon emanating from its smokestacks. Unlike most aerosols that reflect sunlight, black carbon actually absorbs it. Think of it as the “dark side” of aerosols, absorbing incoming solar radiation and converting it into heat. In this way, black carbon warms the atmosphere, acting more like a greenhouse gas—but with a twist. While greenhouse gases absorb and emit longwave (i.e., infrared) radiation, black carbon primarily absorbs shortwave radiation from the sun while emitting and absorbing longwave radiation as well.

The impact of black carbon doesn't stop in the atmosphere. When these particles fall (or “deposit”) onto snow and ice, they create another problem. Typically, these bright surfaces reflect a lot of sunlight back into space, thanks to their high albedo (remember, white surfaces mean lots of reflection, black surfaces mean lots of absorption!). But when black carbon settles on them, it darkens the snow or ice, reducing its reflectivity. This causes more sunlight to be absorbed, leading to faster warming and accelerated melting. Imagine a thin layer of soot covering a pristine snowfield on a mountain—suddenly, that reflective surface is now a huge absorbing one of shortwave radiation.
Reducing black carbon emissions can actually help cool the climate system, which makes it an important target for climate action. In contrast to sulfate aerosols that cool the planet by reflecting sunlight, black carbon is a warming agent. So, cutting down on black carbon could be a win-win: improving air quality and slowing global warming at the same time.

Quiz Yourself...
Radiative Forcing
Radiative ForcingPrioritize...
After reading this section, you should be able to:
- Define what a "forcing" is and provide an example.
- List the major radiative forcings in the climate system and understand their relative importance compared to each other.
- Provide at least two examples of positive radiative forcings and one example of a negative radiative forcing in the Earth system.
Read...
There have been a few times we’ve used the term “forcing” when talking about greenhouse gases and climate change. And the term comes up repeatedly when you read a news article about climate change, watch a TV spot, or listen to a podcast. But what does the term actually mean?
Radiative forcing is essentially a way to measure how different factors affect the Earth's energy balance. Remember when we talked about the energy budget? The sun shines on Earth, the planet absorbs some of this shortwave energy and reflects the rest back into space. At the same time, Earth is constantly emitting energy as longwave radiation. The balance between the energy Earth absorbs and emits to space determines our climate. Any factor that disrupts this balance—either by trapping more heat or allowing more heat to escape—is what we call a "radiative forcing."
Here’s a way to think about it: picture a mug of hot cocoa sitting on a warming plate. At some point, the cocoa will reach a steady temperature because it’s being heated from below but also losing heat to the air around it. Now, if we wrap the mug in insulation, what happens? The cocoa heats up beyond that steady point because it’s no longer losing as much heat to the room. That insulation is acting like a "forcing" in our cocoa system, changing the balance of energy. This is exactly what radiative forcing does in Earth's climate system!

Two mugs of hot cocoa on warming plagues. The mug on the right is warmer even with the same energy input (same setting on the warming plate) because it is insulated (i.e., positive forcing) and retains heat more effectively. Greenhouse gases in the atmosphere act similarly.
Key Definition:
Radiative forcing refers to the change in energy balance in the Earth's atmosphere caused by factors like greenhouse gases or aerosols. It measures how much a specific factor either traps more heat or allows more heat to escape, ultimately affecting the planet's climate system. Positive radiative forcing means that factor warms the planet, negative radiative forcing means that factor cools the planet.

Take a look at this figure, which captures our current understanding of radiative forcing caused by different atmospheric components. The length of each bar represents how much each agent is affecting the climate—essentially, how much warming or cooling it’s contributing. Red bars indicate warming, while blue bars represent cooling. You’ll notice the horizontal “barbells” attached to each bar—these are error bars, showing how uncertain we are about the exact effect of each factor. Longer error bars mean greater uncertainty, so keep an eye on them as you interpret the data.
The units here are watts per square meter (W/m²), which essentially tells us how much energy each agent adds or removes from the Earth system. You can think of it as a way of quantifying “how much warming or cooling” each factor contributes to the planet’s energy budget.
The figure breaks down these factors into two major categories: those caused by human activities (anthropogenic) and those that occur naturally. The top section of the chart lists human-driven changes—things like greenhouse gas emissions. You’ll notice that the 'big four' greenhouse gases we’ve talked about (carbon dioxide, methane, halogenated gases, and nitrous oxide) all show significant warming contributions. Interestingly, halogenated gases (HGs) have a slight cooling effect in addition to warming because some of these gases destroy ozone in the stratosphere, reducing the amount of shortwave radiation the Earth absorbs. This dual role makes them a bit more complicated than other greenhouse gases.
Next, let’s touch on the "short-lived gases" rows. These are gases like carbon monoxide (CO), non-methane volatile organic compounds (NMVOCs), and nitrogen oxides (NOx). We haven’t spent much time on these yet, but they’re worth mentioning. These gases don’t last long in the atmosphere—anywhere from a few hours to a few days—but they play an important role in the climate system. Even though they aren’t major greenhouse gases themselves, they drive chemical reactions that influence the concentrations of other climate forcers like ozone and methane. For example, NOx reacts with sunlight to produce ground-level ozone (a potent greenhouse gas and pollutant), while CO and NMVOCs help prolong the lifespan of methane in the atmosphere. These gases come mostly from combustion processes, like vehicle emissions and industrial activities. While they don’t directly cause warming, their role in enhancing other pollutants makes them key players in short-term climate and air quality—think of them as carbon dioxide’s morning coffee, giving it an extra kick.
Right below, we have aerosols, split into warming (black carbon) and cooling (sulfate aerosols) effects. The red portion of the bar represents black carbon (soot), which absorbs sunlight and warms the atmosphere, while the blue portion represents sulfate aerosols, which scatter sunlight and cool the Earth’s surface. The two effects nearly cancel each other out, but as you can see from the long error bar, there’s a lot of uncertainty surrounding the net impact. Directly beneath this is "Changes in clouds due to aerosols," which refers to the secondary effects of aerosols acting as cloud condensation nuclei. More aerosols mean more cloud droplets, which makes clouds more reflective, bouncing more sunlight back into space. So, in this case, “dirtier” air can lead to a cooling effect by brightening clouds. We’ll explore this concept later when we talk about "cloud seeding" as a proposed climate solution.
The last row under human activities is about land-use change, which we’ll cover in more detail soon. Finally, we have the sole natural source of variability—changes in solar energy due to long-term trends in sunspots. As we discussed in the last lesson, this effect is relatively small compared to the human-driven factors shown above.
Understanding these factors and their impacts on radiative forcing helps us comprehend how they shift the Earth's energy budget, leading to changes in climate. As we progress through this course, we'll explore how these changes, whether warming or cooling, have shaped the Earth's climate over the past century and what that means for our future.
Quiz Yourself...
Feedbacks
FeedbacksPrioritize...
After reading this section you should be able to:
- Define what a "feedback" is.
- Differentiate between positive and negative feedback, and explain what each means for the climate system.
- List three feedback mechanisms in the climate system and briefly describe how they generally operate.
Read...
As we've seen, the concept of radiative forcing – whether natural or caused by humans -- is a crucial component in the study of Earth's climate, acting as the initial 'nudge' that can either warm or cool our planet. However, the climate system doesn't always respond in a straightforward manner to these forcings. It's here that I need to introduce the concept of 'feedbacks' — processes that can either magnify or mitigate the effects of the original forcing. These feedbacks are essential in understanding the full scope of climate change, as they often determine the magnitude and rate of a climate response.
OK, consider the climate system as a live concert sound system. The 'forcings' are like the original sound from the instruments and vocals — they start the process of producing music. Now, feedbacks are akin to the soundboard's adjustment knobs that the audio engineer uses to fine-tune the music that the audience hears.
When the engineer turns up a knob (positive feedback), it's like boosting the volume or bass to enhance the sound — this can make the existing music fuller and louder, much like positive feedback mechanisms in the climate can amplify warming. For example, a slight increase in temperature from greenhouse gases can cause more water vapor to enter the atmosphere, which in turn traps even more heat and further warms the planet.
Conversely, if the engineer dials down a knob (negative feedback), it can soften a piercing high note during the concert, maintaining a pleasant listening experience. This is similar to how negative feedback mechanisms in the climate system can counteract warming, like how increased cloud cover might reflect more sunlight away from the Earth's surface, helping to cool the planet.
In this way, just as the audio engineer uses the soundboard to balance the music, Earth's climate system is constantly adjusting through feedback mechanisms to balance the planet's energy budget.
Let’s think about this more concretely. If our planet gets a nudge (like more sunlight or more greenhouse gases), these feedback mechanisms can make the Earth's response stronger or weaker. Where this can be problematic for us is when a positive feedback actually makes things warmer than they would be just from that nudge alone. Check out this schematic below. The center box is the amount of warming, let’s say that arises due to additional CO2 emissions into the atmosphere since the industrial revolution. A positive feedback adds more warming on top of that warming, making the CO2 punch above its weight!
Key Definition:
A feedback in the context of climate refers to a process that can either amplify or reduce the impact of an initial change in the Earth's energy budget. For example, a positive feedback might enhance warming, like ice melting, which lowers albedo and leads to more heat absorption. A negative feedback would counteract the change, such as increased cloud cover reflecting more sunlight and cooling the surface.

Let's talk about a few key feedback mechanisms related to climate change:
- Water Vapor Feedback
As we discussed in earlier lessons, as the atmosphere warms, it holds more water vapor. We also know that water vapor is a greenhouse gas, leading to further warming. Luckily, while this is a positive feedback (and amplifies warming) it isn’t a runaway feedback since a warmer, moister atmosphere eventually removes water through precipitation. - Cloud Radiative Feedbacks
How clouds in the atmosphere respond to global warming is incredibly complex and influenced by changes in cloud distribution and type. For example, we know that clouds can both warm the surface by absorbing and mitting infrared radiation or cool it by reflecting sunlight. The overall effect varies with cloud characteristics like type and altitude. This feedback is very complicated, still actively researched, and one of the largest uncertainties in predicting the exact state of future climates. - Ice-Albedo Feedback
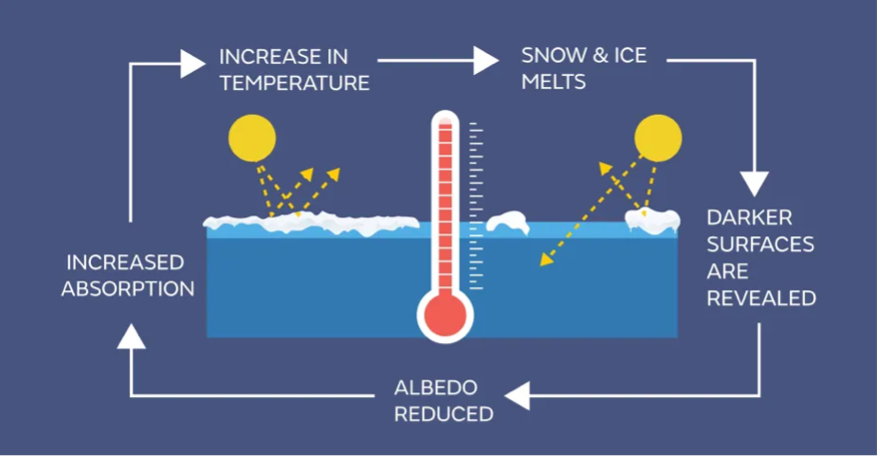
As Earth warms up, ice and snow (very bright, reflective surfaces) start to melt, revealing land or water beneath. Both the land and water have lower albedos than the ice, meaning they absorb more solar radiation. Therefore, the removal of ice in a particular region and the pooling of liquid water on top of ice in another region lead to warming in that region via this increased absorption. This warming makes even more ice in the area likely to melt, further accelerating this spiral. This feedback is a classic example of a positive feedback and is relatively easy to visualize. See the below figure!
When we examine all these feedback loops together, they generally amplify the initial warming triggered by any change in our climate. For instance, let's consider a scenario where the CO2 levels in our atmosphere double compared to the pre-industrial era, due to extensive fossil fuel combustion. This would take us from about 280 parts per million CO2 to 560 parts per million (for context, we are currently around 420 ppm). This alone (in the absence of other gases and feedbacks) would lead to a temperature increase of about 1.25°C. However, when we factor in the additional warming from feedback processes, such as the extra heat trapped by increased water vapor or the reduced reflection of solar radiation due to melting ice, the temperature could actually climb by about 2.5°C to 3°C, as suggested by some climate models – which we will learn about in a few lectures.
Quiz Yourself...
Local Climate Modification: Urban Heat Islands and Deforestation
Local Climate Modification: Urban Heat Islands and DeforestationPrioritize...
When you finish this section, you should be able to:
- Define urban heat island and how it impacts local climate
- Define deforestation and describe how it may impact regional climate
Read...
While we often focus on emissions when talking about climate change, they’re not the only way humans influence the climate. Our impact can be felt on a much smaller scale, too. I want to share a couple with you...
Urban Heat Island
Take a look at the satellite image above from the afternoon of March 27, 2001. This is a typical infrared image, which can be used to infer temperature based on emitted infrared radiation. We know that clouds emit radiation, but it was clear over Minnesota at this time. So, what you’re seeing is a measure of the actual temperature of the Earth’s surface (with darker areas being warmer). Remember that the amount of radiation emitted is directly tied to temperature—the hotter something is, the more radiation it gives off.
Now, check out that large dark patch in eastern Minnesota, along with those smaller dark spots scattered around. Have any guesses as to what they are?
These local warm areas aren't some random shapes—those are cities! The biggest is the Minneapolis/St. Paul metro area, but you can also spot smaller cities like St. Cloud, Rochester, and Mankato. What you’re seeing here is the urban heat island effect, which refers to how cities tend to be significantly warmer than their rural surroundings. On a sunny day with light winds, cities tend to be several degrees warmer than their rural surroundings because pavement, buildings, and other urban materials absorb more solar radiation than their surroundings due to their lower albedo (reflectivity). On top of that, heat from cars, industry, and general human activity adds to the warmth. Meanwhile, the surrounding countryside, covered in vegetation with a higher albedo, stays cooler. Plants also release moisture through transpiration (we talked about this in the water lesson – transpiration is basically plant sweat), which further cools the area.
The difference in temperatures between urban and rural areas is most noticeable at night, especially on clear, calm winter nights following sunny days. As the city heats up more during the day, it stays warmer at night because concrete, asphalt, and buildings slowly release the heat they’ve absorbed. In contrast, rural areas cool down faster since they didn’t heat up as much during the day. So, urban areas tend to be warmer than surrounding rural ones, both during the day and at night.
In the infrared satellite image above, the urban heat islands are particularly striking because the surrounding countryside was snow-covered. If you look below at a visible satellite image of this region, the rural areas appear white due to the high albedo of snow, while the cities, where much of the snow had melted, appear darker because of their lower albedo.
The takeaway here is that these satellite images look the way they do because humans have significantly altered the local environment. They’re a clear illustration of how human activity impacts weather and climate on a local scale. But the urban heat island effect—localized warmth and lower albedo—isn’t the only change happening in the concrete jungles of our cities. Numerous studies suggest that rainfall tends to increase downwind of large metropolitan areas, especially in the summer when winds are typically weaker. This setup allows urban heat islands to act as local "hot spots," promoting instability and encouraging rising air currents. Essentially, the warmer, buoyant air over cities rises, forming tall cumulus clouds, which can grow into showers and thunderstorms as they drift downwind.
One of the first and most comprehensive studies to measure the effect of urban areas on precipitation was METROMEX (METROpolitan Meteorological EXperiment). This multi-year research project, which started in 1971 in St. Louis, Missouri, found that average summertime rainfall, as well as the frequency of thunderstorms and hail, increased by up to 25% in a broad area around the city, extending 40 miles eastward. Similar studies in other cities like Chicago and Washington, D.C., have shown comparable results.
To visualize the urban impact on convection, take a look at the lightning flash density around Houston, Texas, from 1989 to 2001. The image below shows the number of lightning strikes per square kilometer per year. As you can see, the highest flash density is downwind (east) of the city, illustrating how the urban environment can influence storm development and increase lightning activity.
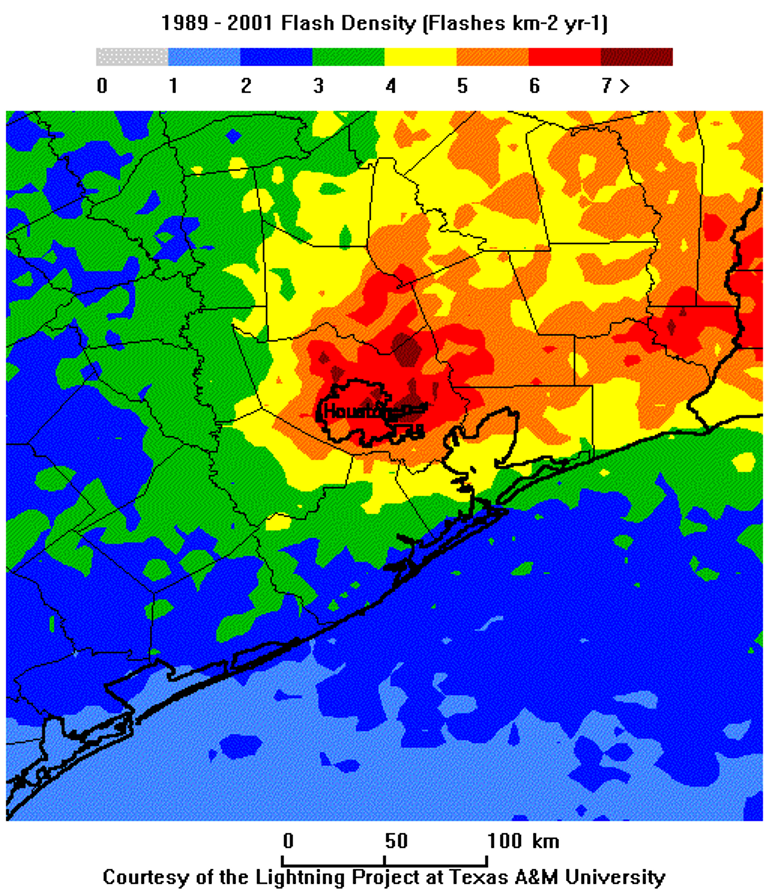
Lightning Flash Density in the Houston area from 1989 – 2001.
Notice that the highest concentration of lightning strikes occurred just downwind (east) of Houston. This study found a 45% increase in flash density downwind of the city compared to the upwind suburbs (mainly west of the city). These results align with findings from a broader study of 16 Midwestern cities which showed that lightning strike frequency downwind of cities was, on average, 40% higher than in rural areas upwind. This increased lightning activity corresponds with higher rainfall rates downwind of cities compared to rural, upwind areas.
But the effects of urbanization aren't just limited to temperature and precipitation. The changes in the landscape—removing vegetation and soil, and replacing them with impervious paved surfaces and drainage systems—alter what happens to precipitation after it falls. More water runs directly into rivers and streams, rather than being absorbed by the ground and plants. This increased runoff means that urban streams rise faster and are more prone to flooding during heavy rain compared to rural streams.
So, land use and urban development play a key role in shaping local weather and climate. And even if land isn’t urbanized, changes in land use can still have major impacts. That brings us to...
Deforestation
Deforestation is the clearing of forests to make way for agriculture, pastures, or urban development, and it has a wide range of both global and local impacts. Here, we'll focus on its effects on temperature and the hydrologic cycle. Trees and plants in forests act as water reservoirs and help keep local temperatures in check because a portion of the sun’s energy is used to evaporate water from the forested environment. In deforested areas, however, more water runs off directly into streams and rivers, leaving less moisture to evaporate. With less water available for evaporation, more of the sun’s energy goes toward warming the surface, which heats the air above.
This effect is particularly striking in tropical rainforests. NASA estimates that clearing rainforests down to bare ground can raise local temperatures by as much as 3°F, which significantly impacts the local climate. Tropical rainforests are not only humid and rainy, but they also recycle a lot of water back into the atmosphere through evaporation and transpiration. This creates a cycle where the water vapor encourages more cloud formation and rainfall. In extreme cases, like in the Amazon Basin, trees are estimated to help generate about half of the region’s rainfall! So, when rainforests are destroyed, the local rainfall significantly decreases.
Besides the moisture impacts, deforestation also increases the surface's albedo, meaning more sunlight is reflected back into space instead of being absorbed by the ground. This limits the amount of energy transferred into the lower atmosphere. You can clearly see the difference in albedo between forested and non-forested areas in satellite images taken on a clear day—forests appear darker compared to agricultural lands. The contrast is even more dramatic during the winter when snow covers the ground, as shown below in this visible satellite image from January 18, 2018. The image shows the contrast between the low albedo of forested regions compared to snow-covered, agricultural valley regions. For a closer look, here's the full-sized image.

In many regions, deforestation is thought to cause a slight cooling effect. This happens because the increased albedo (more sunlight being reflected) outweighs the drying effects—where more of the sun’s energy is directed toward warming the surface rather than evaporating water from it. Essentially, with fewer trees to absorb sunlight and less water to evaporate, more solar radiation is reflected back into space, leading to a net cooling. However, tropical rainforests are a major exception. In these regions, the massive disruption to the hydrologic cycle—primarily the sharp drop in evaporation—tips the scales toward warming, making local temperatures rise instead of cool.
Quiz Yourself...
Summary
SummaryRead...
- The carbon cycle describes how carbon moves through the Earth's system, including the atmosphere, oceans, soil, and living organisms.
- There are two speeds: the slow cycle (millions of years, involving rocks, oceans, and volcanic activity) and the fast cycle (on human timescales, involving plants, animals, and the atmosphere).
- Fossil fuels like coal, oil, and natural gas are stored carbon from ancient organisms that humans burn, releasing energy and CO₂.
- This rapid release of carbon from fossil fuels moves carbon from the slow cycle into the fast cycle, disrupting the natural balance and contributing to climate change.
- Human activities since the Industrial Revolution have caused CO₂ concentrations to rise significantly, from around 280 ppm to over 420 ppm today.
- CO₂ is the second most important greenhouse gas after water vapor, and its increased concentration enhances the natural greenhouse effect, leading to global warming.
- In addition to CO₂, methane (CH₄), nitrous oxide (N₂O), and halogenated gases (HGs) are potent greenhouse gases that contribute significantly to anthropogenic climate change. Given the current composition of the atmosphere, these gases are more effective molecule-by-molecule at trapping heat than CO₂, even though their concentrations are much smaller, making them crucial players in the climate system.
- About two-thirds of warming is attributed to CO₂, with methane and nitrous oxide contributing the remaining portion.
- Aerosols can have both warming and cooling effects on the climate. Sulfate aerosols, for example, reflect sunlight and cool the Earth, while black carbon absorbs sunlight and warms the atmosphere.
- Radiative forcing refers to the change in Earth's energy balance caused by factors like greenhouse gases and aerosols.
- Positive radiative forcing leads to warming (e.g., greenhouse gases), while negative radiative forcing leads to cooling (e.g., aerosols reflecting sunlight).
- Climate feedbacks either amplify (positive feedback) or reduce (negative feedback) the effects of initial changes in Earth's energy budget.
- Key feedbacks include water vapor feedback, cloud radiative feedbacks, and ice-albedo feedback, all of which can significantly amplify global warming.
- Urban heat islands occur when cities are warmer than their rural surroundings due to lower albedo and heat retention from buildings and pavement.
- Deforestation can raise local temperatures by reducing the amount of water available for evaporation, particularly in tropical rainforests, where trees play a key role in the hydrologic cycle.
Phew! We covered a lot of ground. Now that we've understood the science, do we actually see things like surface temperature increases and sea ice loss that we'd expect based on what we've learned? Let's find out!