Lesson 6: Modes of Natural Variability in the Climate System
Lesson 6: Modes of Natural Variability in the Climate SystemMotivate...

Imagine you’re sitting in the front row of an orchestra. The conductor raises their baton, and slowly, each section of the orchestra comes to life. The strings start with a slow, steady rhythm—like the deep currents of the ocean, moving constantly but quietly in the background. Then, the woodwinds join in with faster, lighter melodies, like winds swirling through the atmosphere. The percussion might come in with a sudden, powerful beat—like a year where it feels as though hurricane season will never end. Each instrument has its own tempo and mood, but together, they create a grand performance.
In many ways, Earth’s climate can be thought of as this orchestra. Instead of violins and trumpets, we have natural modes of variability—different parts of the Earth's symphony. You’ve likely heard of some of these climate modes: El Niño-Southern Oscillation (ENSO), the Pacific Decadal Oscillation (PDO), and the Atlantic Multidecadal Oscillation (AMO). Each one is unique. Some move quickly, like ENSO, which shifts over just a few years and brings dramatic changes to weather patterns. Others, like the PDO or AMO, operate on much slower timescales, like the deep, resonating notes of a bass, setting a broader, longer-term rhythm.
The fascinating thing is that these “instruments” don’t play in isolation. They overlap, influence each other, and sometimes create surprising harmonies—or unexpected dissonances. Just as in an orchestra, where the combination of instruments shapes the mood of the entire piece, the interaction between these climate modes can determine whether we experience mild winters, intense hurricane seasons, or extreme droughts.
By understanding the role each of these climate “instruments” plays, we can start to hear the larger symphony of Earth’s climate. Once we’re attuned to this music, we can predict when the next major shift or “note” might be coming—giving us insight into weather patterns, ecosystems, and even human activity around the globe.
So, let’s dive into this fascinating variability. Together, these forces create the melody of our planet’s climate, a performance that has been playing for millions of years. Let’s explore how these “musicians” come together to create the rhythm of the Earth’s climate system. Ready to listen in?
Phases of the ENSO cycle
Phases of the ENSO cyclePrioritize…
At the completion of this section, you should be able to:
- Describe the ENSO cycle and its phases (El Niño, La Niña, Neutral).
- Define "climate oscillation" and explain the Southern Oscillation and its connection to ENSO phases.
Read...
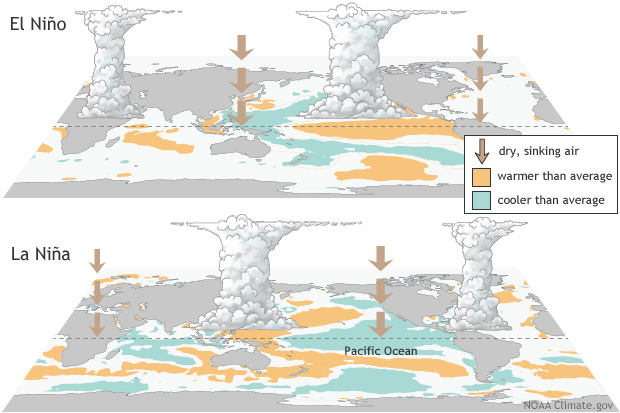
The El Niño-Southern Oscillation (ENSO) cycle is a natural pattern of climate variability centered in the equatorial Pacific Ocean. It arises from the interaction between the tropical atmosphere (like pressure, wind, and cloud patterns) and the ocean (such as sea surface temperature, coastal upwelling, and ocean currents). This interaction causes periodic shifts in sea surface temperatures (SST), air pressure, and rainfall patterns, which play out over the course of a few years. ENSO is a bit like a slow-moving pendulum—sometimes swinging toward warmer, wetter conditions and other times toward cooler, drier ones, all depending on the balance between the ocean and the atmosphere. Back-and-forth, back-and-forth...

Although ENSO is primarily a tropical phenomenon, its impacts ripple across the globe, disrupting typical weather patterns and triggering extreme events. For this reason, climate forecasters closely monitor ENSO signals to predict long-term climate trends that affect everything from agriculture to energy management.
Phases of the ENSO cycle
In the 1920s, British mathematician Sir Gilbert Walker discovered a large-scale atmospheric pressure pattern in the tropical Pacific, which he named the Southern Oscillation. In climate science, an “oscillation” refers to a recurring pattern of change over time in certain aspects of the climate system, such as temperature, pressure, or precipitation. We've already used the classical pendulum analogy climate scientists love to use, but to give another analogy, think of it as a yo-yo moving up and down – just as the yo-yo moves all the way down to the floor and then all the way back up to your hand, an oscillation in the climate system involves a back-and-forth shift between two states. These shifts can happen on various timescales, from months to decades, and can influence regional or even global climate conditions. In the case of the Southern Oscillation, it represents a seesaw-like fluctuation in atmospheric pressure between the eastern and western tropical Pacific, driving changes in wind patterns, ocean currents, and weather across the globe.
Sir Walker’s research was a game-changer because it showed that atmospheric pressure changes and shifts in sea surface temperatures across the tropical Pacific were actually linked. He explained how, every few years, the usually cool waters off the coast of South America would suddenly warm up, causing all kinds of weather disruptions around the world. This warming, known as El Niño, wasn’t just a local oddity—it was part of a larger, interconnected system. By piecing together these atmospheric and oceanic changes, Walker helped us understand what we now call the ENSO cycle, which plays a huge role in global climate patterns.
ENSO doesn’t follow a strict timetable (not unlike me!), but it generally transitions through its phases every 2 to 8 years. The cycle has three phases: the positive phase (El Niño), the negative phase (La Niña), and the neutral phase when the tropical Pacific shifts back to its climatological state. You've almost certainly heard about these in the news, but what do they actually mean from the perspective of a climate scientist?
- El Niño
El Niño, which means “The Little Boy” or “Christ Child” in Spanish, was named by Peruvian fishermen in the 1600s when they noticed that every few years around Christmas the water off the coast of South America would be much warmer than usual. This warming disrupted fish populations and fishery yield, causing the fishermen to give it a name associated with the holiday season. During an El Niño event, the central and eastern Pacific Ocean becomes unusually warm. This shift in sea surface temperature influences atmospheric circulation, leading to changes in weather patterns worldwide. For instance, El Niño can bring wetter conditions to the western United States and Peru, while causing droughts in Australia and Southeast Asia.
- El Niña
La Niña, meaning “The Little Girl” in Spanish, is the opposite phase to El Niño. During the peak of La Niña, the central and eastern Pacific Ocean experiences cooler-than-average sea surface temperatures. This cooling can lead to opposite, but equally significant, weather impacts compared to El Niño. La Niña often results in wetter conditions in Australia and Southeast Asia, while causing drier weather in the southwestern United States.
- V Southern Oscillation
The Southern Oscillation is the atmospheric oscillation that accompanies the sea surface temperature anomalies associated with the El Niño and La Niña. The Southern Oscillation is characterized by the surface pressure differences between the Darwin and Tahiti, and thus reflects the strength of the Walker circulation spanning the equatorial Pacific. The Southern Oscillation index is negative during the El Niño (i.e., the Walker Circulation weakens), while positive during the La Niña (i.e., the Walker Circulation strengthens).

Quiz Yourself...
ENSO indices
ENSO indicesPrioritize...
At the completion of this section, you should be able to:
- Define a climate index
- Identify key indices used to measure ENSO, including the Niño 3.4 index, SOI, and MEI
- Explain the Southern Oscillation Index (SOI) and its role in indicating ENSO phase changes.
Read...
OK, how do we measure these oscillations or variability in the climate system? We have to develop metrics or indices to tell us "where are we?" when it comes to ENSO, for example. Let's focus on that, although other modes of variability are tracked using similar strategies. A "climate index" is a numerical value that quantifies specific aspects of climate variability or patterns, such as temperature, pressure, or precipitation, over a defined region. It's all about taking many different things going on and boiling them down into a single number. Some of you may be interested in financial markets and have heard of the "Dow Jones Industrial Average," a stock market index. In that case, you are boiling down the stock price of multiple companies and combining them into a single number you can track over time. Climate indices serve the same purpose, helping scientists monitor and describe the current state of complex climate phenomena by providing a simplified representation of how the climate system behaves relative to its typical or average conditions.
To keep track of ENSO, we need some concrete ways to measure what's happening in the ocean and atmosphere—essentially like using a scorecard. For the ocean side of things, we have something called the Niño index, which looks at sea surface temperature anomalies (SSTAs) in specific parts of the tropical Pacific. Remember, we learned that an anomaly is how the ocean temperatures differ from their "reference" or "mean" state! So, a Niño index looks at how warm or cold ocean temperatures are relative to their usual temperature. The most popular one is the Niño 3.4 index, which averages SSTAs over a region from 5°N to 5°S and 170°W to 120°W. This index helps us figure out if the central and eastern Pacific is warmer or cooler than usual.

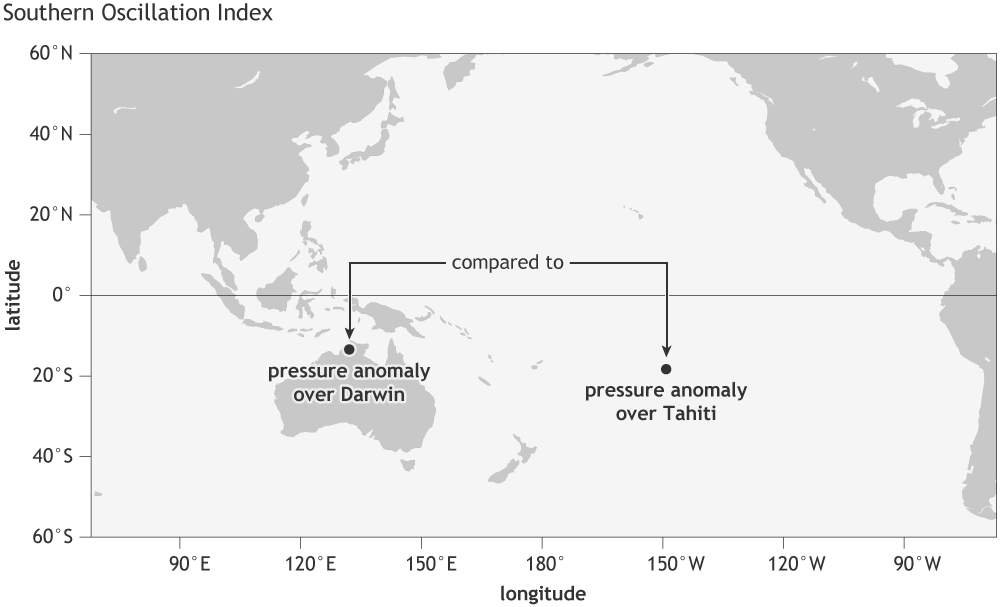
For the atmosphere, we obviously aren't measuring water temperature -- instead, we use something called the Southern Oscillation Index (SOI), which measures the difference in standardized surface pressure between Tahiti and Darwin. Protip: if someone asks you to volunteer to make in-situ measurements of the SOI, say yes! Why? Check out the below figure which shows you exactly where those pressure observations are being taken in the tropical South Pacific Ocean! When the SOI is negative, it means the air pressure in Tahiti is lower than in Darwin. This pressure difference indicates that the normal east-to-west trade winds are weakening. As a result, warm water that is usually piled up in the western Pacific starts to flow back eastward toward South America. This shift in water movement leads to warmer-than-normal sea surface temperatures in the central and eastern Pacific, a hallmark of El Niño conditions.

But sometimes, just looking at these separate indices is like trying to understand a recipe by only reading half the ingredients. To get a fuller picture, we use the Multivariate ENSO Index (MEI). All of these acronyms feel like they are the equivalent of climate alphabet soup. It combines SST, winds, sea level pressure, and outgoing longwave radiation into one handy metric. This gives us a more complete view of what’s happening with ENSO and how it’s influencing global climate patterns. So, next time you hear a forecaster mention ENSO, you’ll know they’re talking about a lot more than just some letters in a bowl!
One last thing. You might ask yourself, "Why on Earth do climate scientists have so many indices to quantify essentially the same thing?" Not an unreasonable question... As we'll learn about in the next couple of sections, ENSO is a complex system involving different aspects of both the ocean and the atmosphere. Just like hiring someone for a job, you wouldn’t assess them based on one skill alone—you’d want to look at several qualities like teamwork, communication, punctuality, and expertise. Similarly, different ENSO indices give us a fuller picture by measuring various factors, from sea surface temperatures to air pressure. Each index captures a different angle, and together they provide a better understanding of ENSO’s behavior. Plus, some indices go farther back in time, which helps compare historical events.
See the figure below, which gives us a time series of both the Nino 3.4 and SOI indices. In many cases, the red and blue match, indicating good agreement between the two. I should also mention that the colors look 'flipped' because a positive Niño 3.4 index and a negative SOI both indicate El Niño conditions, but they represent different aspects of the climate system. The Niño 3.4 index characterizes sea surface temperature anomalies, with a positive value signaling warmer-than-normal ocean temperatures. On the other hand, the SOI is a pressure difference, where a negative value indicates weaker trade winds. So, even though the signs are opposite, they both point to the same phenomenon—El Niño. But there are other places (say, 1983-1987) where the colors aren't quite the same between the two, meaning it isn't quite obvious precisely what phase of ENSO everyone agrees on. I won't get into the exact details of what led to those differences- it's beyond the scope of this class- but just know that scientists use multiple indices because no single one can tell the whole story.

Read on.
Quiz Yourself...
A Historical Perspective on ENSO mechanisms
A Historical Perspective on ENSO mechanismsPrioritize...
After this section, you should be able to:
- Describe the Bjerknes feedback loop -- including defining "thermocline" -- and how the loop plays a role in amplifying ENSO events.
- Explain how the Walker Circulation influences El Niño and La Niña conditions.
- List a few current theories about the mechanisms that return ENSO to its neutral state.
Read...
Our understanding of ENSO (remember, ENSO = El Niño-Southern Oscillation) has come a long way from the early days when fishermen and farmers simply noticed the strange, periodic changes in weather and ocean conditions. They might not have known why these changes happened, but their observations were the first step in recognizing the patterns climate scientists from all over the world now study in depth. It wasn’t until the 20th century that scientists started connecting the dots and figuring out the complicated interactions between the ocean and atmosphere that creates ENSO.
Like any good oscillating system, ENSO involves a few key steps: a small nudge to start things off in the tropical Pacific, a mechanism that amplifies this change, and then something to bring it all back to normal. Picture it like this: a little push (maybe a slight change in wind or sea surface temperature) sets off a chain reaction, causing the system to grow stronger until it hits its peak (either El Niño or La Niña), before eventually swinging back to its regular state. This buildup is driven by what’s called the Bjerknes feedback loop—named after Dr. Jacob Bjerknes, a meteorologist who first connected the dots between El Niño and the Southern Oscillation. We are probably more familiar with a traditional audio feedback loop, where turning up the volume on a speaker near a microphone creates louder and louder noise—the initial sound gets amplified until it peaks. The Bjerknes feedback loop is not too dissimilar; essentially, it’s a positive feedback loop where warmer sea surface temperatures fuel changes in the trade winds, which in turn make the ocean even warmer! It’s like a self-reinforcing cycle that builds until something comes along to reset the whole system.

Jacob Bjerknes had quite the impressive lineage—his father, Vilhelm Bjerknes, was a founding figure in modern weather forecasting, and his grandfather was a mathematician and physicist. It’s almost as if Jacob was destined to help decode the mysteries of the climate system. His early career was marked by his involvement in developing the Norwegian Cyclone Model, which, for the first time, explained how mid-latitude weather systems -- such as nor'easters -- form and evolve. But he didn't just sit with his feet up in a comfortable office... he was hands-on, joining Roald Amundsen’s historic 1926 expedition as a meteorologist when the Norge became the first airship to cross the Arctic. Later, when World War II broke out, he moved to the U.S. and took on an entirely different challenge—helping the U.S. military with meteorological planning for the atomic bombings of Hiroshima and Nagasaki. After the war, Bjerknes turned his focus to something even more unpredictable than wartime logistics: the ocean-atmosphere dance we know as ENSO. His work at UCLA laid the groundwork for understanding how warm waters in the Pacific could disrupt weather patterns globally, a breakthrough that forever changed climate science. In the context of atmospheric science, a life well lived!
Bjerknes made a crucial observation: despite being close to the equator, the eastern Pacific (off the coast of Ecuador and Peru) has surprisingly cold sea surface temperatures (SSTs). Meanwhile, the western Pacific is much warmer. This creates a sharp temperature difference, or gradient, that runs along the equator. This setup drives a large-scale atmospheric circulation called the "Walker Circulation," named by Bjerknes himself. In this system, cool, dry air from the east flows westward along the surface, then rises over the warm waters in the west, where it picks up heat and moisture. Bjerknes suspected that changes in this circulation were the spark that triggered the Southern Oscillation, setting the stage for an ENSO event.
Here’s how it works: as the surface winds push westward along the equator, they cause cold water to upwell in the eastern Pacific, keeping it cool. This cold water is fed by a combination of westward-moving ocean currents, upwelling along the equator, and the upward movement of the thermocline (the boundary layer separating warmer surface water from cooler deep water). We discussed this last section but essentially as the winds push the water offshore, cold water from down below needs to rise to keep the ocean surface (relatively) flat.
DEFINITION: A thermocline is a layer in the ocean where the temperature drops rapidly with depth, separating the warmer surface waters from the much cooler deep waters below. Think of it as a barrier—on one side, the sun heats the top layer, and on the other, the deeper water stays cold and relatively undisturbed. This sharp temperature gradient can vary depending on the season, location, and local conditions like winds or currents. In tropical regions, the thermocline is more permanent, while in polar regions it may be weak or nonexistent, as the water stays cold from top to bottom. Why is the thermocline important for climate scientists? It influences heat storage and circulation in the ocean, affecting things like the El Niño-Southern Oscillation (ENSO). By regulating how heat is distributed between the surface and deeper waters, the thermocline plays a key role in how the ocean and atmosphere communicate (i.e., exchange energy).

Bjerknes saw this interaction between ocean and atmosphere as a “chain reaction.” The more intense the Walker Circulation, the bigger the temperature difference across the Pacific. This temperature difference then makes the Walker Circulation even stronger—a positive feedback loop (we'll talk more about feedbacks later in the semester).
But this loop can also work in reverse: if the trade winds weaken, there’s less upwelling of cold water, which reduces the temperature gradient and slows down the Walker Circulation. This is why we often see El Niño conditions (warmer waters in the east) when the Southern Oscillation Index (SOI) is low, and La Niña conditions (cooler waters in the east) when the SOI is high.
Please take a minute to watch the video below from the UK Met Office.
El Niño - What is it (4:26)
El Niño - What is it
Narrator: Every few years the El Niño phenomenon kicks into life in the Pacific Ocean around the equator. It can affect weather around the world changing the odds of floods, drought, heatwaves and cold seasons for different regions even raising global temperatures. But what is El Niño and how does it happen? Firstly we need to know what's normally happening in the tropical Pacific. This vast stretch of ocean sees consistent winds called 'trade winds' that blow from east to west. These winds push warm water near the surface in their direction of travel, so the warm water piles up on the western side of the ocean around Asia and Australasia On the other side of the ocean around South and Central America as the warmer water gets pushed away from the coast it's replaced by cold water which is pulled up from deeper down in the ocean a process called upwelling. This creates a temperature difference across the tropical Pacific with warmer water piled up in the West and cooler water in the east. Warmer water adds extra heat to the air which causes the air to rise with more vigor and its this rising air that creates an area of more unsettled weather with more cloud in rainfall That rising air in the West sets up atmospheric circulation across this part of the world with warm moist air rising on one side of the Ocean and cooler dryer air descending on the other This circulation reinforces the easterly winds so this part of the world sits in a self-perpetuating state until El Niño begins. If conditions are right tropical Pacific weather systems or slow changes in the ocean around the equator can set off a chain of events which weaken or even reverse the usual trade winds With weakened trade winds there's less push of warm surface water to the western side of the ocean and less upwelling of cold water in the eastern side. This allows the usually colder parts of the ocean to warm canceling out the normal temperature difference. Because the area of warmest water moves so does the associated wet and unsettled weather. This changes rainfall patterns over the equatorial Pacific as well as the large-scale wind patterns. It's this change in winds which has a knock-on effect changing temperature and rainfall in locations around the world.
Narrator: The main impacts are around the tropics where you see an increase in the risk of floods in Peru and droughts in Indonesia, India and parts of Brazil. But virtually wherever you are in the world El Niño has the potential to affect you directly via the weather or indirectly via socio-economic impacts. There's another impact from El Niño which happens because of all the extra heat at the surface of the tropical Pacific. This releases vast amounts of energy into the atmosphere which can temporarily push up global temperatures. This is why El Niño years often feature among the warmest on record. Each El Niño event is different so the global impacts can change. You can find out more about the different impacts of El Niño on our website. El Niño peaks around Christmas-time and last for several months. It can dive back to neutral conditions but sometimes reverses into La Niña. This is the flip side of the oscillation which sees a strengthening of the normal trade winds. This pushes the warmest water to the far western part of the tropical Pacific and increases the upwelling of cold water in the east. This cooler water extends out from the coast of the Americas towards the central part of the ocean La Niña also impacts global weather and tends to have opposite effects to El Niño. You can also see more about La Niña and its impacts on our website.
However, if this positive feedback kept going unchecked, it would push the system into extreme and unrealistic states. It would just keep going and going and going and eventually we'd just have a massive ocean current that rips across the Pacific (which we don't see). So, something has to step in to bring everything back to normal—a negative feedback mechanism. The problem? Even today, scientists don’t fully agree on what that mechanism is. Some theories suggest that oceanic waves traveling across the Pacific play a key role, spreading warm or cold signals and counteracting the initial changes. Others think it’s more about how the oceans at higher latitudes respond, damping ENSO signals through wind-driven ocean circulation and subsurface ocean processes. And we can’t forget about the atmosphere and the water cycle—they might be pitching in, too.
In short, while we’ve got a solid understanding of how the ENSO system ramps up, we’re still piecing together exactly how it cools down. New observations and models are constantly improving our grasp of this complex climate phenomenon. Remember our three-legged stool from the first lecture!
Quiz Yourself...
Climatic Impacts of ENSO Events Beyond the Tropical Pacific
Climatic Impacts of ENSO Events Beyond the Tropical PacificPrioritize...
When you're finished with this page, you should be able to:
- define the term "teleconnection" and give an example of one in the climate system
- give at least two examples of how ENSO impacts weather statistics in various places around the world
Read...
The SST and atmospheric pressure patterns associated with ENSO are primarily located over the tropical Pacific. However, the climate impacts of ENSO are communicated to the extratropics through “atmospheric bridges” (or atmospheric teleconnections). Thus, the ENSO can influence weather patterns, the hydrological cycle, ecosystems, and human activities all around the globe, as illustrated in the schematic map below.
With the resultant changes in pressure distribution of the tropical Pacific, the sinking and rising of air across the tropics and extratropics changes as well. Thus, the ENSO events can significantly modulate the distribution of precipitation at various locations, contributing to the occurrence of drought and floods across the globe. For example, El Niño is often associated with heavy rainfall and flooding in the southern United States and Peru, while La Niña can lead to severe droughts in these regions. Conversely, La Niña brings heavy rain and floods to Australia and Indonesia, while El Nino causes drought and wildfire in the region. These observed changes in precipitation and the hydrological cycle consequently impact terrestrial ecosystems, wildlife, vegetation growth, and crop yield. Countries dependent on agriculture are particularly vulnerable to these changes due to ENSO.
In addition to the impacts on the terrestrial area, the changes in SST during the ENSO can disrupt marine ecosystems. During El Niño, reduced upwelling off the coast of Peru, along with the warmer water, deprives the nutrient supplies for fish, forcing them to migrate, which substantially reduces fishery productivity and causes economic loss. Coral reefs, which are sensitive to temperature changes, can also experience bleaching events during strong El Niño periods.

Let's focus a little closer to home -- while they are born in the equatorial Pacific, El Niño and La Niña can have significant impacts on weather patterns across the United States. During El Niño years, the southern states, including Texas, Florida, and Southern California, typically experience above-average rainfall, which can increase the risk of flooding and landslides. Conversely, regions such as the Pacific Northwest often face drier conditions, potentially affecting water resources and increasing the likelihood of drought. The warmer ocean temperatures associated with El Niño can also lead to milder winter conditions across the northern United States, reducing snowpack and impacting activities like skiing as well as spring water supplies.
In contrast, La Niña events tend to bring cooler, wetter conditions to the Pacific Northwest and northern Rockies, which can result in increased snowfall and more robust winter sports seasons. However, this phase is often accompanied by drier and warmer conditions across the southern tier of the country, raising the risk of drought and wildfires, particularly in states like California and the Southwest. The Midwest and Southeast may also experience heightened severe weather activity during La Niña, including more frequent tornadoes and intense thunderstorms in the spring.

Another thing affected by ENSO is hurricane activity in the North Atlantic. During El Niño years, the increased vertical wind shear and more stable atmospheric conditions tend to suppress hurricane formation, leading to fewer and weaker storms. This can be a relief for coastal communities that are vulnerable to hurricane impacts. However, during La Niña years, the opposite is true: reduced wind shear and favorable atmospheric conditions create an environment that supports more frequent and intense hurricanes. This can elevate the risk of major storms making landfall, potentially damaging infrastructure and communities along the Gulf Coast and the Eastern Seaboard. In fact, you may have heard in the media about "seasonal hurricane outlooks" in late spring or early summer -- these outlooks almost always involve scientists combining factors like ocean temperatures and ENSO state to try and predict how much to worry about the upcoming summer and fall with respect to tropical cyclones. The variability in hurricane activity linked to ENSO highlights the broader influence these ocean-atmosphere interactions have on weather-related hazards in the United States.

ENSO events in historical records
The 1997-1998 El Niño was one of the strongest on record and had a profound impact worldwide. It caused massive flooding in Peru and Ecuador, devastating droughts and wildfires in Indonesia and Australia, and a milder winter in the northern United States. The economic toll was estimated at around $35 billion globally, highlighting the immense influence of these natural phenomena.
In contrast, the 2010-2011 La Niña event led to some of the worst flooding in Australia's history. Queensland experienced unprecedented rainfall, resulting in widespread floods that affected thousands of homes, disrupted industries, and caused billions of dollars in damage.

El Niño and La Niña are powerful reminders of the dynamic and interconnected nature of our climate system. These natural phenomena have shaped human history, influenced cultures, and continue to impact our world in profound ways! By studying and understanding ENSO, scientists can improve climate predictions and help societies better prepare for the challenges posed by these natural climate variations. As we move forward, the knowledge gained from studying El Niño and La Niña will be crucial in helping us adapt to a changing climate and mitigate the impacts of extreme weather events.
Quiz Yourself...
The Pacific Decadal Oscillation (PDO)
The Pacific Decadal Oscillation (PDO)Prioritize...
When you're finished with this page, you should be able to:
- Define the Pacific Decadal Oscillation (PDO) and describe its basic properties and characteristics
- Give at least two examples of how the Pacific Decadal Oscillation (PDO) influences weather patterns and marine ecosystems, particularly along the U.S. West Coast and in the North Pacific.
Read...
While ENSO tends to get most of the attention when it comes to ocean-atmosphere interactions, there's another important player in the Pacific Ocean: the Pacific Decadal Oscillation (PDO). Unlike ENSO, which operates on shorter timescales of 2 to 7 years, the PDO unfolds over much longer periods -- with cycles lasting 20 to 30 years. That means that in a standard lifespan, a human may only observe 2-4 phases of the PDO! What makes the PDO particularly interesting is that it’s relatively new to the world of climate science. It wasn’t officially named until 1996 when fisheries scientist Steven Hare made an intriguing observation. While studying salmon populations in the North Pacific, Dr. Hare noticed something unusual: dramatic shifts in salmon production seemed to line up with changes in sea surface temperatures, particularly during major reversals in 1947 and 1977. These shifts, which corresponded to reversals in the polarity of the Pacific Decadal Oscillation, indicated a larger climate pattern at play. As cool waters gave way to warmer ones—or vice versa—the effects rippled through the ocean ecosystem, especially along the coasts from Alaska to California. Hare's work connected these changes to a long-term, recurring oscillation in sea surface temperatures, which not only influenced marine life but also impacted coastal air temperatures across the region. This discovery of the PDO shed new light on how decadal-scale climate variability could affect everything from fisheries to weather patterns along the Pacific coast.

The PDO shares some similarities with ENSO, particularly in how sea surface temperatures shift, but it operates on a much longer timescale and impacts a different region. During its positive (or warm) phase, sea surface temperatures (SSTs) in the eastern North Pacific (north of 20°N) rise, while cooler-than-average waters form in the central and western North Pacific. Check out the below figure, which is an anomaly map (our old friend!) of global sea surface temperatures. Note the curved "horseshoe" of warmer temperatures wrapping around the cooler ones that I've annotated with a black dashed line -- in climate circles the PDO is commonly described using this horseshoe shape!
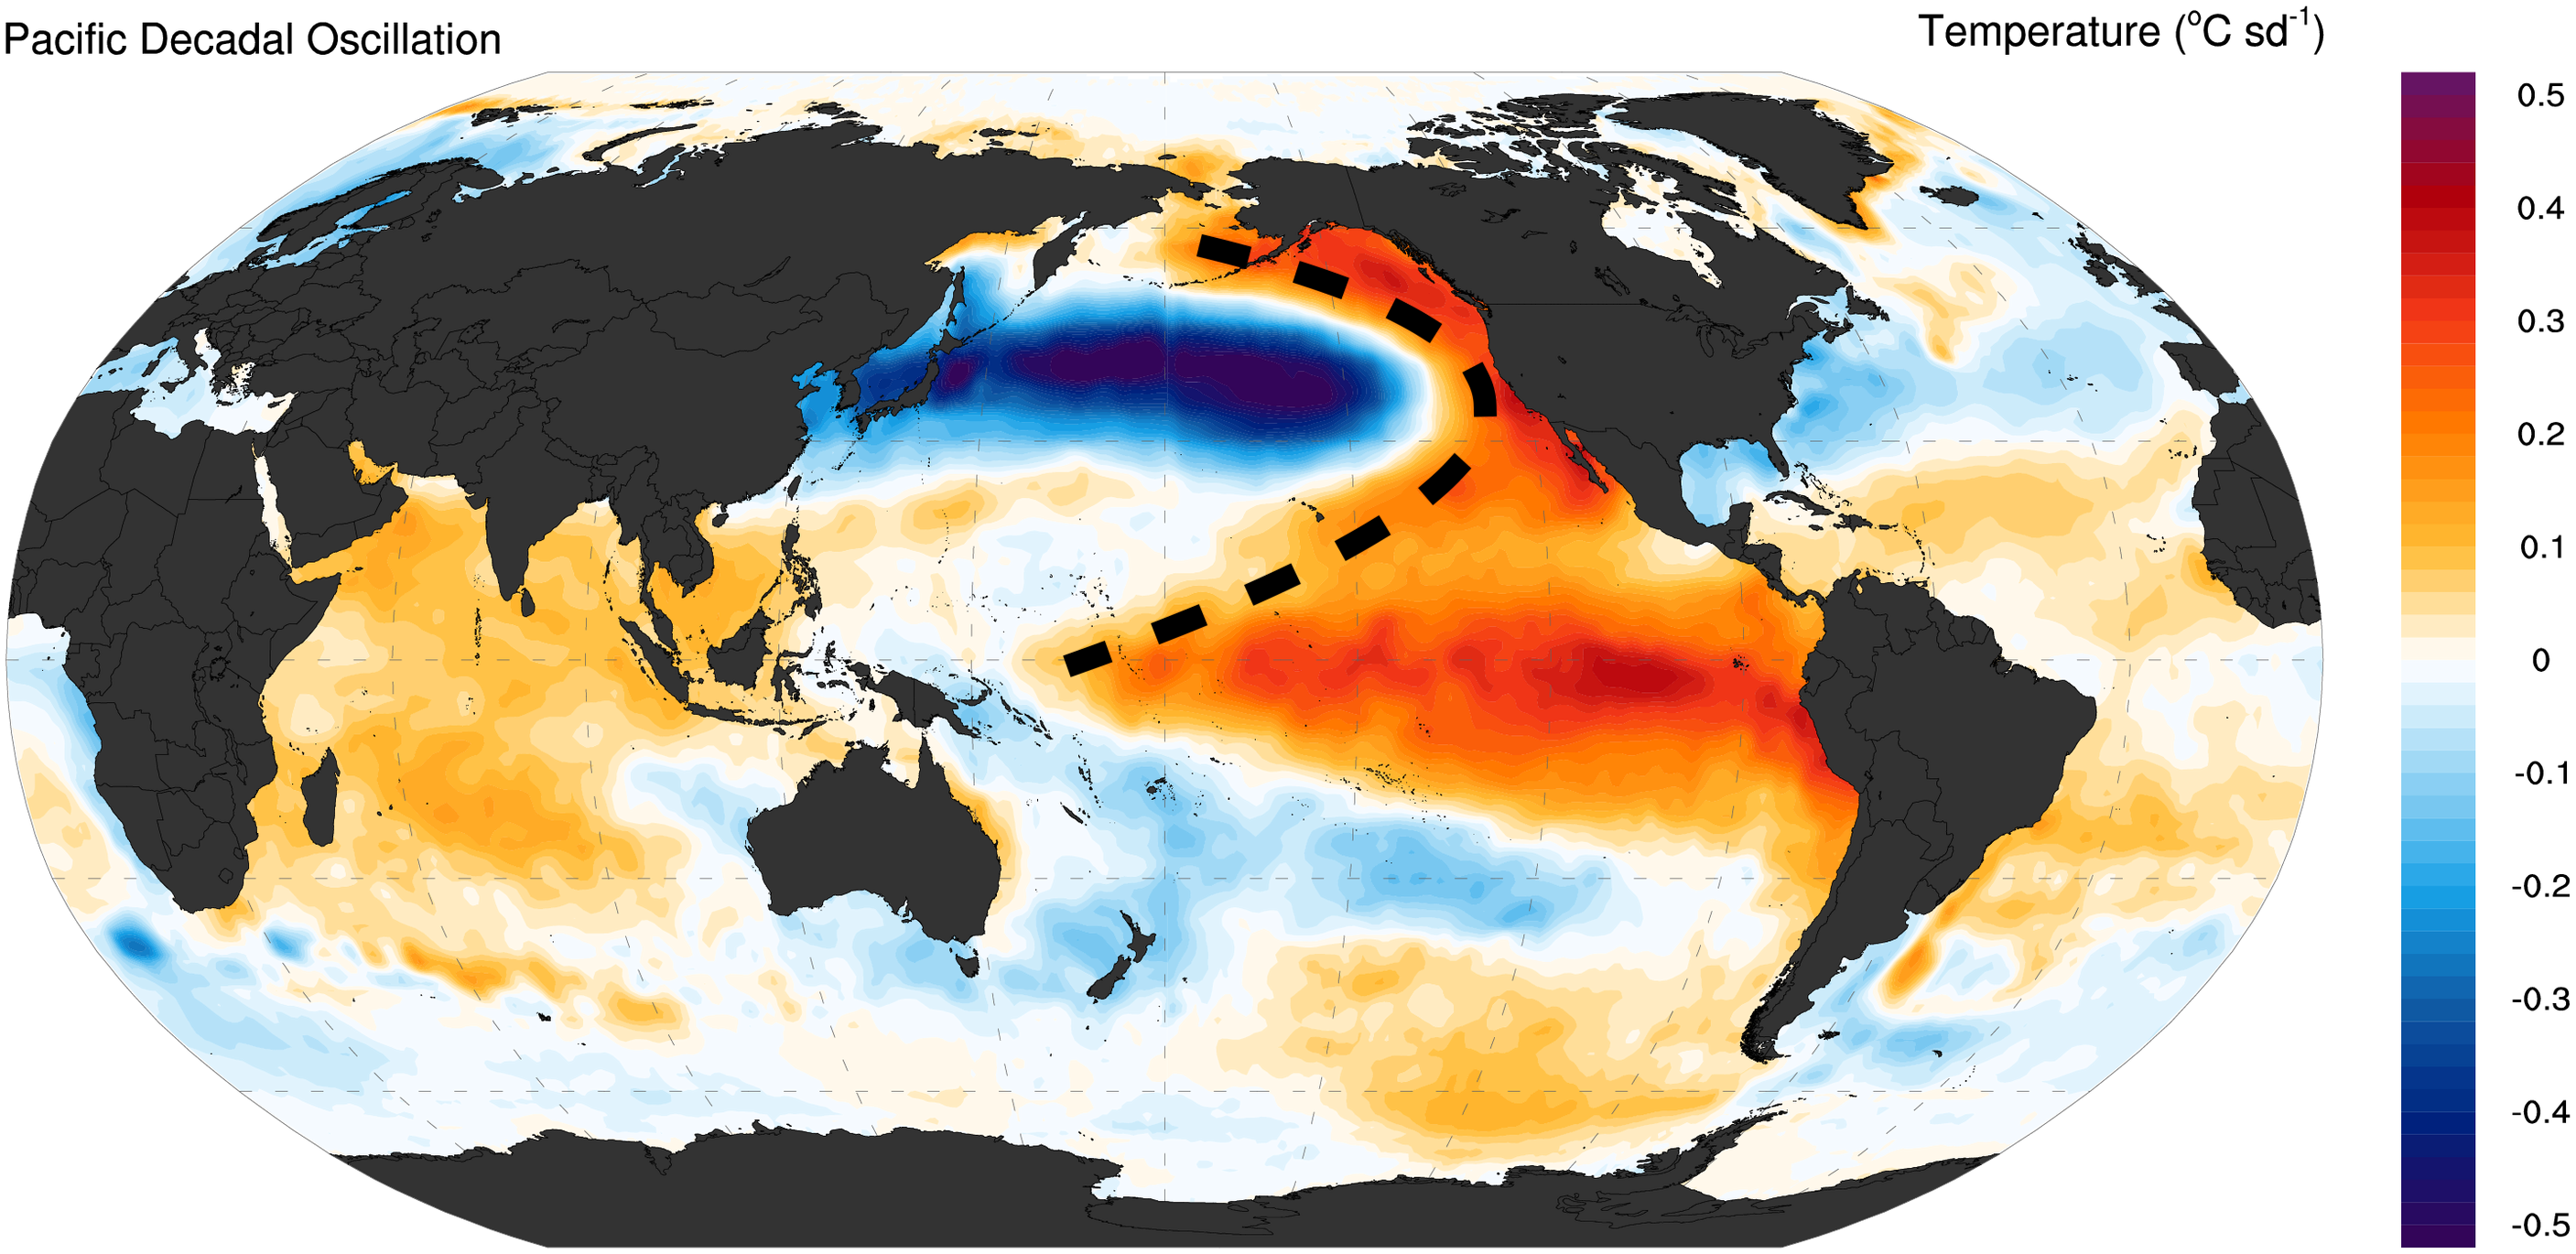
In the negative (or cold) phase, the pattern flips. Take the above figure and just mentally swap all the reds with blues and the blues with reds! Below is another graphic that shows both phases, although note the differences in the colorbar from the example above! Warm waters dominate the western Pacific, while the east (the horseshoe part) cools down. Unlike ENSO, which has its strongest influence in the tropics, the PDO mainly affects the higher latitudes in the Pacific, particularly areas north of 20°N or so. The shifts between its warm and cold phases aren’t as quick as ENSO’s, either—scientists believe that these transitions are driven by oceanic waves that take their time, roughly a decade, to propagate across the vast expanse of the North Pacific. This slower, longer-term nature of the PDO means its impacts are more drawn out, but still significant, especially for regions that rely on stable climate patterns, like the coastal ecosystems and fisheries of the Pacific Northwest.

Throughout the last century, we've seen several major PDO phase shifts. Look at the PDO time series below. For example, it moved from cold to warm around the 1920s and flipped back to cold right around the time World War II was wrapping up (mid-1940s). More recently, there was a significant shift from a cold to warm phase in 1976-77, which coincided with reductions in human-emitted pollution following the implementation of the Clean Air Act (we'll talk more about this when we talk about aerosols in a little while). Why is this noteworthy? Both the PDO phase shift and reduced aerosols contributed to warmer sea surface temperatures in the North Pacific, making it harder for scientists to separate the natural variability (what we are talking about in this lesson) of the PDO from human-induced climate changes (what we still need to discuss!) during that time.

Let's wrap up the discussion on the PDO with an important point: Can the state of the PDO actually predict anything about the atmosphere? The short answer is—it’s complicated. The PDO primarily represents an oceanic response to atmospheric changes, so we have to be cautious when attributing major shifts in atmospheric circulation directly to the PDO. That said, it can still have important local influences. Along the West Coast of the United States, for instance, a positive PDO phase, with its warmer-than-average ocean waters, often brings warmer winters and increased rainfall. On the flip side, regions like Asia and Australia might face drought conditions during these phases.
In addition to influencing weather, the PDO has notable impacts on marine ecosystems, especially fisheries. In Alaska, for example, salmon production tends to be higher during the positive (warm) phase of the PDO, which makes understanding this oscillation crucial for fishery managers and scientists alike. So, while the PDO’s direct role in atmospheric changes is limited, it plays a significant part in shaping regional climate patterns and marine life.
However, when it comes to explaining broader precipitation patterns, especially across western North America, the PDO takes a backseat to ENSO. See the maps below. They show how linked both PDO and ENSO are with precipitation anomalies in the United States. Note how the colors are "darker" for the ENSO, which shows that ENSO has a much more direct physical connection to rainfall variability. In fact, part of the reason PDO impacts can look similar to those of ENSO is because ENSO itself is a key part of the broader PDO pattern.

So, while the PDO index gives us a good sense of how various ocean and atmospheric processes are playing out in the North Pacific, it’s not necessarily the PDO itself driving weather changes. Instead, it’s the mixture of these processes that can affect weather and climate across places like the United States, with the PDO acting more as an indicator of these dynamics rather than the direct driver.
Quiz Yourself...
The Atlantic Multidecadal Oscillation (AMO)
The Atlantic Multidecadal Oscillation (AMO)Prioritize...
When you're finished with this page, you should be able to:
- define the AMO and its key characteristics and phases.
- explain the different hypotheses about what drives the AMO, including its potential links to the AMOC and external factors like aerosols and volcanic eruptions.
Read...
Let’s explore another major climate oscillation, this time in the Atlantic Ocean: the Atlantic Multidecadal Oscillation (AMO). The AMO represents a long-term pattern of sea surface temperature (SST) changes across the North Atlantic, with cycles that span 60-80 years. Like the PDO, the AMO has two phases: positive and negative. During the positive phase, SSTs across the North Atlantic—particularly in the subpolar regions near Greenland and the Labrador Sea—experience a noticeable warming. See all the red area I've circled in green in the figure below! In the negative phase, these same regions cool down -- like with the PDO, just imagine all of the colors "flipping" and you have a map of the negative phase.

Because the AMO covers such a large area and lasts for decades, it has significant impacts on both global and regional climate patterns. You can even spot the AMO’s influence in the global average temperature record. For example, during the early 1900s, a colder-than-usual period aligns with the AMO’s negative phase (below timeseries). Regionally, shifts in the AMO affect important features like the Atlantic Intertropical Convergence Zone, the North Atlantic jet stream, and the storm tracks that guide weather systems across North America and Western Europe. It also influences rainfall patterns during Africa’s monsoon season and plays a role in Atlantic hurricane activity. When the AMO is in its positive phase, the tropical Atlantic tends to be warmer, which is linked to more intense and frequent hurricanes.

The AMO index throughout the past century. The AMO index is calculated as SST anomalies averaged over the North Atlantic (northward of the equator). Red indicates the positive phase of the AMO, whereas blue represents the negative phase of the AMO.
Beyond its effects on weather and climate, the AMO also impacts marine life. Changes in ocean temperature associated with the AMO are thought to affect fish populations, such as the eel population in the Gulf of Maine, showing how far-reaching and interconnected these climate cycles can be.
Because observations of the North Atlantic Ocean have been quite limited[1], the available sea surface temperature (SST) records only capture about two full cycles of the Atlantic Multidecadal Oscillation (AMO). And even with this data, we still don’t fully understand the processes driving these temperature changes. In fact, there’s ongoing debate about the very nature of the AMO! Some scientists question whether the AMO is a true oscillation at all, or if it’s just a form of random low-frequency variability -- essentially just "static" like you'd get on an AM radio station. This uncertainty has led some to suggest using the term Atlantic Multidecadal Variability (AMV) instead, reflecting the idea that the SST changes we observe could simply be a response to factors like human-made aerosols or volcanic eruptions over the past century.
On the other hand, those who argue that the AMO is a physical oscillation often point to climate model-based results that show links between the AMO and the Atlantic Meridional Overturning Circulation (AMOC) we talked about in the last lesson. Remember, the AMOC is a vast system of ocean currents that transports heat from the equator toward the poles. When the AMOC speeds up, it carries more heat into the North Atlantic, leading to widespread warming across the basin. Since the AMOC moves slowly, its effects are felt over decadal to multidecadal timescales, aligning with the timing of the AMO phases.
However, the AMOC may not be the only factor driving the AMO. More recent research suggests that other components, like atmospheric circulation patterns (such as the North Atlantic Oscillation, which we’ll discuss next), as well as changes in the radiative properties of the atmosphere, freshwater fluxes, and even sea ice, could all play a role in shaping the AMO’s behavior.
Note [1]
It is noteworthy that the North Atlantic is already the most well sampled ocean basin. However, the observational records (back to the 1900s) of the North Atlantic, even for surface variables like SST, barely capture one or two cycles of the AMO/AMV. Without observational records, we can only infer the AMO mechanisms from numerical model simulation, which itself contains a range of sources of uncertainty. Thus, to date, the causes of AMO remain an open question without a definitive answer!
Read on.
Quiz Yourself...
Atmospheric Modes of Variability: NAO
Atmospheric Modes of Variability: NAOPrioritize...
When you're finished with this page, you should be able to:
- describe the key phases of the North Atlantic Oscillation (NAO) and their impacts on weather patterns in Europe and North America.
- explain the interactions between the NAO, ocean surface temperatures, and broader climate patterns like the AMO and AMOC.
Read...
Let's shift focus to three key atmospheric patterns that play a significant role in shaping weather and climate: the North Atlantic Oscillation (NAO), the Arctic Oscillation (AO), and the Antarctic Oscillation (also known as the Southern Annular Mode, or AAO). These oscillations represent important modes of internal variability, each with distinct impacts both locally and across the globe.
Let's start with the NAO (we'll turn to the other two soon). The NAO is particularly influential when it comes to weather patterns in Europe and North America. Meteorologists have been relying on the NAO for decades to improve the accuracy of their weather forecasts and climate predictions in these regions. These oscillations are driven by a complex interplay of atmospheric pressure systems, sea surface temperatures, and other environmental factors, illustrating the deeply interconnected nature of the Earth's climate system.
The North Atlantic Oscillation (NAO)
“Late in the 18th century, a missionary who had traveled back and forth across the Atlantic Ocean for several years noted that mild winter conditions in Greenland often coincided with severe winter conditions in Denmark, and vice versa. The severe-versus-mild phenomenon he described is now recognized as an impact of the North Atlantic Oscillation, or NAO.”
The North Atlantic Oscillation (NAO) describes the fluctuations in sea level pressure between two key pressure systems: the Icelandic Low (a low-pressure zone near Iceland) and the Azores High (a high-pressure zone near the Azores islands). When the NAO is in its positive phase, both the Icelandic Low and the Azores High intensify, which increases the pressure difference between the subtropics and mid-latitudes. Ah, but we've learned about the pressure gradient force! Recall that an increased pressure differential leads to faster winds. In contrast, during the negative phase of the NAO, this pressure contrast weakens. It's important to note that the NAO is typically more pronounced in the winter months, meaning its climatic impacts are also stronger during that season.
By influencing pressure patterns over the North Atlantic, the NAO directly affects the strength and direction of westerly winds and storm tracks, which in turn alters temperature and precipitation patterns. While its effects can be felt globally, the NAO has the most significant impact on weather and climate across the North Atlantic region and nearby continents, particularly in Europe and North America. During a positive NAO phase, stronger winds (because of the increased pressure difference and, therefore, stronger pressure gradient force!) carry warm, moist air from lower latitudes to northern Europe, resulting in warmer, wetter winters. Meanwhile, southern Europe often experiences cooler, drier conditions. On the other hand, a negative NAO phase brings colder, snowier winters to northern Europe and milder, wetter winters to the south. The eastern coast of North America is also affected, with the NAO influencing winter cold air outbreaks and snowfall. Hopefully, the schematic below will help put the pieces together. Spend a few minutes digesting it!
A striking example of the NAO's influence occurred between December 28, 2009, and January 13, 2010. An extremely negative NAO led to record-breaking cold temperatures across the Eastern US and northern Europe. Anomalous northerly winds pushed Arctic air southward into cities like Washington D.C. and even Miami. The D.C. area received a remarkable 72 inches of snow that winter, while Miami recorded a low of 36°F (2.22°C) on January 11, 2010, breaking a decades-old record. This event highlights how the NAO can drive extreme weather conditions, particularly during its negative phase!

The exact mechanisms behind the North Atlantic Oscillation (NAO) remain complex and are not yet fully understood. The most widely accepted explanation involves the interaction between the jet stream and atmospheric eddies, which drives the NAO as a largely self-sustaining mode of internal atmospheric variability. However, the NAO is far from being an isolated phenomenon. It actively interacts with the ocean, creating a dynamic relationship between the atmosphere and the sea surface.
For instance, shifts in the NAO phase leave a noticeable impact on ocean surface temperatures, which in turn can influence future NAO pressure patterns by altering the temperature gradient* of the North Atlantic Ocean. Beyond its shorter-term variability, the NAO also exhibits changes over decadal to multidecadal timescales. This longer-term variation is thought to be linked to broader climate patterns like the Atlantic Multidecadal Oscillation (AMO) and the Atlantic Meridional Overturning Circulation (AMOC), suggesting that the NAO is part of a much larger system of interconnected climate processes.
Semi fun-fact:
In the mid-latitudes, temperature differences — both horizontally and vertically — between different air masses are tied to something called baroclinicity. This term refers to how temperature changes in space, and it plays a big role in driving storms and winds. So, when we mention temperature gradients, we're also talking about the forces that help fuel much of our weather!
Quiz Yourself...
Atmospheric Modes of Variability: AO and AAO
Atmospheric Modes of Variability: AO and AAOPrioritize...
When you're finished with this page, you should be able to:
- describe the positive and negative phases of the Arctic Oscillation (AO) and their impacts on temperature, precipitation, and winter weather patterns in the Northern Hemisphere.
- explain how various factors, such as Arctic sea ice, snow cover, and volcanic eruptions, contribute to shifts in the Arctic Oscillation (AO) phases.
- describe the positive and negative phases of the Antarctic Oscillation (AAO) and their influence on temperature, westerly winds, and rainfall patterns across the Southern Hemisphere.
Read...
The Arctic Oscillation (AO)
Let’s discuss the Arctic Oscillation (AO), a key climate pattern that involves shifts in pressure between the Arctic and the mid-latitudes, particularly over the North Pacific and North Atlantic. These pressure differences influence how Arctic air moves across the Northern Hemisphere. The AO has two main phases—positive and negative—and each brings its own kind of weather.
When the AO is in its positive phase, surface pressure in the Arctic drops lower than usual, while pressure in the mid-latitudes rises. This setup strengthens the polar vortex, a large, persistent area of low-pressure and cold air that circulates around the polar regions, acting as a barrier that keeps colder air trapped near the poles. With a strengthened vortex, a positive AO effectively locks in that Arctic air. The result? The jet stream, which is like a fast-moving river of air high above us, stays further to the north, keeping colder temperatures confined to the Arctic. For those of us living in the mid-latitudes, this means milder winters, as the cold air doesn’t push as far south.
On the other hand, when the AO switches to its negative phase, things flip around. The pressure differences weaken the polar vortex, allowing it to wobble and send that cold Arctic air further south. As the jet stream dips down into the mid-latitudes, areas that might normally enjoy milder winters can suddenly get hit with frigid Arctic air, leading to much colder and stormier conditions. This phase is often associated with harsher winters in places like the eastern United States and Europe, thanks to those southward surges of cold air.
“Consequently, locations in the mid-latitudes are more likely to experience outbreaks of frigid, polar air during winters when the AO is negative.”
The Arctic Oscillation (AO) doesn't just influence temperature—it also affects where and how much it rains or snows. When the AO is in its positive phase, Northern Europe typically experiences wetter conditions, while Southern Europe and areas around the Mediterranean tend to dry out. But when the AO flips to its negative phase, these patterns can reverse, bringing more rain to Southern Europe and drier weather up north.
What drives the AO's shifts? A mix of internal and external factors plays a role. Changes in Arctic sea ice and snow cover, variations in solar radiation, and even volcanic eruptions can all influence how the AO behaves. These factors can interact with the atmosphere, nudging the AO into its positive or negative phase and shaping weather patterns across the Northern Hemisphere.

Antarctic Oscillation (AAO)
In the Southern Hemisphere, there's a similar climate pattern to the Arctic Oscillation (AO), called the Antarctic Oscillation (AAO). Scientists also refer to this as the Southern Annular Mode (SAM) -- it's fine if you want to use them interchangeably. Maybe researchers were just tired of having all the “AO”s and wanted an easier acronym to remember!
Unlike its northern counterpart, the AAO is less interrupted by landmasses, making it more zonal, or west-to-east, in nature. Because of this, the AAO has a stronger influence on the position of the westerly winds that circulate around Antarctica. These winds shift north and south depending on whether the AAO is in its positive or negative phase, representing a change in atmospheric mass between the mid-latitudes and the Antarctic region.
The AAO also impacts weather patterns across the Southern Hemisphere. In its positive phase, the westerly winds strengthen and move closer to Antarctica, keeping the mid-latitudes cooler and making conditions warmer over Antarctica. In the negative phase, the winds weaken and shift northward, leading to warmer temperatures in the mid-latitudes and cooler ones in Antarctica. These shifts in the AAO also influence rainfall patterns. A positive phase typically brings drier weather to parts of Australia, New Zealand, and South America, while the negative phase tends to increase rainfall in those regions.

The AAO is primarily driven by differences in atmospheric pressure between the mid-latitudes and Antarctica. The strength of this oscillation is closely tied to variations in the temperature gradient across the Southern Ocean, particularly changes in sea surface temperatures (SST). As sea ice around Antarctica expands or contracts, it can shift the dynamics of the AAO. Additionally, the state of the ozone hole—its formation and recovery—also plays a role in influencing the strength and behavior of this pattern, further affecting the weather and climate across the Southern Hemisphere.
Quiz Yourself...
Summary
SummaryRead...
- Climate modes of variability are recurring patterns that influence weather and climate over various timeframes, ranging from years to decades. Understanding these modes is essential to understanding how Earth’s climate fluctuates naturally.
- El Niño-Southern Oscillation (ENSO) is a key climate mode that shifts between El Niño (warmer waters in the eastern Pacific) and La Niña (cooler waters). ENSO impacts weather patterns globally, from rainfall in the United States to droughts in Australia and Indonesia.
- The Pacific Decadal Oscillation (PDO) operates on a longer timescale, typically 20-30 years. The PDO influences temperatures and weather patterns, particularly along the U.S. West Coast, and can affect marine ecosystems like salmon populations.
- The Atlantic Multidecadal Oscillation (AMO) impacts sea surface temperatures in the North Atlantic, with cycles lasting 60-80 years. It plays a significant role in Atlantic hurricane activity and weather patterns in North America and Europe.
- These climate modes don’t act in isolation; they overlap and interact, creating complex effects on global and regional weather. For example, ENSO and PDO can influence precipitation in North America, and their interaction can either amplify or dampen weather extremes.
- The North Atlantic Oscillation (NAO) and the Arctic Oscillation (AO) are atmospheric patterns that drive variations in winter weather across Europe and North America.
- The NAO’s positive phase brings mild, wetter winters to northern Europe and drier conditions to southern Europe. A negative phase has the opposite effect.
- The AO’s positive phase locks cold air in the Arctic, while its negative phase allows cold Arctic air to spill into the mid-latitudes, leading to colder winters.
- In the Southern Hemisphere, the Antarctic Oscillation (AAO) shifts westerly winds around Antarctica. The positive phase brings cooler conditions to the mid-latitudes, while the negative phase moves warmer air northward.
- By understanding these modes of variability, we gain insight into how Earth’s climate system behaves over time, helping scientists make better long-term climate predictions.