In-situ Measurements of the Ocean
In-situ Measurements of the OceanPrioritize...
When you’ve finished this page, you should:
- Be able to describe how and where we currently take in-situ measurements of the ocean for climate purposes
- Be able to define what gaps exist and where our “blind spots” are with respect to ocean observations.
Read...
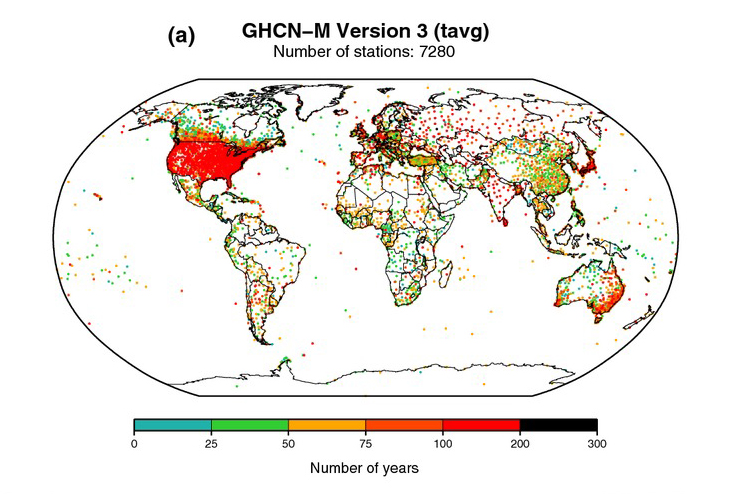
We’ll see later that the ocean is a key component of the climate system, particularly on longer timescales. But in the last section, we noted that most of our in-situ measurements of the climate system are taken on the land surface. In fact, see the below figure, which shows where each of the 7280 stations that go into the Global Historical Climatology Network dataset is located. We see a ton of red dots over the United States, Europe, Japan, and parts of Australia, indicating dense, long-term records. We see a growing network elsewhere around the world, but predominantly focused on land. Many fewer points are out over the ocean – these may be small islands, ships, oil rigs, or other buoys, but since humans don’t generally live in the water, observations there are far trickier!
So how do we measure ocean properties from an in-situ perspective? While we have some measurements of surface ocean temperature from ships (throw a bucket overboard, pull up some water, take the temperature!), a larger view of ocean variables didn’t come until the widespread use of buoys, which occurred during the middle of the 20th century. Surface weather buoys (either anchored or drifting) are primarily used to help with weather forecasting but can also aid during emergency responses to chemical spills, provide engineering baselines for wind farms, and other cool applications. But while not designed for climate modeling, we can take advantage of this network and use their observations in our dataset as well. There are a few problems with relying on this buoy network. The first, and perhaps the most obvious, is that they do not have nearly the same spatial coverage that measurements taken on land have. Below is a snapshot of buoys cataloged by NOAA’s National Data Buoy Center on a given day. Look at all those gaps!

For the record, the buoys (or oil-drilling platforms) marked with yellow dots are stations that have recorded data recently. Meanwhile, stations marked by red dots are still considered active but hadn't reported data in at least eight hours at the time this image was produced. Orange dots represent buoys that used to exist but are no longer active. For example, the rightmost buoy on the plot -- the one in the Red Sea -- was maintained by the King Abdullah University of Science and Technology, which shared its data with NOAA. However, those reports stopped in 2010. While the coastline of the United States and the central Gulf of Mexico are well sampled by buoys and observations from oil-drilling platforms, farther out over remote ocean waters, a tropical cyclone finding a buoy is akin to finding a needle in a haystack. The buoys over the Atlantic and other oceans around the world are widely spaced, leaving huge gaps between buoy observations.
The second challenge is that they tend to measure basic surface variables of the ocean, such as sea surface temperature. This only gives us a small glimpse.
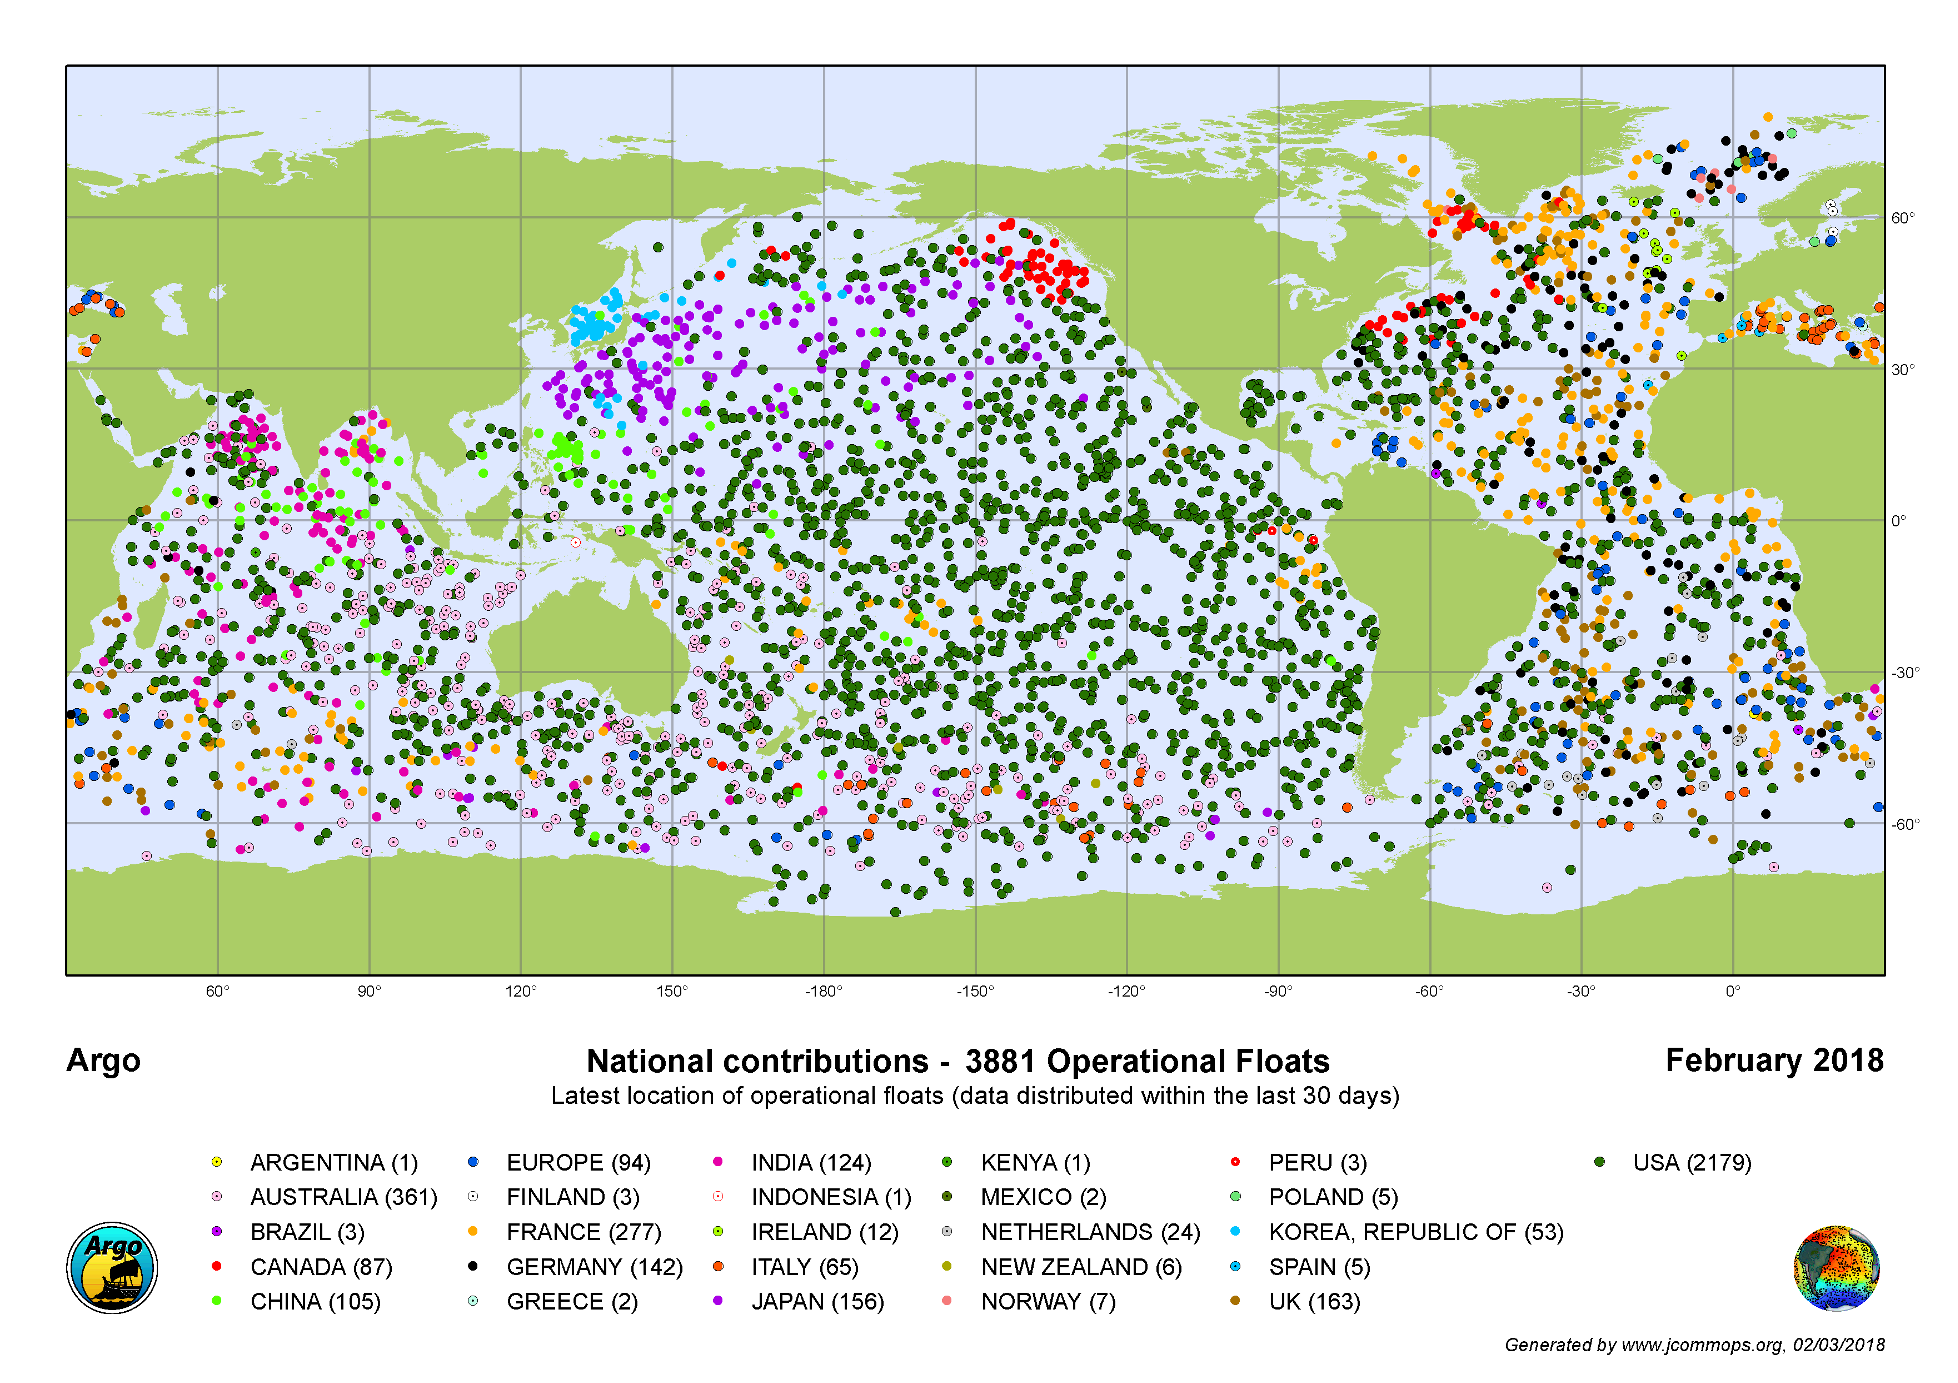
There are efforts to address these gaps. Perhaps the most notable is Argo, an international program that uses profiling floats to observe temperature, salinity, and currents. The unique feature of Argo floats is that they move up and down in the ocean according to a set schedule. To do this, the floats adjust their density by altering their volume by pushing out mineral oil and expanding a rubber bladder at its lower end. This expansion makes the float less dense than the surrounding seawater, causing it to rise. At the surface, they transmit all the measurements they have taken over the past ten or so days at depths as deep as 2,000 m. After reporting, the float contracts the bladder, reducing its volume and increasing its density, which allows it to descend back into the depths.
Currently, there are roughly 4,000 floats producing 100,000+ temperature/salinity profiles per year. This may seem like a lot but check out the picture below – there remain large gaps in ocean observations that can be as wide as the distance from Miami to New York City. Further, many portions of the ocean are far deeper than 2000m. New technology allows a small subset of these floats to go down to 6000m depth, which is still only approximately half as deep as the deepest part of the ocean (the Challenger Deep). Clearly, there is still a great deal of room for improvement in our in-situ ocean observing network!