Lesson 2 Images
Lesson 2: Remote and In-Situ Observations in the Tropics
Conventional radar (0:07)
Text description of the Conventional radar animation (0:07)
The animation depicts a simplified illustration of a radar system in operation. In the foreground, on the left, there is a radar tower with a dome-shaped antenna on top, positioned on a small structure with a brown roof and white walls. The radar is set against a clear, gradient blue sky transitioning to purple near the horizon. A green, grassy terrain lies at the bottom of the image. Gray beams extend from the radar towards large, cartoon-like white clouds on the right side of the image, illustrating radar pulses. The clouds have a fluffy appearance with varying shades of gray to suggest depth.
Transcribed Text:
A radar sends out a very short pulse of energy (actually about 5000 per second). This pulse of energy travels away from the radar at the speed of light, expanding and gaining elevation as it goes. When the energy encounters particles in the atmosphere, some of that energy is scattered back towards the radar. The radar collects this "back-scattered" energy and processes it into an image.
Tropical Ocean Buoys
a large part of the tropics

Text description of the a large part of the tropics image.
The image is a world map showing continents and major bodies of water. The map uses a cylindrical projection, with latitude and longitude lines marked. The continents are depicted in a uniform tan color, while the oceans are a solid blue. The map spans the entire longitudinal extent of the earth and from -45 to 45 degrees latitude. Various lines of latitude and longitude are labeled at regular intervals with black dotted lines crossing the map.
plot of sustained wind speeds
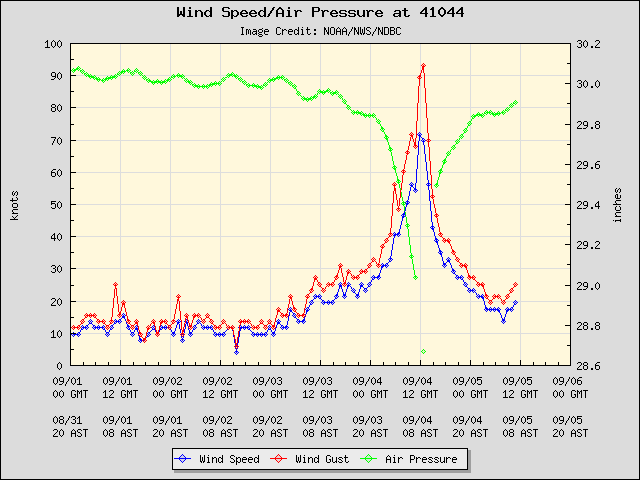
Text description of the plot of sustained wind speeds image.
The image is a graph showing wind speed, wind gusts, and air pressure over a period from August 31 to September 5. The x-axis represents the date and time in GMT and AST formats, while the left y-axis measures wind speed in knots ranging from 0 to 100. The right y-axis measures air pressure in inches from 28.6 to 30.2. Wind speed is depicted with a blue line, wind gusts with a red line, and air pressure with a green line. The graph shows a rapid increase in wind speed and gusts and a rapid decrease in air pressure as, most likely, the center of a hurricane passes close by the buoy.
12Z station model from Buoy 41044

Text description of the 12Z station model from Buoy 4104 image.
The image is a weather map focused on the Atlantic Ocean, displaying data related to Tropical Cyclone Katia. Several station plots and buoys are marked and show wind, temperature, pressure, and dew point information. The center of attention is a red circle near latitude 22.3 and longitude -59.6, which indicates the approximate 12Z center of Katia. An arrow points toward this circle with a note saying, "Red circle roughly marks the 12Z center of Katia." The stations are marked in red, blue, and black with varying data entries. In the top right corner, there's a small world map highlighting the region covered by the main map. The background grid is marked with latitudinal and longitudinal lines, specifically spanning from 15N to 29N and 67W to 57W.
16 drifting buoys

Text description of the 16 drifting buoys image.
The image is a satellite view depicting Hurricane Fabian on September 4, 2003. The image is marked with light blue grid lines indicating latitude and longitude, with labels for 30 N, 20 N, 70 W, and 60 W. Near the center, several small red squares indicate deployment locations of floating buoyus, with two drifters per location. The outlines of Caribbean islands, including Puerto Rico, are visible near the bottom left of the image, set against a dark background.
sample summary plot

Text description of the sample summary plotimage.
The image consists of three main sections of graphs displaying data titled "Five Day Data" The top graph depicts wind vectors, with speed in meters per second along a vertical axis marked from -8 to 8, showing red lines with fluctuations over time. The middle graph represents "Dynamic Height (0/500 dbar)" with a scale in cm ranging from approximately 120 to 150, exhibiting a blue line with varying peaks and troughs. The bottom graph illustrates temperature in degrees Celsius, with a color-coded contour map displaying temperature variations at different ocean depths from 0 to 300 meters over the period from January - May 2026. Temperature ranges from 8°C to 32°C, transitioning from dark blue at the bottom to purple at the top. The graphs' horizontal axis uses months abbreviations, starting from January to May.
surface data

Text description of the surface data image.
The image is a line graph depicting sea surface air pressure measured in millibars (mB) over time. The y-axis ranges from 940 to 1030 mB, while the x-axis indicates the time frame from August 31 to September 14. Several colored lines represent different datasets corresponding to individual identifiers. These lines display a sharp dip around September 7, indicating a significant decrease in air pressure, followed by a rapid recovery to higher pressure around 1012 mB with slight fluctuations thereafter. A legend on the right side associates each colored line with specific identifiers.
sample summary plot

Text description of the sample summary plot image.
The image consists of three main sections of graphs displaying data titled "5S 155W Five-Day Temperature and Wind Data." The top graph depicts wind speed in meters per second along a horizontal axis marked from -8 to 8, showing red lines with fluctuations over time. The middle graph represents "Dynamic Height (0/500 dbar)" with a scale in dyn. cm ranging from approximately 120 to 140, exhibiting a red line with varying peaks and troughs. The bottom graph illustrates temperature in degrees Celsius, with a color-coded contour map displaying temperature variations at different ocean depths from 0 to 300 meters over the years 2002 to 2003. Temperature ranges from 8°C to 32°C, transitioning from dark blue at the bottom to purple at the top. The graphs' horizontal axis uses months abbreviations, starting from December 2001 to December 2003.
complete report

Text description of the complete report image.
The image is a weather map showing the path and data of tropical cyclone Lupit to the east of the Phillipines. The main section features a grid with latitudinal and longitudinal markers ranging from 5N to 19N and 130E to 144E. Station models and buoys provide wind, temperature, dew point, and presure information. A distinct red typhoon symbol marks the center of Typhoon Lupit. Inset in the top right is a small world map highlighting the affected region.
Air Force Hurricane Hunters
template for the upper-air station model

Text description of the template for the upper-air station model image.
The image displays a diagram commonly used in meteorological station models, illustrating various atmospheric parameters. In the center, there is a black square with a line extending to the left. This line has several flags indicating wind speed and direction. To the left of the square, the number "-45" is written, representing the air temperature in degrees Celsius. Above this, a red-bordered box with text provides the explanation. On the right of the square, the number "330" appears alongside a blue-bordered box, indicating aircraft altitude in hundreds of feet. Below the square, a green-bordered box contains text that explains the convention for representing wind speed and direction.
alpha pattern (0:09)
Text description of the alpha pattern animation (0:09)
The animation is a satellite view of a large hurricane. The cyclone shows a well-defined, circular eye in the center, surrounded by swirling clouds. The clouds form a tight spiral, with bands extending outward in a counterclockwise direction. The shades of the clouds range from bright white at the core to darker grays as they extend outward, indicating varying thickness and density. In the top left quadrant, near the outer edge of the hurricane, a small aircraft is visible, flying over the cloud tops, providing a sense of scale. The background is a dark expanse, likely the ocean, contrasting with the bright, turbulent clouds of the hurricane.
flight-track map

Text description of the flight-track map image.
The image is a detailed map illustrating the flight track of a synoptic level reconnaissance flight for Hurricane Dorian in 2019. The map covers portions of the Gulf of Mexico and the Atlantic Ocean with latitudinal markings from 20 to 35 degrees North and longitudinal markings from 70 to 90 degrees West. A white line traces the flight path, annotated with numbered points that represent dropsonde observation locations. The center of Dorian is located with a red dot.
altitude is measured by radar (0:09)
Text description of the altitude is measured by radar animation (0:09)
The animation depicts a scene with an aircraft flying over the ocean. The background is a clear, gradient blue sky with two clouds visible. Below, the sea is represented with a subtle wave pattern. To the left, there's a rectangular text box with a white background and a black border, containing an explanation of how a radar altimeter functions. The aircraft is white with a black nose and appears to be propeller-driven. A red line and a red dot illustrate the path of a radar altimeter pulse traveling from the aircraft to the ocean surface below and back.
Decoding a Vortex Data Message
No images
NOAA Hurricane Hunters
Miss Piggy

Text description of the Miss Piggy image.
The image is a colorful illustration featuring a character depicted as a pig dressed as an aviator. She wears a leather jacket, flight goggles on her head, and a blue scarf blowing in the wind. The character is sitting on a stylized airplane with a cheerful pose. Above the character, the title reads “NOAA Aircraft Operations Center N43RF.” The illustration includes flowing ribbons with the words “Aero-Pigutica... But Nice!” Below, there is a decorative signature reading “Miss Piggy” in pink.
Kermit

Text description of the Kermit image.
The image is a colorful illustration featuring a cartoon frog dressed in aviator gear. The frog is bright green and is depicted in mid-jump, with its mouth open in a cheerful expression. It is wearing a yellow scarf, brown shoes, and a white aviator helmet with goggles. A swirling pattern of clouds appears beneath it, suggesting motion. Surrounding the frog, there is stylized text. The background is a light cream color.
synoptic-surveillance flight plan

Text description of the synoptic-surveillance flight plan image.
The image is a detailed map illustrating the flight track of a synoptic level reconnaissance flight for Hurricane Isabel in 2003. The map covers portions of the Gulf of Mexico and the Atlantic Ocean with latitudinal markings from 20 to 40 degrees and longitudinal markings from -85 to -65 degrees. A green line traces the flight path, annotated with numbered points that represent dropsonde locations. The center of Isabel is located with a red hurricane marker. Red, blue, and other colored circles mark different types of data points such as "Regular," "12Z-only," and "00Z-only," among others. A legend in the upper left corner explains the symbols used, with different colors and shapes identifying the storm location, flight track, dropwindsonde, and data frequency specifics. The map has labeled latitude on the y-axis and longitude on the x-axis, and the main title reads "030916N1 ISABEL."
winds detected by Hurricane-Hunter Doppler radar

Text description of the winds detected by Hurricane-Hunter Doppler radar image.
The image is a reconnaissance plane swath data representation showing wind speed and direction for Hurricane Sandy on October 28, 2012. It is a circular plot centered around longitude 71.5W and latitude 34N, depicting wind patterns at 0.5 km above the surface in meters per second. Wind speeds generally increase toward the center of the hurricane, except for the eye, and rotate counter clockwise. Arrows scattered across the plot indicate wind direction, and small numbers next to these arrows provide exact speed measurements in meters per second. Along the perimeter, labels mark longitude and latitude.
relatively close to land

Text description of the relatively close to land image.
The image is a radar coverage map for the East Coast of the United States. It features a series of overlapping red circles, each centered on a black dot, which represent the areas covered by individual radar stations. The circles blanket the entirety of the eastern United States, extending from the northeastern states down to the Gulf Coast. The borders of the states are outlined in black, providing a clear view of the geographic areas covered.
visible satellite image

Text description of the visible satellite image.
The image is a satellite view of a large hurricane over the Atlantic Ocean, off the east coast of the United States. To the left, the dark green landmass of the southeastern United States is clearly visible, including Florida and the Carolinas. The white clouds of the hurricane dominate the right side of the image. The ocean around the storm appears deep blue, contrasting with the bright white of the clouds. The Bahamas can be seen near the bottom of the image with vivid turquoise waters surrounding the islands.
H*Wind analysis at 0130Z on September 14, 2003

Text description of the H*Wind analysis at 0130Z on September 14, 2003 image.
The image is a contour map depicting the structure of Hurricane Isabel on 14 Sep 2003 at 0130 UTC. The map uses color gradients to represent wind speeds, with warm colors at the center indicating higher speeds. The innermost area is black, transitioning outward to dark red, violet, blue, light blue, and finally green and dark blue. The contour lines, marked with wind speed values, are largely concentric circles tightly packed around the center. In the top left corner, a legend lists wind radii for different quadrants.
mounted on reconnaissance aircraft

Text description of the mounted on reconnaissance aircraft image.
The image shows a close-up view of an aircraft's wing, specifically focusing on a sensor attached underneath. The wing is an off-white color, with visible panel lines and rivets. The sensor is rectangular with rounded edges and is mounted beneath the wing, extending downward. It has a rectangular light or sensor panel facing downward. The internal structure of the wing is visible where panels are open, revealing support beams and mechanisms. In the background, the tail section of the aircraft is partially visible, displaying a USA flag and markings. The sky appears clear and blue.
back-scatter

Text description of the back-scatter image.
The image is an illustration depicting the interaction of radiation with a medium. A maroon arrow labeled "Incident Radiation" points from the left side towards the center of the image, entering a vertical, translucent blue column. A smaller black dot marks a "Scattering Event." From this point, three arrows extend in different directions: "Back-scattering" is directed backwards to the left, "Transmission" proceeds forward to the right, and a faded, shorter arrow labeled "Absorption" points downward. Each arrow is maroon, with the labels appearing in black text. The background outside the medium is white.
The Dvorak Technique
water-vapor image

Text description of the water-vapor image.
The image is a satellite view of the Earth focusing on the Americas, displaying water vapor content. North and South America are prominently visible. The landmasses are outlined in blue, providing a clear demarcation from the surrounding oceans. A strong hurricane can be seen on the water vapor imagery in between the west African coast and lesser Antillies. The blue outlines contrast against the grayscale, aiding in the identification of geographical regions. The image has a timestamp and labels at the top and bottom.
Melissa on enhanced infrared imagery

Text description of the Melissa on enhanced infrared imagery image.
The image is a satellite infrared view of Hurricane Melissa near its peak intensity. The clear eye is surrounding by a thick yellow ring, marking cloud top temperatures approaching 180 Kelvin, or -93 degrees Celsius. Outer areas transition into red, green, blue, and finally gray clouds, representing increasing temperatures.
enhanced infrared image of a super typhoon

Text description of the enhanced infrared image of a super typhoon image.
The image is a satellite infrared view of super typhoon Haiyan on approach to the Philippines. The clear eye is surrounding by a thick dark grey ring and one prominent outer band on the western side of the storm. The outer areas transition into yellow, then blue, and finally gray clouds, representing varying intensities. These colors highlight infrared temperature differences, with red and orange indicating warmer, denser clouds, and blue and gray showing cooler, higher altitudes. A NOAA logo appears in the bottom left corner, signifying the organization responsible for the satellite view.
curved-band pattern

Text description of the curved-band pattern image.
The image is an infrared satellite view of a tropical storm with a curved-band cloud pattern, taken from a polar orbiting satellite. A dark swath on the left side of the image marks the area outside of the satellite's view. Bright white cloud tops curve around a center point, almost forming a closed loop, characteristic of a strong tropical storm. The curved band of clouds is annotated with a blue curve and labeled.
satellite image

Text description of the satellite image.
The image depicts a satellite view of a weather system labeled as "Tropical Storm Nicholas." The storm has a circular structure with a bright white, textured center indicating deep convection, surrounded by swirling bands of clouds in varied shades of blue and yellow. The "Center of Circulation," noted in yellow text, removed from the main region of clouds and storms.
satellite image of a sheared tropical storm

Text description of the satellite image of a sheared tropical cyclone image.
The image shows a visible satellite image of a highly sheared tropical cyclone. The low-level circulation of the storm, indicated by a swirl of clouds, is marked with an arrow. The storm's area of bright, white, tall thunderstorm clouds is displaced south of of the center of circulation, and is also labeled with an arrow.
satellite image showing a CDO pattern

Text description of the satellite image showing a CDO pattern image.
The image is an enhanced infrared satellite image of a tropical storm on the verge of being upgrade to a hurricane. This particular storm demonstrated a Central Dense Overcast (CDO) pattern, which a canopy of thick cirrus clouds with cold tops, marked in green, yellow, orange, and red shading, that consolidated around the center of the storm, and is circled on the image.
alex satellite image

Text description of the satellite image.
The image is a satellite view showing a tropical system just off the coast of northeastern Florida. The states of Georgia, South Carolina, and parts of Florida, Alabama, and North Carolina are visible and outlined in bright green. The central feature is a dense, circular mass of clouds labeled "CDO" in yellow text. The land is marked with variations of dark to light green, indicating different terrains, and the ocean is depicted in dark colors with white cloud streaks.
eye emerged on infrared imagery

Text description of the eye emerged on infrared imagery image.
The image is an enhanced infrared satellite image of a hurricane with an emerging eye, which is labeled with an arrow. Surrounding the warm eye is a thick ring of cold cloud tops, shaded in red, indicating temperature less than -60 degrees Celsius. Other splotches and bands of high, cold cloud tops exist farther away from the center of the storm.
enhanced infrared image of Hurricane Emily

Text description of the enhanced infrared image of Hurricane Emily image.
The image is a false-color infrared satellite image of hurricane Emily over the Gulf of Mexico, captured on July 17, 2005. The main central dense overcast region of the hurricane is bright white and grey on infrared imagery with the outer bands in reds and pinks. These bands are encircled by patches of green and blue, denoting less intense cloud coverage. The surrounding ocean is depicted in dark blue, contrasting with the bright colors of the storm. The image includes grid lines and coordinates overlaid on the satellite view for reference.
enhanced infrared image of a super typhoon
Text description of the case of enhanced infrared image of a super typhoon image.
The image is a satellite infrared view of super typhoon Haiyan on approach to the Philippines. The clear eye is surrounding by a thick dark grey ring and one prominent outer band on the western side of the storm. The outer areas transition into yellow, then blue, and finally gray clouds, representing varying intensities. These colors highlight infrared temperature differences, with red and orange indicating warmer, denser clouds, and blue and gray showing cooler, higher altitudes. A NOAA logo appears in the bottom left corner, signifying the organization responsible for the satellite view.
example of a banded eye

Text description of the example of a banded eye image.
The image depicts a satellite view of a hurricane over the ocean. The hurricane's eye, centered near the middle of the image, is a relatively large, cloudless circle surrounded by tightly spiraling bands of clouds. These clouds range in color from bright white at the center to deeper blues and yellows at the edges, showcasing the storm's intensity. The spiral pattern is clearly visible, indicating strong rotational movement. The background is a dark blue sea, with a small section of green land visible at the bottom left corner.
comparison of these two hurricanes

Text description of the comparison of these two hurricanes image.
The image displays two satellite images of hurricanes over the southeastern United States and parts of the Caribbean. On the left, Hurricane Andrew, dated August 23, 1992. The hurricane's eye is clearly visible, surrounded by dense white clouds. The land and water masses are depicted in shades of green and blue, with cloud patterns in gray and white.
On the right, Hurricane Floyd, dated September 11, 1999, is seen in a similar position to Andrew off the coast of Florida. The hurricane is larger compared to Hurricane Andrew. The surrounding areas appear similar in color with a mix of green, blue, and cloud patterns in white and yellow.
Each image includes white text at the top left corner detailing the hurricane's name, date, and the NOAA satellite used. Logos from NOAA and another emblem are at the bottom corners of the left image.
Cloud-Drift Winds
H*Wind analysis of Hurricane Isabel

Text description of the H*Wind analysis of Hurricane Isabel image.
The image is a meteorological contour map showing the wind speed distribution of Hurricane Isabel at 0130 UTC on September 18, 2003. The map uses colored wind contours to indicate different wind speeds. The highest winds are found near the center of the hurricane, specifically in the northeast quadrant. The storm is centered at approximately 30 degrees latitude and -74 degrees longitude, with wind speed contours labeled in knots. A color-coded legend on the left indicates varying wind radii by directional quadrants. Text at the top describes the analysis sources and conditions, and the bottom notes the maximum observed and analyzed winds.
Indian Ocean

Text description of the Indian Ocean image.
The image is a detailed map of the Indian Ocean, depicting the the ocean and surrounding landmasses. The map shows parts of Africa to the west, including Egypt, Sudan, Kenya, Tanzania, and South Africa. On the eastern side, countries like India, Pakistan, Bangladesh, Burma (Myanmar), Thailand, Malaysia, and the Indonesian islands are visible. The map highlights major bodies of water, including the Arabian Sea and the Bay of Bengal. The central part of the map features the Indian Ocean, with several islands such as Madagascar, the Maldives, Seychelles, and Mauritius. The coastline and significant geographic features are marked, with political boundaries delineating country borders. The waters are shaded in light blue, while landmasses are depicted in beige and grey. Latitude and longitude lines are marked at intervals of 20 degrees. The equator and tropics are labeled, and the map includes a scale in kilometers and nautical miles.
successive images (0:03)
Text description of the successive images animation (0:03)
The animation is a satellite view of North and South America, with parts of both continents visible. The entire image is in grayscale, with yellow lines delineating the coastlines. The northern hemisphere shows North America, with recognizable landmasses such as the United States and Canada, covered in a mix of white clouds and clear areas. Central America is visible in the center of the image, leading down to South America, which shows varying cloud coverage. The Atlantic and Pacific Oceans surround the continents, with cloud formations seen more prominently over the Atlantic. The texture indicates different weather patterns across the regions.
three successive water-vapor images (0:03)
Text description of the three successive water-vapor images (0:03)
The animation is a satellite view depicting water vapor in the atmosphere over North and South America. The image is in shades of gray, indicating the moisture content, with lighter areas representing higher water vapor concentration and darker areas indicating less. A thin blue line outlines the continents and major islands for geographical reference. The two continents are prominently shown with cloud formations visible across various regions. The top left corner features the Pacific Ocean, while the right side highlights parts of the Atlantic Ocean. Text is located at the bottom of the image.
vapor targets

Text description of the vapor targets image.
The image is a satellite view displaying atmospheric conditions over a geographical area. Clouds are depicted in shades of gray, indicating varying levels of water vapor concentration. Overlaid are colored dots in purple, sky blue, yellow, green, and red, representing different atmospheric pressure levels. The landmasses are outlined in blue, while the ocean appears as a darker gray. The distribution of the colored dots spans across the image, illustrating meteorological data.
latest middle- and upper-tropospheric winds
Text description of the latest middle- and upper-tropospheric winds image.
The image is a satellite map depicting wind patterns in the mid-upper levels of the atmosphere over the Caribbean and parts of the Gulf of Mexico and the Atlantic Ocean. The map has a gray background with wind vectors overlaid in three colors: yellow, green, and blue, representing different pressure levels. Yellow vectors indicate areas of pressure between 251-350 mb, green vectors represent 100-250 mb, and blue vectors show 351-500 mb. The vectors show strong upper-level winds across the Gulf and northeastern Atlantic. Geographic features include outlined portions of Florida, Cuba, the Bahamas, and surrounding regions. Latitude and longitude lines are present, adding a grid overlay to the map. A legend is located in the upper right corner.
latest lower- and middle-tropospheric winds
Text description of the latest lower- and middle-tropospheric winds image.
The image is a satellite map showing infrared cloud drift winds over the Caribbean and parts of the Atlantic Ocean. Superimposed on the image are colorful vector lines in green, yellow, and blue, representing wind directions and speeds at various altitude levels. The map is overlaid with a grid of latitude and longitude lines and outlines of the continents and islands. Notable landmasses include the southern United States, Central America, and the Caribbean islands. In the top right corner, a legend displays altitude ranges: 400–599mb, 600–799mb, and 800–950mb, color-coded in yellow, cyan, and green. The image has text at the bottom indicating the information source and timestamp.
Multispectral Imagery
fly at much lower altitudes

Text description of the fly at much lower altitudes image.
The image depicts Earth in a space background scattered with small white stars. The left side of the image features a representation of Earth, centered with visible landmasses including North and South America. Surrounding the Earth are yellow lines illustrating the paths of polar orbiters located at an altitude of 850 kilometers. These lines crisscross the planet vertically. Extending from the Earth's equator is a single green elliptical line indicating a geostationary orbit with an altitude of 35,800 kilometers. This line is positioned horizontally in the image to show the geostationary orbit's alignment with the Earth's rotation.
South Pacific Ocean

Text description of the South Pacific Ocean image.
The image is a map of the South Pacific Ocea and surrounding countries. Major landmasses depicted include Australia to the southwest, New Zealand to the southeast, and parts of Southeast Asia to the northwest, including Indonesia and the Philippines. The map marks key points such as Manila, Perth, and Canberra, indicated with black stars. It illustrates various islands like Fiji, the Solomon Islands, and the Hawaiian Islands in light green. A dashed yellow line represents the Equator. In the ocean near Fiji, a path marked with a dashed line in black shows the movement of a weather system, labeled in red with dates and categories: "002, 6 Jan 04 (Cat 4)" and "002, 8 Jan 04 (TS)."
Arthur's corresponding sandwich image

Text description of the Arthur's corresponding sandwich image image.
The image is a "sandwich" satellite image showing Tropical Storm Arthur near the Texas coast. A swirl of low clouds, in white, is located inland and along the coast, while a large canopy of multicolored clouds in blues, greens, yellow, oranges, and reds is located over the Gulf. The color enhancement indicates that cloud tops in this area are very high and cold, indicative of deep convection. The contribution from visible imagery gives the clouds detail and bubbly texture that would not appear on a traditional infrared image.
loop of three-channel color composite images of a weak tropical depression (0:03)
Text description of the loop of three-channel color composite images of Tropical Depression 8 (0:03)
The image is a satellite view of a tropical cyclone over the Atlantic Ocean. The cyclone appears as a bright, circular mass with swirling cloud patterns, predominantly white at the center with shades of gray and blue extending outward. Surrounding the cyclone is a grid with numerical coordinates indicating degrees of latitude and longitude. The coastline of the southeastern United States is visible in the top left corner, outlined in bright magenta. The ocean is displayed in dark blue, providing a stark contrast to the lighter colors of the cyclone. The image includes graphical and text overlays indicating it was captured by NOAA.
simulated satellite image

Text description of the simulated satellite image.
Illustration showing clouds labeled "A" and "B" with satellite resolution, alongside a simulated satellite image with labeled pixelated clouds.
The right side of the image, titled "Simulated Visible Satellite Image" in yellow text, shows a grid of squares. The grid contains two cloud shapes, labeled "Cloud 'A'" and "Cloud 'B'" in red text. Both clouds are composed of white and various shades of gray squares, representing pixelated satellite views.
zoomed-in portion of a real visible satellite image
Text description of the zoomed-in portion of a real visible satellite image.
The image is a satellite view of a landscape dominated by a dense pattern of white clouds scattered above a green terrain. A particular section of the image is highlighted with a yellow square and connected with lines to an enlarged inset at the bottom right. This inset shows a zoomed in view of the satellite image, highlighting the pixilated nature of the image.
Peering at Precipitation
visual schematic outlining the process

Text description of the visual schematic outlining the process image.
The image illustrates 36-37 GHz radiometry, focusing on its interaction with different atmospheric layers and elements. A vertical section of the atmosphere is depicted, starting from the ocean surface at the bottom to the upper reaches of a cloud at the top. Three main atmospheric components are shown: raindrops, large ice and graupel, and small ice crystals, each marked with respective labels on the left. A wide yellow-orange arrow extends vertically through these layers, representing the upwelling radiation beams. The arrow is thickest at the top, indicating the highest radiation emanating from the upper cloud layers. Text boxes explain how small ice crystals and large ice particles do not significantly block the radiation, allowing substantial energy to reach the satellite. The “Melting Layer” is depicted as a dotted line across the cloud. The ocean surface at the bottom is shaded with blue and green tones, symbolizing the absorbed and scattered upwelling radiation due to cloud interference. Annotations emphasize key points about the radiation process at each layer, with blue text denoting the importance of ocean surface radiation.
36-GHz image from 1845Z on October 20, 2005

Text description of the 36-GHz image from 1845Z on October 20, 2005 image.
The image is a 36-GHz microwave image of hurricane Wilma, dated 10/20/05 1800z. On the left side, a grayscale depiction shows cloud formations over land, likely Central America. The right side displays a vivid thermal microwave image of the hurricane. The hurricane's eye is clearly visible, surrounded by concentric bands of intense orange-red and yellow. The 36GHz microwave image helps identify low level precipitation structure and circulation. The map includes latitude and longitude markers, with a scale indicating brightness temperature in Kelvin along the bottom. The top contains data timestamps and identifiers in bold.
artist's rendition of TRMM's orbital path

Text description of the artist's rendition of TRMM's orbital path image.
The image depicts an artistic impression of the TRMM satellite, shown hovering above the Earth. The satellite features two solar panels extending outward on either side and a dish antenna above. Below the satellite, the Earth is visible with its blue oceans and green landmasses. The orbit of the satellite is illustrated by three broad, translucent swathes spanning diagonally across the earth, showing the satellite’s imagery path.
Peering at Precipitation (Extras)
91-GHz image of Hurricane Jimena

Text description of the 91-GHz image of Hurricane Jimena image.
The image is a microwave image of Hurricane Jimena south of Baja California in the eastern Pacific. The colors represent different brightness temperatures, with red indicating cooler and blue indicating warmer areas. The map is overlaid with latitude and longitude lines, and various labels detail specific coordinates. The background consists of various shades of blue, indicating the ocean, while the landmasses are outlined in green.
schematic displaying a vertical cross section through a hurricane

Text description of the schematic displaying a vertical cross section through a hurricane image.
The image illustrates a stylized representation of a hurricane cross section. The ocean at the bottom is a deep blue with the light blue sky above. The tropical cyclone cross section is represented by a series of towering cumulonimbus clouds. The two main towering areas of convection, on either side of the center, marked with a red "L", are the tallest and most intense clouds. As you move radially away from the center, the cloud height decreases. Grey clouds appear behind the main white clouds help add depth ad sicze to the hurricane
this schematic

Text description of the this schematic image.
The image illustrates a cross-section of a tropical cyclone over the ocean, labeled "Tropical Cyclone Cross Section." It shows the structure of the cyclone, with cloud formations representing the eyewall and outer bands extending up from the ocean. The clouds, depicted in white, have blue arrows indicating downward motion and orange arrows showing upward motion. Symbolic representations of precipitation include ice crystals, snow/graupel, and raindrops, depicted in varying sizes. A satellite is shown above the cyclone with a yellow line connecting it to the clouds, indicating measurement direction. A red and yellow arrow intersect, labeled "Parallax Error," illustrating the difference between actual and measured positions of a satellite. The image background transitions from a bright blue sky to a deep blue ocean.
parallax error is smaller

Text description of the parallax error is smaller image.
The image illustrates a cross-section of a tropical cyclone over the ocean, labeled "Tropical Cyclone Cross Section." It shows the structure of the cyclone, with cloud formations representing the eyewall and outer bands extending up from the ocean. The clouds, depicted in white, have blue arrows indicating downward motion and orange arrows showing upward motion. Symbolic representations of precipitation include ice crystals, snow/graupel, and raindrops, depicted in varying sizes. A satellite is shown above the cyclone with a yellow line connecting it to the clouds, indicating measurement direction. A red and yellow arrow intersect, labeled "Parallax Error," illustrating the difference between actual and measured positions of a satellite. The image background transitions from a bright blue sky to a deep blue ocean.
The Advanced Microwave Sounding Unit
located over the eastern Atlantic at the time

Text description of the located over the eastern Atlantic at the time image.
The image is a satellite view showing a African and the main development region of the Atlantic ocean in black and white. Between Africa and South America, a large hurricane is visible. Additional areas of convection, tropical waves, are seen moving across central Africa and off the coast. The top of the globe includes parts of Europe, outlined clearly. Yellow outlines highlight the continents and country borders, while small yellow crosshairs are scattered across the image to mark grid points. In the ocean,
AMSU-A1

Text description of the AMSU-A1 image.
The image shows a mechanical structure resembling an AMSU-A1 satellite microwave imager instrument. The object is comprised of two connected rectangular boxes, primarily covered with dark solar panels. Each box has a cylindrical, gold-colored component attached to its front, housing circular openings that may function as lenses or sensors. The structure features a combination of metallic and solar panel surfaces, with visible screws and support frames demonstrating a complex, functional design.
AMSU-A2

Text description of the AMSU-A2 image.
The image depicts a metallic, AMSU-A2 satellite with various panels and components, resting on a flat surface. The main body is constructed from a series of vertically aligned, gold and blue rectangular panels. On the front, there is a large round component, resembling a hatch or cover, with several small protrusions around its edge. To the top right, a white, dish-like structure is partially visible, suggesting a form of antenna or sensor. The intricate detailing includes several rivets and screws, indicating complex assembly. The device has an industrial appearance, characterized by its angular design and metallic sheen.
graph of weighting functions

Text description of the graph of weighting functions image.
The image is a line graph showing the weighting function versus height for different channels (C3 to C15) under clear sky conditions, measured using AMSU-A1. The x-axis represents the weighting function in km⁻¹ ranging from 0 to 0.25. The y-axis represents the height in kilometers, ranging from 0 to 80 km. Each curve on the graph is labeled with a specific channel number (C3 to C15), and is depicted in various colors and styles, such as solid, dashed, and dotted lines. The legend on the right side lists the corresponding colors and styles for each channel line.
Scatterometry
SeaWinds Scatterometer

Text description of the SeaWinds Scatterometer image.
The image shows a labeled layout of satellite components. The panel is covered with a reflective gold material and has various labeled parts. At the top right, a large black circular antenna is visible. Below the antenna, a network of waveguides is highlighted, with pathways marked on the golden surface. To the left, there is a wooden rectangular square labeled "Radar Electronics." Towards the bottom, a red box is labeled as the "Controller." To the right, a blue rectangular section is adjacent to the controller. The entire assembly is set against a structured backdrop, possibly part of the satellite or an assembly area.
Advanced SCATerometers

Text description of the Advanced SCATerometers image.
The image is a picture of an advanced scaterometer (ASCAT). It consists of three elongated, rectangular structures converging at a central point, forming a Y-shape. Each arm is wrapped in metallic material, predominantly silver with sections covered in gold foil. The gold foil appears crumpled. The structures are connected at a hinge by additional layers of gold foil.
in two parallel swaths 550 kilometers wide

Text description of the in two parallel swaths 550 kilometers wide image.
The image shows a satellite positioned above the Earth with stripped microwave image swaths across the globe. The panels are shown imaging the earth's surface in colorful swaths. Below the satellite, part of Earth's curved surface is visible, mostly covered in blue and white, representing oceans and clouds. The background transitions from light to dark, suggesting space extending into the distance. Colorful, curved lines, resembling topographical or data visualization imagery, span horizontally across the atmosphere.
image labeled "AMSU"

Text description of the "AMSU image.
The image is a meteorological map depicting wind patterns over the Gulf of Mexico. The map is covered with wind barbs that denote wind speed (in 5-10 knot increments) and direction. The wind barbs generally curve counterclockwise, indicative of a tropical cyclone. The background features latitude and longitude lines with markings from 19N to 33N and 82W to 96W. Coastal outlines of Texas, Louisiana, Mississippi, Alabama, and Florida are visible. The arrows point mostly inward, suggesting a central low-pressure area typical of a storm.
image labeled "CDFT"

Text description of the CDFT image.
The image is a meteorological map depicting wind patterns over the Gulf of Mexico. The map is covered with wind barbs that denote wind speed (in 5-10 knot increments) and direction. The wind barbs generally curve counterclockwise. The background features latitude and longitude lines with markings from 19N to 33N and 82W to 96W. Coastal outlines of Texas, Louisiana, Mississippi, Alabama, and Florida are visible. The arrows point mostly inward, suggesting a central low-pressure area typical of a storm.
image labeled "IRWD"

Text description of the image labeled "IRWD image.
The image is a meteorological map depicting wind patterns over the Gulf of Mexico. The map is covered with wind barbs that denote wind speed (in 5-10 knot increments) and direction. The wind barbs generally curve counterclockwise, indicative of a tropical cyclone. The background features latitude and longitude lines with markings from 19N to 33N and 82W to 96W. Coastal outlines of Texas, Louisiana, Mississippi, Alabama, and Florida are visible. The arrows point mostly inward, suggesting a central low-pressure area typical of a storm.
capillary and/or gravity waves

Text description of the capillary and/or gravity waves image.
The image exhibits a close-up view of capillary waves on a water surface. These are small waves with smoothly flowing patterns creating waves across the image.
saw previously in this QuikSCAT image

Text description of the saw previously in this QuikSCAT image image.
The image is a weather map showing wind patterns in the Gulf of Mexico and eastern Atlantic Ocean. It includes states like Florida, Georgia, and South Carolina, along with the Gulf of Mexico and parts of the Caribbean. Wind barbs indicate wind speed and direction. Grey and blue wind barbs indicate weaker winds, yellow and green are moderate, and pink and black are strong. A strong, counterclockwise circulation can be seen in the Gulf, indicative of a tropical cyclone.
this image from the radar aboard the ERS-1 satellite

Text description of the this image from the radar aboard the ERS-1 satellite image.
The image is a grayscale satellite view depicting rain and a gust front. The upper portion of the image shows a landmass with visible patterns of development likely representing urban areas. Labeled lines mark key features: "Gust Front" is pointing to an area on the edge of the cloud deck, and "Rain" is indicated towards the middle of the clouds. The clouds appear thick and varied in texture, with some areas denser and darker than others.