Lessons
LessonsQuick Facts about EME 811
Course Developer:
Dr. Lucas Witmer, Lecturer, Department of Energy and Environmental Engineering, College of Earth and Mineral Sciences, The Pennsylvania State University.
Course Structure:
The course consists of 12 weekly lessons delivered through this site, with each lesson accompanied by reading quizzes and graded activities. Some weeks are reserved for the work on the project proposal, which will be final deliverable in the end of the semester. All course assignments are submitted through the Penn State course management system - Canvas. Please see Syllabus and Orientation for more details.
Overview:
Solar thermal energy conversion can be applied to a wide array of industrial and district applications, which provide benefits in avoided fuel costs for water and steam production in industry. EME 811 covers the physical materials used for solar energy conversion to useful thermal energy; the function and performance of non-concentrating and concentrating solar thermal energy systems; the markets and thermal requirements for industrial projects; and applications of solar thermal energy to buildings (heating/cooling), chemical processing, fuel synthesis, drying, and desalination.
This course is offered as part of the Repository of Open and Affordable Materials at Penn State. You are welcome to use and reuse materials that appear on this site (other than those copyrighted by others) subject to the licensing agreement linked to the bottom of this and every page. Please note: This course is no longer being actively taught, but we believe the material remains valuable and relevant. However, the content has not been updated since 2017, so some graphs and data may be outdated.
Lesson 1: Introduction - Overview of Solar Thermal Energy
Lesson 1: Introduction - Overview of Solar Thermal EnergyThe links below provide an outline of the material for this lesson.
1.0 Introduction
1.0 IntroductionLesson 5 [lesson name] from [name of course] is licensed under a Creative Commons Attribution-NonCommercial-ShareAlike 4.0 International License . You are welcome to use and reuse materials that appear in this lesson (other than those copyrighted by others).
I'd put my money on the Sun and Solar Energy, what a source of Power! I hope we don't have to wait until oil and coal run out, before we tackle that.
I have no doubt that we will be successful in harnessing the sun's energy. If sunbeams were weapons of war, we would have had solar energy centuries ago.

People have been leveraging solar thermal energy for millennia. The history of the use of solar energy for heating buildings (c. 4000 BC), creating fire (c. 1000 BC), and driving industrial processes (c. 1800 AD) has been well documented by archeologists and historians. The sun comes up every day (with the exception of locations that are north of the Arctic Circle or south of the Polar Circle where the sun never rises above the horizon in the depths of winter). It is our most reliable source of energy and is the source of most other forms of energy on our planet. While often characterized as intermittent, with intermittence deriving from meteorology, atmospheric physics, and diurnal and seasonal patterns, barring any catastrophic event such as a meteor impact on Earth or the expiration of the sun, the sun is always shining somewhere, will shine again everywhere, and is the primary driver behind the thermal behavior of our environment.
Lesson Objectives
At the successful completion of Lesson 1, students should be able to:
- Identify solar temporal relationships;
- Describe solar geometric relationships;
- Recall key aspects impacting available solar radiation.
What is due for Lesson 1?
This lesson will take us one week to complete. Please refer to the Course Calendar in Canvas for specific time frames and due dates. Brief directions for the lesson assignments are given in the table below, and you can find more details on respective pages of this lesson.
| Tasks | Assignment Details | Access/Directions |
|---|---|---|
| Readings | Required:
Supplementary:
| Registered students can use the following link to access the online textbook through the University Library. Registered students can access the supplementary reading in the Lesson 1 Module in Canvas. |
| Quiz | Take the Lesson 1 Reading Quiz. | Access the quiz in the Lesson 1 Module in Canvas |
| Assignment | 1 page essay on the scope of the course | Specific directions for the assignment are provided on the Assignment page of this lesson and in Canvas. |
| Discussion | Article review | Post your reflection in Lesson 1 DIscussion in Canvas. |
Questions?
If you have any questions, please post them to our Questions and Answers discussion forum, located under the Modules tab in Canvas. I will check that discussion forum regularly will do my best to respond. While you are on the forum, please feel free to post your own responses if you are able to help out a classmate.
1.1. Space and Time
1.1. Space and TimeWhen you are courting a nice girl an hour seems like a second. When you sit on a red-hot cinder a second seems like an hour. That's relativity."
Einstein, in the special theory of relativity, proved that different observers, in different states of motion, see different realities."
The location of the sun in the sky through time is relative to the location of the Earth with respect to the sun, the location of the observer on Earth, and the orientation of the collector at the observer’s location on Earth. The geometric relationships are defined by angles separated into three groups; 1) the relationship between the Earth and sun, as spheres, 2) the relationship between the sun and an observer (or point on the Earth), and 3) the relationship between a collector at some orientation and the sun. As the Earth rotates on its axis, the sun appears to traverse across Earth's sky. As the Earth orbits around the sun, the tilt of the axis moves the northern and southern hemispheres closer and further from the sun moving the sun's trajectory across Earth's sky higher and lower in the sky, creating seasons. The temporal and spatial relationships are inextricably linked.
1.2. Solar Geometric Angles (Space)
1.2. Solar Geometric Angles (Space)Recall from EME 810 the following four tables showing the Angular Symbols for Standard Solar Relations. These angles are detailed in the D&B textbook in section 1.6. These angles are all critical to the calculation of solar energy on any given surface at some orientation. To calculate the energy balance across any time scale with respect to the incident solar radiation, you must know the geometric relationships that define the spherical realities of planetary motion relative to the sun for specific tilted surfaces on the planet. Each piece is defined relative to another piece. For example, a solar panel may have a tilt, beta, but that tilt is relative to the horizontal surface on the planet, not relative to the sun. Greek symbols, often with a subscript, are used to ensure clarity through unique identifiers for each angle. Additionally, the sign convention for each angle is critical, as an incorrect sign or origin can lead to drastically incorrect results. Be careful when performing calculations to ensure that each angle and sign is correct.
| Angular Measure | Symbol | Range and Sign Convention |
|---|---|---|
| Altitude Angle | α (alpha) | 0o to + 90o; horizontal is zero |
| Azimuth Angle | γ (gamma) | 0o to + 360o; clockwise from North origin |
| Azimuth (alternate) | γ (gamma) | 0o to ±180o; zero (origin) faces the equator, East is + ive, West is - ive |
| Angular Measure | Symbol | Range and Sign Convention |
|---|---|---|
| Lattitude | ϕ (phi) | 0o to ± 90o; Northern hemisphere is +ive |
| Longitude | λ (lambda) | 0o to ± 180o; Prime Meridian is zero, West is -ive |
| Declination | δ (delta) | 0o to ± 23.45o; Northern hemisphere is +ive |
| Hour Angle | ω (omega) | 0o to ± 180o; solar noon is zero, afternoon is +ive, morning is -ive |
| Angular Measure | Symbol | Range and Sign Convention |
|---|---|---|
| Solar Altitude Angle (complement) | αs = 1 - θz (alphas is the complement of thetaz) | 0o to + 90o |
| Solar Azimuth Angle | γs (gammas) | 0o to + 360o; clockwise from North origin |
| Zenith Angle | θz (thetaz) | 0o to + 90o; vertical is zero |
| Angular Measure | Symbol | Range and Sign Convention |
|---|---|---|
| Surface Altitude Angle | α (alpha) | 0o to + 90o; horizontal is zero |
| Slope or Tilt (of collector surface) | β (beta) | 0o to + 360o; clockwise from North origin |
| Surface Azimuth Angle | γ (gamma) | 0o to ±180o; zero (origin) faces the equator, East is + ive, West is - ive |
| Angle of Incidence | θ (phi) | 0o to + 90o |
| Glancing Angle (complement) | α=1−θ (alpha) | 0o to + 90o |
1.3. Earth's Tilted Axis and the Seasons
1.3. Earth's Tilted Axis and the SeasonsIn EME 810, you learned and applied principles regarding the Earth's rotation, the cosine projection effect of light, and some insight into the driving force behind the seasons. These principles are critical for appropriate engineering of solar thermal solutions for utilities and industry. A comprehensive understanding of the solar resource and the physics behind the intermittent and cyclical behavior of solar energy enables the engineering of solar thermal systems that adequately meet a client's needs.

Earth's Rotation
As we have seen in our reading, the Earth rotates with a roughly constant speed, so that every hour the direct beam (a ray pointing from the surface of the sun to a spot on Earth) will traverse across a single standard meridian (standard meridians are spaced apart). The implications are that the unit of one hour is equivalent to the rotation of Earth 15 degrees. When Earth rotates such that the beam of the sun shifts of longitude from East to West: it takes 4 minutes of time.
Wild fact: a time zone change of one hour is really just 15 degrees of separation between standard meridians.
The axis of rotation of the Earth is tilted at an angle of 23.5 degrees away from vertical, perpendicular to the plane of our planet's orbit around the sun.
The tilt of the Earth's axis is important, in that it governs the warming strength of the sun's energy. The tilt of the surface of the Earth causes light to be spread across a greater area of land, called the cosine projection effect.
Cosine Projection Effect
When you tilt a surface away from a beam of light, you spread the same density of light across a larger area. Recall that irradiance is in units of , so a larger denominator means a smaller value of irradiance, right?
Explore the concept of the cosine projection effect in the following experiment.
Light Intensity Experiment using a Flashlight (0:18)
Transcript: Light Intensity Experiment using a Flashlight (0:18)
In the example above, changes made to the angle of the flashlight affect light intensity. The intensity of light that shines on a surface depends on the angle at which the beam strikes the surface. The shallower the angle, the more the light spreads out, resulting in a lower intensity. Observe how the light intensity as you change the angle of the flashlight.
Seasons and the Cosine Projection Effect
The sun is about 93 million miles away from the Earth (equivalent to ~150 million km). That is so far away that the photons from solar irradiation effectively travels in parallel rays. So, unlike the flashlight experiment, the tilt of the sun has no bearing on the intensity of the radiation reaching the Earth's surface. Instead, we find that the Earth's tilt controls the intensity of irradiation and the seasons.
Keep in mind that the Earth's axis points to the same position in space (toward the North Star, Polaris). As the Earth travels in a near spherical (a very small eccentricity into an ellipse) orbit around the sun, the northern hemisphere can be tilted toward or away from the sun, depending on its orbital position.
Season designations are for the Northern Hemisphere (Looped Animation)
Transcript: Season designations are for the Northern Hemisphere (Looped Animation)
Click on the name of each season in the nimation above to see more information and read the corresponding season descriptions below.
SPRING: (Image of the tilt of the earth in the spring) In this configuration, the earth is not tilted with respect to the sun’s rays (The earth in this picture is actually tilted towards you as indicated by the fact that you can see the North Pole – green dot). Therefore, radiation strikes similar latitudes at the same angle in both hemispheres. The result is that the radiation per unity area is the same in both hemispheres. Since this situation occurs after winter in N. Hemisphere we call it spring, while in the S. Hemisphere it is autumn. This occurs on March 21.
SUMMER: (Image of the tilt of the earth in the summer) When the N. Hemisphere is tilted towards the sun, the sun’s rays strike the earth at a steeper angle compared to a similar latitude in the S. Hemisphere. As a result, the radiation is distributed over an area which is less in the N. Hemisphere than in the S. Hemisphere (as indicated by the red line). This means that there is more radiation per unity area to be absorbed. Thus, there is summer in the N. Hemisphere and winter in the S. Hemisphere. This situation reaches a maximum on June 21.
AUTUMN: (Image of the tilt of the earth in the autumn) In this configuration the earth is not tilted with respect to the sun’s rays (The earth in this picture is actually tilted towards you as indicated by the fact that you can see the North Pole – green dot). Therefore, radiation strikes similar latitudes at the same angle in both hemispheres. The result is that the radiation per unit area is the same in both hemispheres. Since this situation occurs after summer in the N. Hemisphere we call it autumn, while in the S. Hemisphere it is spring. This occurs on September 21.
WINTER: (Image of the tilt of the earth in the winter) When the N. Hemisphere is tilted away from the sun, the sun’s rays strike the earth at a shallower angle compared to a similar latitude in the S. Hemisphere. As a result, the radiation is distributed over an area which is greater in the N. Hemisphere than in the S. Hemisphere (as indicated by the red line). This means that there is less radiation per unit area to be absorbed. Thus, there is winter in the N. Hemisphere and summer in the S. Hemisphere. This situation reaches a maximum on December 21.
Self Check
Click on "Summer" in the above animation. When the northern hemisphere tilts toward the sun, the irradiation has a lower angle of incidence, meaning more photons strike a smaller area during the daytime. Answer the following questions for yourself.
- What happens to the southern hemisphere?
- What is the correlation between concentrated sunlight and the seasons?
- What happens beyond the Arctic Circle, which spans from about 66.5 degrees latitude to the North Pole?
Now, answer the same questions for autumn, spring, and winter.

Forecasters and meteorologists use different criteria to determine the "meteorological seasons." For example, meteorological winter in PA runs from December 1 to Feb 28/29, a period that statistically includes the three coldest months of the year. This is also centered on a time about 25 days after the Winter Solstice.
Meteorological summer runs from June 1 to August 31, a period that includes the warmest three months of the year. Again, this is a period centered about 25 days from the Summer Solstice.
Please review the following NASA movie from 2000-2001, showing the rhythms of the most intense ultraviolet radiation coinciding with the most direct rays of the sun (around the summer solstices). Again, what may be a surprising observation is that the average air temperatures lag the sun's most direct days.
Ultraviolet Radiation Patterns (0:08)
Transcript: Ultraviolet Radiation Patterns (0:08)
The animation shows a map of the world with a colored overlay indicating high ultraviolet radiation near the equator and low ultraviolet radiation toward the North and South poles. The band of high ultraviolet radiation is centered over the equator in April and moves north where it reaches its northern maximum in July/August. The band of high ultraviolet radiation then moves to the south where it crosses the equator in September and reaches it's southerm maximum in January when it begins to move north again repeating the same cycle every year.
As one more example, review Pittsburgh's plot of annual average high temperatures. The maximum daily temperature occurs in late July, long after the summer solstice.

Self Check
You have seen these questions already in EME 810; you should be able to answer the following questions.
- What is the symbol for the day number?
- What is the declination, and what is the symbol for declination?
- What season is it in the Southern Hemisphere if the declination is a large positive number?
- How many hours of sunlight are in a day when the declination is zero?
- Does the sun always rise due East?
1.4. Solar Time
1.4. Solar TimeRecall from EME 810 that the time that we use in solar energy engineering is the apparent time and path of the sun relative to the aperture or collection device, called Solar Time. Because the Earth is a rotating sphere (360deg) that completes a rotation every 24 hours, 360 divided by 24 gives 15 degrees of rotation per hour, or one degree every 4 minutes. The chronological time that clocks use do not account for your geographic location beyond correcting for a time zone. Within a time zone, if you are geographically close to the next time zone, a larger time correction is necessary to convert to solar time. Additionally, the Earth does not rotate perfectly, rather, it wobbles on its axis creating what is known as an analemma. As such, an "equation of time" is necessary to convert between solar and standard time, as given in D&B equations 1.5.2 and 1.5.3.
Correcting with the Equation of Time: Accounting for Wobbles
Even in Greenwich, where no longitudinal correction is necessary, "noon" UTC will generally not be the time when the sun is directly overhead. We can see in the plot below that watch time and solar time are the same in Greenwich for only 4 days in the year.
- There are deviations of up to 16 minutes (regardless of your location on the planet).
As you will have read, our interpretation of watch time assumes an even progression for Earth's planetary rotation, with no weebles or wobbles or precession of the polar axis. However, you will now know that wobbling occurs, and there is great variability in the rotation of the Earth throughout the months of the year. This is why we add leap years and leap seconds to our calendars. So we create a "mean time" based on the length of an average day to keep things simple. Solar time has to correct for this mean time approximation.

For views of amazing solar analemma photography by Anthony Ayiomamitis, please visit his solar image gallery. The gallery has a series of composite of images, taken at the same watch time every few days for an entire year to record the position of the sun. We call the shape an analemma. An analemma is a beautiful way to capture both the range of declination $\delta$ (along the length of the analemma) and the Equation of Time Et (the expansion or width of the analemma) in a graphical format. Notice how there is a big loop and a little loop, and compare the same big waves and little waves in the first image of the Equation of Time correction above. If you were to draw a line down the center, you would have removed the error from watch time, and you would be one step closer to solar time.

Correcting for Little Longitude Changes: Inside Time Zones
Recall from EME 810 that there is a correction for longitude based on where you are within your timezone. Where you live, or where your future solar site assessment will occur, will likely be well within the edge of a time zone (meaning ). We already learned that every of angular rotation on Earth is equal to 4 minutes of time. Standing in one spot on the surface, this means 4 minutes of relative time correction locally per degree of deviation from a Standard Meridian (). So locales will have a local longitudinal refinement to account for, in order to account for not living directly on a 15 degree incremental Standard Meridian on Earth.
Standard Meridians define the beginning of a time zone, and not the end of a time zone. So you are always going to look to the start of a time zone to find the Standard Meridian.
There are a few other cities that actually are well seated for solar time zone correction (close enough for our calculations):
- Philadelphia is fairly close to the EST standard meridian of .
- Denver is fairly close to the MST standard meridian of .
My client lives someplace other than a Standard Meridian, how do I account for that?
First, go to Google and type "<insert city name> longitude". You should get a quick response of both the Longitude () and the latitude (our symbol for latitude is lowercase Greek "phi": ), represented in decimal form (more useful to us for trigonometry and angles). Do this now for your current location, and note (self check) how many degrees away you are from your standard meridian (multiple of ).
Have you noticed that real time zones are more often political boundaries that zigzag around, rather than following an actual Standard Meridian? So, actually, there can be locales for clients that are East of their own time zone Standard Meridian, instead of the normal relative locations West of the time zone Standard Meridian. This is why, in the reading, you will see minutes per degree of local longitudinal shift away from the time zone's Standard Meridian.
Self Check
Work through Example 1.5.1 (page 11) in the D&B text by hand with a paper and pen(cil).
1.5. Extraterrestrial Radiation and the Atmosphere
1.5. Extraterrestrial Radiation and the AtmosphereExtraterrestrial Variation
In addition to the geometric (space) and chronologic (time) relationships between collector surfaces on Earth and the sun, the intensity of the sun's irradiation changes based on the distance between the Earth and the sun because of the eliptical orbit of the Earth. While the average solar radiation flux is 1361 W/m2, the annual fluctuation due to the Earth's eliptical orbit is greater than 40 W/m2, resulting in peak extraterrestrial radiation flux of about 1410 W/m2 in January and lows of about 1320 W/m2 in June. The following equations can be found in the D&B text section 1.4.
Gon = Gsc (1 + 0.033 cos(360n/365))
OR
Gon = Gsc (1.000110 + 0.034221 cos B + 0.001280 sin B +0.000719 cos 2B + 0.000077 sin 2B)
where Gon is the extraterrestrial radiation incident on the plane normal to the radiation on the nth day of the year and B is given by
B = (n − 1) *360/365
Atmosphere
The Earth's atmosphere is the source of the greatest uncertainty in predicting solar radiation incident on a solar collector. Particulates, aerosols, clouds, moisture, etc. are the drivers behind the intermittency of incident solar energy due to atmospheric attenuation. Some meteorologists and atmospheric scientists have spent their entire careers focused on the problem of modeling the atmosphere to develop predictive tools for increased accuracy in energy models. The application of such atmospheric modeling tools is enabled with an accurate level of solar radiation known outside of the Earth's atmosphere (extraterrestrial).
1.6. Why Solar Thermal?
1.6. Why Solar Thermal?Facts about Solar Thermal Energy
- Solar thermal energy has been used in various ways for millennia, ranging from simple fire starting with a pocket mirror to solar architecture to capture heat in buildings.
- 48% of the the sun's energy is in the infrared spectrum, invisible to the human eye, as heat.
- Solar thermal collectors can employ (absorb) nearly the entire solar spectrum
- The sun is the most abundant and reliable source of energy
- Financially, solar thermal energy conversion systems have reached grid-parity in many locations
Currently, we (humans) use an abundance of fossil fuels for much of our heat needs. While in the long run our society will switch to the source of all of those fossil fuels (the sun), the reality is that most of you have probably not experienced the direct impact of a solar thermal energy conversion system on your life. The truth is that we can do everything that we currently do in our society with solar energy. Much of the burden can be carried by solar thermal solutions. One terrific modern day example of a solar thermal energy system is the Drake Landing Solar Community in Alberta, Canada, where 95% of the the community's heating needs are supplied by on-site solar thermal collection and a connected seasonal thermal energy storage system. Our society uses a lot of heat. We need to keep working to make solar thermal energy solutions make sense and work well in more places whenever possible.
1.7 Assignment
1.7 AssignmentWhile solar thermal energy has been studied and leveraged for millennia, the technical difficulty and subsequent costs of appropriately meeting an energy need have hindered the wide adoption of solar thermal energy conversion systems, instead opting for other technologies and fuel sources. In light of your background and professional aspirations, write an essay that identifies your relationship with the course material. The essays will serve two purposes: (1) sharing your perspective with the class and (2) second, thinking critically about the relevance of the course subject matter to your educational and career goals.
Deliverable - Lesson 1 Assignment
Submit your essay as a one page pdf file to the Lesson 1 Assignment dropbox in Canvas by 11:55 p.m. (your local time) on Wednesday. Format suggestions: the essay should fit on one page, size 12, "Times New Roman" or equivalent font, with one inch margins on all sides. Please see the Calendar in Canvas for specific due dates.
1.8 Discussion
1.8 DiscussionSolar thermal energy conversion systems at the utility scale have been developed for over a century using basic thermal principles, concentration systems, and mechanical engineering practices for heat and power. The article referenced below discusses some aspects for and some against the recent progress at the Ivanpah solar thermal electricity generation plant in the Mojave Desert, California, USA. While we are not seeing a mass conversion of our electricity generation infrastructure to solar thermal generation yet, the industry is experiencing significant growth.
Required Reading
Read the Ivanpah-NYTimes-Feb2014.pdf article. Registered students can access the article located in the Lesson 1 Module in Canvas.
Deliverable - Lesson 1 Discussion
Summarize the author’s perspective(s) and provide any comments, corrections, or insights into the content of the article in your post. Please include references to support your assertions. Suggested length: 200-300 words. Next, provide a comment/response to two other posts.
Initial post to the Lesson 1 Discussion is due by Sunday night (11:55 p.m. your local time), and replies to others are due by Wednesday night (11:55 p.m. your local time).
Please see the Calendar in Canvas for specific due dates.
1.9 Summary and Final Tasks
1.9 Summary and Final TasksSummary
This week, we’ve looked back at what we learned in EME 810 and refreshed our memories. We have taken this information and laid a foundation for applying our knowledge to the field of solar thermal energy for utilities and industry. Finally, we have introduced ourselves to each other and thought about what impact solar thermal energy has on each of us.
Quiz
Be sure to take the Lesson 1 Reading Quiz by Wednesday night.
(Please see the Calendar in Canvas for specific due dates.)
Reminder - Complete all of the Lesson 1 tasks!
You have reached the end of Lesson 1! Please double-check the to-do list on the Lesson 1 Introduction page to make sure you have completed all of the activities listed there before you begin Lesson 2.
Lesson 2: Materials for Optocaloric Performance
Lesson 2: Materials for Optocaloric PerformanceThe links below provide an outline of the material for this lesson.
2.0 Introduction
2.0 IntroductionIn EME 810, you learned about the difference between optoelectronic and optocaloric solar energy conversion. As you may remember, optoelectronic refers to the photovoltaic effect of photons (radiation) being converted to electrons (electricity) while optocaloric refers to photons being converted to heat (thermal energy). In order to maximize solar energy gain and the subsequent conversion to useful thermal energy, it is necessary to understand how different materials interact with the sun’s electromagnetic radiation (photons) at different wavelengths. There are three key pieces to gaining a useful understanding of what is going on during the optocaloric conversion process:
1. A basic understanding of radiation heat transfer (D&B Chapter 3) is useful in light of the fact that solar energy, which passes through the atmosphere and reaches your collector surface, is trasferred via the process of radiation (not conduction or convection, though those heat transfer mechanisms can also play a part depending on the system configuration).
2. To convert photons to heat, the photons must be absorbed by the collector. This process requires opaque materials as opposed to reflective or transparent materials which would not absorb the energy but transfer it elsewhere. As such, an understanding of the radiation characteristics of opaque materials (D&B Chapter 4) is especially useful.
3. Many solar thermal energy conversion systems utilize a cover-absorber system to increase efficiency. Covers are typically glass, but can be made out of any material that transmit radiation while reducing losses from convection to the surroundings. As such, an understanding of the transmission of radiation through glazing (D&B Chapter 5) is useful.
These three main topics together provide important background for selection and use of materials in solar thermal energy conversion systems.
Lesson Objectives
- Identify materials best suited as components of solar thermal collectors.
- Apply selective surface characteristics in calculations.
- Calculate transmittance, reflectance, absorptance, and tau-alpha for various scenarios.
What is due for Lesson 2?
This lesson will take us one week to complete. Please refer to the Course Calendar in Canvas for specific time frames and due dates. A brief list of the lesson assignments is provided in the table below. More specific directions can be found on the pages of this lesson and in Canvas.
| Tasks | Assignment Details | Access/Directions |
|---|---|---|
| Readings | Required
Supplementary
|
Registered students can use the following link to access the online textbook through the University Library. |
| Quiz | Lesson 2 Reading Quiz checks understanding of the material presented in required readings. | Access the quiz in the Lesson 2 Module in Canvas. |
| Assignment |
Problem set - Radiation Characteristics |
Specific directions for the assignment are provided on the Assignment page of this lesson. |
| Discussion | Understanding the radiation properties of materials | Read directions to this discussion and post you reflection in Lesson 2 Module in Canvas. |
Questions?
If you have any questions, please post them to our Questions and Answers discussion forum, located under the Modules tab in Canvas. I will check that discussion forum regularly will do my best to respond. While you are on the forum, please feel free to post your own responses if you are able to help out a classmate.
2.1. Heat Transfer Considerations
2.1. Heat Transfer ConsiderationsThis section focuses on the fundamentals of the radiation heat transfer, the nature of solar energy as electromagnetic radiation, and interactions of solar radiation with various materials. Radiation heat transfer is often addressed only briefly in any heat transfer course. However, In solar energy conversion systems, where the total energy flux is often orders of magnitude smaller than in conventional heat transfer systems, the contribution of the radiation heat transfer mechanism is significant. Conduction and convection also play a significant role in the performance of certain solar energy conversion systems.
Reading Assignment
To become introduced to the theory of the heat transfer as it applies to solar thermal systems, please read the following text:
Duffie, J.A., and Beckman, W.A., Solar Engineering of Thermal Processes, Wiley and Sons, 2013, Chapter 3, Sections 3.1-3.10.
Radiation heat transfer is dependent on the specific wavelength of the radiation. The distribution of wavelengths from a blackbody radiation source, such as the sun, is described by Planck’s Law (Equation 3.4.1 Duffie & Beckman, 2013). This equation can be integrated for a wavelength range of interest to find the total energy for different scenarios. The results of this integration are given in various simplified forms, which are convenient for practical use. Two important expressions derived from the Planck's law are Wien's displacement law (Equation 3.4.2 Duffie & Beckman, 2013) and Stefan-Boltzmann equation (Equation 3.5.1 Duffie & Beckman, 2013). Take a closer look at those expressions and understand what they are used for.
Another way Planck's law intergration data are often presented is Radiation Tables. Those become handy when the total emount of energy emitted by a blackbody source needs to be estimated for a specific wavelength interval. The example video below specifically illustrates how such data are made useful to answer some practical questions.
Solution to example 3.6.1 (6:45)
Transcript: Solution to example 3.6.1 (6:45)
PRESENTER: Hello, this is example 3.6.1 from page 143 of the Duffie & Beckman text. So this problem is about the Sun, which is a 5,777 Kelvin black body radiator. And we are asked to find the wavelength or lambda, the wavelength at which the maximum monochromatic emissive power occurs. And this part of the question is solved by Wien's displacement law, which states that the maximum wavelength times the temperature of the black body radiator is equal to 2,897.8 micrometers Kelvin. So to divide by T on both sides, and therefore lambda max. This is equal to 2,897.8 divided by 5,777, which is 0.502 micrometers. So that is the wavelength at which maximum power occurs. So building into the second part of the problem, let's just draw what this looks like. This is wavelength, and this is power. The distribution of solar energy looks something like that. And so what it's saying is that at this point that happens, at 0.5 micrometers. So if this is problem A, problem B asks a second question about this same situation. It asks, what is the energy fraction from the source that's in the visible frequency range? So we find these fractional values in table 3.6.1A. And what this is asking, the visible frequency range is from 0.38 micrometers up to 0.78 micrometers. So in this graphic that's given by a range like that. And we're trying to figure out what is going on in between there. So from the table, we want to find what lambda T is. So 0.38 times 5,777 gives us 2,195 and 0.78 times the temperature of the black body radiator is 4,506. So with both of these numbers, you can now look it up in table 3.6.1A and obtain the fraction of energy from 0 up to that wavelength. So in the case of the first one, it's 10% percent. And in the case of the second one it's 56% from that table. So therefore, we can figure out our answer of fvis, the visible frequencies, which is simply 56% minus 10% 0.46, which is 46% of total energy in visible. And again, put the answer in a box so that it's clearer what we've done. And that's that. So thank you for listening. And that's problem 3.6.1.
Many solar thermal energy conversion systems use flat plate collectors, which are essentially two parallel plates (one transparent and the other absorptive) exchanging radiation. Calculating the radiation heat exchange between the two surfaces is a necessary aspect of understanding the energy balance of a system. Example 3.10.1 (Duffie & Beckman, 2013) is given below in a brief video.
Solution to example 3.10.1 (6:19)
Transcript: Solution to example 3.10.1 (6:19)
PRESENTER: OK. Welcome back. This is example 3.10.1 from page 149 of the Duffy and Beckman text. And in this problem, we have two parallel plates-- an absorber plate and a cover. So this is a cover absorber system. And this could be like a solar hot water heater or an air solar heater. And these two plates are 25 millimeters apart. And some of the properties of each surface for the plate-- the emissivity, or epsilon, is equal to 0.15. And the temperature of the plate is 70 degrees Celsius, which we need to convert to Kelvin. So 70 plus 273. So 343 Kelvin. And the cover, similarly, has an emissivity. The cover is 0.88. And the temperature of the cover is a little bit cooler, at 50 degrees Celsius, which, converting that to Kelvin, we get 323 Kelvin. So in this problem, with this system, as defined above, we're asked to find two things. First, we're asked to find the radiation exchange between the two surfaces. And in this case, intuitively, it's helpful to think which direction the heat will flow. That way, you don't have some weird negative sign you're trying to deal with in the end. The heat flows from the hotter surface to the cooler surface. And the second, we're asked to find the radiation heat exchange coefficient under these conditions. So with all of that in mind, let's go ahead and solve the problem. , So Part A. To solve the amount of radiation heat exchange going on, we're going to use equation 3.8.4 from the text. And we solve this on a per unit area basis, because the size of the collector is not given. And so we solve it per meter squared, which then, if you had a, 3 meter squared collector, you would basically multiply this answer by three to obtain your final total heat exchange. So here's the Stefan-Boltzmann constant, sigma, in this heat exchange equation. And then, again, we use the hotter surface first so that we have a good sign convention. Temperature of that surface-- 343 minus 323, the temperature of the cooler surface, all divided by the emissivity. So 1 over 0.15 plus 1 over 0.88 minus 1, all in the denominator. And the Stefan-Boltzmann constant is 5.67 times 10 to the negative 8. If you've had a heat transfer class, you'll remember that number. It's pretty easy-- 5, 6, 7, 8. 5.67 times 10 to the negative 8. And when you run those numbers through your calculator, you get 24.6 watts per meter squared. So that's from absorber to the cover. Cool. And then Part B of this problem says, under these conditions, what's the radiation heat exchange coefficient? So here we're going to use equation 3.10.1, which is the definition of h sub r, the heat exchange coefficient. So h sub r equals this heat exchange we calculated in Part A-- 24.6 divided by the temperature difference, 70 minus 50. And you can do this in Kelvin or Celsius in the denominator. You would get the same number. And so what you end up with is 1.232 watts per meter squared Kelvin. And that's that. That's example 3.10.1. Thank you for listening.
Self Check:
1. What is the purpose of the following equations? (click on the name to see the answer)
ANSWER: Planck's equation describes the distribution of the radiation emitted by a blackbody over the range of wavelengths.
ANSWER: Wien's equation determines the wave length at which a blackbody of a certain temperature emits the maximum radiation.
ANSWER: Stefan-Boltzmann equation is used to found the total energy flux emitted by a blackbody at a certain temperature T.
2. What is the purpose of the radiation tables?
ANSWER: Radiation tables (Table 3.6.1a in Duffie & Beckman, 2013) are a simplified result of the integration of the Planck's equation - they allow determining the fraction of radiative energy emitted by a black body within a certain wave length range.
2.2. Radiation Characteristics of Opaque Materials
2.2. Radiation Characteristics of Opaque MaterialsWhen solar radiation hits a surface, the photons can be absorbed, reflected, or transmitted. In the case of opaque (not transparent) materials, none of the photons are transmitted. If the material is dark and dull (not reflective or shiny), very few of the photons are reflected. As such, the majority of photons incident on dark opaque surfaces will be absorbed. As s result of absorption, the photons are converted to thermal energy (or heat). At the same time, because of the temperature of the material, the surface emits radiation back to its surroundings at a rate that is dependent on the emissivity of the material. Heat can also be lost to the surroundings by conduction and convection, but that is not the focus of this lesson.
Reading Assignment
To learn the interaction of the solar radiation with opaque materials and parameters that characterize heat transfer, please read the following text:
Duffie, J.A., and Beckman, W.A., Solar Engineering of Thermal Processes, Wiley and Sons, 2013, Chapter 4, Sections 4.1-4.10.
While reading especially work through the examples that illustrate the use of the main equations.
Some additional note on materials selection:
When designing a solar thermal conversion system, the selection of materials is critical. Choosing collector materials that are good absorbers (i.e. carbon black) will help your system to perform well. Sometimes the best material can be too costly to justify. As such, it becomes a balance of priorities towards an optimal system. If a material of high absorptance (α=0.95) costs $10/lb and a material of higher absorptance (α=0.98) costs $20/lb, the best option to achieve a desired solar gain may be to use the cheaper material and increase the system aperture or total collector area.
In addition to the cost and physical radiation properties of materials, we must be careful to select materials that will hold up under extreme climatic and environmental conditions. For example, in sandy desert environments, the abrasive sand can have a negative impact on the reflective properties of concentrating trough collector systems over time. Thus full understanding the in situ performance of a material over a period of decades is important to the design and optimization of solar thermal energy conversion systems.
Self Check:
1. How would you define absorptance?
ANSWER: Absorptance is the ratio of the fraction of the incoming raditation that is absorbed by the material to the total incident radiation
2. How would you define emittance?
ANSWER: Emittance is the ratio of the radiation that is emitted by a material surface to the radiation that would be emitted by a blackbody at the same temperature
3. How would you define reflectance?
ANSWER: Reflectance of a surface is the ratio of the radiation that is reflected (i.e. not absorbed or transmitted) to the total incident radiation.
4. For best performance of flat-plate collectors, it is generally more important to maximize absorption of radiation rather than minimize emission of heat. If the highest temperature of the material surface is desired, which three options from the Table below would you pick?
| Material | Typea | Absorptancec | |
|---|---|---|---|
| Aluminum, pure | H | 0.09-0.10 | |
| Aluminum, anodized | H | 0.12-0.16 | |
| Aluminum, SiO2 coated | H | 0.11 | |
| Carbon black in acrylic binder | H | 0.94 | |
| Chromium | N | 0.415 | |
| Copper, polished | H | 0.35 | |
| Gold | H | 0.20-0.23 | |
| Iron | H | 0.44 | |
| Lampblack in epoxy | N | 0.96 | |
| Magnesium oxide | H | 0.14 | |
| Nickel | H | 0.36-0.43 | |
| Paint - Parson's black | H | 0.98 | |
| Paint - Acrylic white | H | 0.26 | |
| Paint - White (ZnO) | H | 0.12-0.18 |
aH is total hemispheric emittance; N is total normal emittance.
bThe numerator is the emittance at the temperature (K) of the denominator.
cNormal solar absorptance.
From quick look at the data, the three materials with the highest absorptance should provide the highest performance (see Section 4.10 D&B) :
- Carbon Black
- Lampblack
- Parson’s Black
On the previous page of this lesson, we looked at how the wavelength of the incident radiation matters because the wavelength determines the amount of energy that is transmitted. Some specially selected or designed materials may absorb radiation in one range of wavelengths very efficiently while may be highly reflective in a longer wave length range. Such materials are referred to as selective surfaces. The concept of selectrive surface is discussed in Section 4.8. of D&B book, and Example 4.8.1. and 4.8.2. show how the radiation properties of such materials can be calculated. Please review those examples in detail. In this lesson assignment, you will be asked to perform a similar calculation.
2.3. Radiation in Cover-Absorber Systems
2.3. Radiation in Cover-Absorber SystemsMany solar thermal energy conversion systems employ glass to reduce convective losses from the absorbing surface, increasing system efficiency. Glass is not perfectly transparent, with some absorption as well as reflective losses that are dependent on the incidence angle of the solar irradiation. The three useful metrics for understanding what the performance of a glass cover will be are transmittance (τ), reflectance (ρ), and absorptance (α).
It is important to realize that when a light beam hits a particular surface or material, radiation can be reflected from the surface of the material, transmitted through the bulk of the material, and absorbed in the material. There are no other options since the energy needs to be conserved. This concept is additionally illustrated below:

The key radiation properties can be derived for a particular material or surface using Fresnel equations. As we will see further, the transmittance, reflectance, and absorptance are dependent on the thickness, refractive index, and extinction coefficient of the material of interest. Before proceeding to the Fresnel derivation, it would be useful to quickly refresh our mind on the light reflection and refraction laws.
Refresher: Law of reflection and refraction
The following diagram illustrates the main directions of a light ray on a material surface. The key parameters to note:
- The angle of incidence (q1) - angle between the incoming ray and normal to the interface
- The angle of reflection (q3) - angle between the reflected ray and normal to the surface
- The angle of refraction (q2) - angle between the refracted ray and normal to the surface
- Index of Refraction (ni) - dimensionless number characterizing light propagation in a material. It is constant for every type of medium at a constant temperature. For more information, check the Wikipedia page for this property.

As you may recall from physics, by the Law of Reflection, the angle of incidence is equal to the angle of reflection:
θ1 = θ3
By Snell's Law, the light refraction process is described as follows:
n1sinθ1 = n2sinθ2
Now let us see how radiation characteristics can be derived.
Reading Assignment
Please read the following text to become familiar with the main characteristics of cover systems for solar thermal applications
Duffie, J.A., and Beckman, W.A., Solar Engineering of Thermal Processes, Wiley and Sons, 2013, Chapter 5, Sections 5.1-5.6 and 5.11.
Especially pay attention to examples, which are very helpful for understanding how the key equations are applied to practical problems. You will have a few problems on this topic in your homework assignment.
Example 5.3.1 is given below in a brief video.
Solution to Example 5.3.1 (14:31)
Transcript: Solution to Example 5.3.1 (14:31)
PRESENTER: Hello. This is example 5.3.1 on page 207 of the Duffie and Beckmann text. This problem is about a single glass cover system asking to calculate the transmissivity, reflectivity, and absorptivity of that class cover. So single glass cover. What that means is that we can look up in table 5.1.1 that the index of refraction is 1.526. That's the information that we gather from the fact that it's a single glass cover. The thickness-- L, length, is 2.3 millimeters. That's given, and that equals 0.0023 meters. The extinction coefficient, K, is equal to 32 units per meter. And the incidence angle, theta, is given as 60 degrees. And we are asked to find transmissivity-- tau; reflectivity-- rho; and absorptivity-- alpha. I've also added that I want to check that the sum of all of these-- tau plus rho plus alpha-- equals 1. Because it should be because the incident radiation is either transmitted through the material, reflected off the material, or absorbed in the material, and that's it. It's a one-sum game. Something's got to happen each photon, and those are the three things that can happen to them. So to kick this off, first we have to calculate the refraction angle. We do that using equation 5.1.4. We get theta 2 is equal to the sine inverse of the sine of the incidence angle divided by the index of refraction, and that results in theta 2 equal to 34.58 degrees. And so this allows us to calculate the extinction coefficient optical path product, which is KL over cosine theta 2. So K is 32 times 0.0023. We divide by the cosine of 34.58. So what we get is 0.0894. The next piece of the puzzle is to calculate tau sub a. So here, we're going to use equation 5.2.2. We get tau sub a equals exponential of negative 0.0894, the number we just calculated above. And what we get is 0.915. So note that this is not the transmissivity. This is tau sub a. We still have to average for the parallel and perpendicular components of polarization in the glass. So this is an intermediate step on our way to the solution. So in the next piece of the puzzle, we need to use equations 5.1.2 and 5.1.1 We're going to use 5.1.1 first. Calculate the perpendicular component of reflectance. That's equal to the sine squared of the angle we calculated above minus the incidence angle divided by sine squared of 34.58 plus the incidence angle. So we get 0.184 divided by 0.994, which is equal to 0.185. And then the parallel component is almost the same equation, but instead of sines, we use tangents. 34.58 minus 60 divided by the tan squared of 34.58 plus 60. And that gives us 0.226 divided by actually a very large number, 155.8. So what we end up with because we're dividing by such a large number is we end up with a very small number for the parallel component there. So what we end up with here is a way to calculate tau, transmissivity. So therefore tau is equal to 0.915, which is the tau sub a number, divided by 2 times 1 minus 0.185 divided by 1 plus 0.185, which is the perpendicular component, times 1 minus 0.185 squared divided by 1 minus 0.185 times 0.915 quantity squared. Close that parentheses. Plus now we have to do the parallel component. 1 minus 0.001 over 1 plus 0.001 multiplied by 1 minus 0.001 squared divided by 1 minus 0.001 times 0.915, quantity squared, and close all those parentheses and brackets. This gives us 0.5 times 0.625 plus 0.912, which is equal to 0.768-- final answer for tau. So that was definitely a long, drawn-out process, and now we have tau. The good part is that that's the hard part-- calculating reflectivity-- and absorptivity is relatively straightforward at this point. So in light of the lack of room in this little area here, we're going to move up into the empty space up here for the next part of the problem. So that was for calculating tau. So next, we're going to calculate reflectivity. So to do that, we use equation 5.3.2 for reflectance, and that gives us rho equals 0.5 times 0.185-- again, we reuse a lot of these same numbers that we calculated before, so we've already done the bulk of the work getting this far-- 1 plus 0.915 times 0.625 plus 0.001 times 1 plus 0.915 times 0.912. So when you crunch all those numbers, you end up with reflectivity equals to 0.147. Next, we're going to calculate absorptivity. I'm going to do that using equation 5.3.3. Alpha equals 1 minus 0.915 divided by 2 multiplied by 1 minus 0.185 which is, again, that perpendicular component of r over here, divided by 1 minus 0.185 times 0.915-- 0.915 is that tau sub a, again, over here-- plus 1 minus 0.001, which is the parallel component over here, divided by 1 minus 0.001 times 0.915-- that tau sub a again. Close that parentheses, crunch all those numbers, and you end up with alpha equals 0.085. So we've calculated each of these three pieces, and now it's good to just check it. So we're going to check that tau plus rho plus alpha equals 1. If you punch those numbers in your calculator, 0.768 plus 0.147 plus 0.085, you end up, indeed, that they do equal 1. Check. So we've accounted for all the photons essentially, and that's example 5.3.1. Thank you so much for your time and for listening.
Because of the complex intra-system interactions of incident solar energy in a combined cover-absorber system, the transmittance-absorptance product (τα) is defined. The τα parameter should be thought of a property of a cover-absorber combination, rather than the product of the two individual properties, which captures the essence of how clear (transmissive) is the cover as well as how absorbing is the absorber in the same system. Figure 5.5.1 in the D&B book schematically shows the reflection and absorption of light occurring at different material interfaces in a cover-absorber system. Example 5.5.1 showing the calculation of the τα parameter is given below in a brief video.
Solution to Example 5.5.1 (5:10)
Transcript: Solution to Example 5.5.1 (5:10)
PRESENTER: This is example 5.5.1 from page 214 of the Duffie and Beckman text. The previous problem we just did was for a single cover system. This problem is about two covers. And the glass panes that make up this two-cover system have a KL of 0.0370 per pane. And the absorber of the system has an absorptivity or alpha equal to 0.90. If you're not familiar with my notation, a w with a slash means "with" and alpha's the absorptivity there. We are asked to find the tau alpha product. Let me just back up a bit so that I can make that clear as mud-- the tau alpha product at 50 degrees angle of incidence. So this problem, the best way to start it off is using figure 5.3.1 from the text, where you can find from that figure that the transmissivity at that incidence angle of 50 is simply 0.75. So that's an approximation using that figure. Then, the next really important piece of the puzzle is to look at figure 5.5.1. It has some footnotes, so look at footnote 2 of figure 5.5.1. And this figure gives a really great representation of what's happening inside of a cover absorber system, where the light is reflecting back and forth within the system and you're trying to figure out what the overall transmissivity and absorptivity product is. So from that footnote, we can see that with a KL of 0.0370, rho sub d, the reflectivity. sub d is 0.22. So that's pretty important. Once we know those two pieces, this 0.75 and 0.22, we can then use equation 5.5.1 to calculate the tau alpha product using these values. So what you end up with is 0.75 times 0.90, which is the absorptivity, divided by 1 minus 1 minus 0.90 times 0.22, all of that in the denominator. And so you get a tau alpha product when you crunch those numbers of 0.69. And this is essentially a property of the overall system. It's not simply the product of tau times alpha. It's a little bit more involved and it has to do with the inter-reflections within the system, as well. But this is a very useful metric to help assess one system against another in light of the transmission properties and the absorption properties of the materials in the system. So thanks for listening. This has been example 5.5.1 from the text.
Self Check:
1. True or False? The reflectance of the glass surfaces increases with increasing angle of incidence
Correct! - increasing angle of incidence means "flatter" beam, which would be reflected off the surface more readily.
Incorrect :( Increasing angle of incidence means "flatter" beam, which indeed would be reflected off the surface more readily - that is the reflectance will increase.
2. What two types of losses should we consider in calculations of transmittance of cover materials?
ANSWER: (1) Reflection losses and (2) Absorption losses
2.4 Assignment
2.4 AssignmentThis homework assignment consists of six quantitative problems that are closely tied with the readings. Of course these six problems selected from the D&B textbook do not make a complete assessment of how well versed you are with radiation property calculations, but they are good teasers challenging you to apply some of the key equations you see in the book. In that sense it is more of a learning activity rather than an assessment. The videos posted in the previous sections of this lesson give you an example how to approach this kind of calculations.
Deliverable - Lesson 2 Assignment
Problems: 3.1, 3.2, 4.1, 5.1, 5.2, and 5.3 from the D&B textbook (see Appendix A)
I ask you to complete these problems by hand, clearly showing your work step by step. While you should feel free to use any calculation software or spreadsheets behind scenes, I will only read and grade your hand-written solutions. The recommended format for hand-written problems should include underlined statements of:
- knowns
- assumptions
- properties to find
- analysis (including what equations used, numbers, and units)
- solution (please draw a box around your final answer)
A sample hand-written problem is given in the Lesson 2 Module in Canvas.
Please create electronic images of your hand-written solutions (via scan or camera) and save them in a single PDF document. If you have series of images of your pages, you can first insert them into a MS Word document in proper order, and then save the file as PDF. Please note that It is your responsibility to make your submission legible. If I cannot read it, how can I give you credit?
The assignment is due by 11:55PM on Wednesday. Please see the Calendar in Canvas for specific due dates.
2.5 Summary and Final Tasks
2.5 Summary and Final TasksSummary
Materials for optocaloric performance vary significantly in physical properties. Additionally, new materials are being developed worldwide. Table 4.7.1 (in D&B book) gives an overview of some of the most common materials used for solar thermal reflection and absorption. However, in current project proposals in many settings, new materials will be used. It is important to be able to think critically about the physical behavior of materials in a broad sense so that new or unfamiliar materials can be put into perspective against available materials. Reading materials in this lesson provide you with the fundamental theory for material selection, which can be further used for practical purposes.
Reminder - Complete all of the Lesson 2 tasks!
Please double-check the to-do list on the Lesson 2 Introduction page to make sure you have completed all of the activities listed there before you begin Lesson 3.
Lesson 3: Flat Plate Collector Systems
Lesson 3: Flat Plate Collector SystemsThe links below provide an outline of the material for this lesson.
3.0 Introduction
3.0 IntroductionI take great pleasure in saying that after a thorough trial extending over a year and a half, our solar heater continues to give just as much satisfaction as when first installed. I am ready to admit that [at first] we were unreasonably prejudiced against the heater, and feel that refusing to let you install one in my house for so long a time after you first approached me upon the subject, we lost a great deal of comfort and convenience.
Flat plate collector systems are a very robust technology. With no moving parts, the conversion of solar radiation to heat in a working fluid can be very reliable with simple heat exchanger technology and, essentially, plumbing. Some systems that are configured at higher pressures than what is near ambient pressure can be at risk for leaks at joints in and between the system components due to the pressure difference and, in general, system leaks are the most common mode of failure. Performance and efficiency of various collectors, collector types, and system types can impact capital and operating costs that would be different in different locations based on climate and the subsequent energy losses associated with different technologies in different environments.
Learning Objectives
- Recognize the main components and layers of flat plate collectors.
- Define the main parameters used to characterize the flat plate collectors
- Apply efficiency, performance, and energy balance equations to a flat plate system
- Understand how the flat plate collector performance is tested in practice
What is due for Lesson 3?
This lesson will take us one week to complete. The list of assignments for this lesson is provided in the table below. More detailed instructions are given on respective pages of this lesson and in Canvas modules.
| Tasks | Assignment Details | Access/Directions |
|---|---|---|
| Readings | Required
Supplementary
| Registered students can use the following link to access the online textbook through the University Library. |
| Assignment | Problem set from D&B - Calculation of Flat Plate Collector parameters | Specific directions for the assignment are provided on the respective page of this lesson. |
| Quiz | 10 multiple choice questions based on lesson readings | Registered students can access the quiz in the Lesson 3 Module in Canvas. |
| Discussion | Cover and absorber materials review | Read directions to this discussion and post you reflection in Lesson 3 Module in Canvas. |
Please refer to the Course Calendar in Canvas for specific time frames and due dates.
Questions?
If you have any questions, please post them to our Questions and Answers discussion forum in Canvas. I will check that discussion forum daily to respond. While you are there, feel free to post your own responses if you, too, are able to help out a classmate.
3.1 Overview of Flat Plate Collectors
3.1 Overview of Flat Plate CollectorsThe flat-plate solar collectors are probably the most fundamental and most studied technology for solar-powered domestic hot water systems. The overall idea behind this technology is pretty simple. The Sun heats a dark flat surface, which collect as much energy as possible, and then the energy is transferred to water, air, or other fluid for further use.
These are the main components of a typical flat-plate solar collector:
- Black surface - absorbent of the incident solar energy
- Glazing cover - a transparent layer that transmits radiation to the absorber, but prevents radiative and convective heat loss from the surface
- Tubes containing heating fluid to transfer the heat from the collector
- Support structure to protect the components and hold them in place
- Insulation covering sides and bottom of the collector to reduce heat losses

The flat-plate systems normally operate and reach the maximum efficiency within the temperature range from 30 to 80 oC (Kalogirou, 2009), however, some new types of collectors that employ vacuum insulation can achieve higher temperatures (up to 100 oC). Due to the introduction of selective coatings, the stagnant fluid temperature in flat-plate collectors has been shown to reach 200 oC.
Probing question
- What are the typical materials used for absorber plates and glazing covers?
We partially discussed material choices and properties in Lesson 2. However, you are encouraged to look wider and review the current innovations in the flat-plate designs. For the discussion in this lesson, you will be asked to share what you found during your search and describe the state of the art materials that help increase collector performance.
Some advantages of the flat-plate collectors are that they are:
- Easy to manufacture
- Low cost
- Collect both beam and diffuse radiation
- Permanently fixed (no sophisticated positioning or tracking equipment is required)
- Little maintenance
Flat-plate collectors are installed facing the equator (i.e. South oriented in the Northern hemisphere and North oriented in the Southern hemisphere). The optimal tilt of the collector plate is close to the latitude of the location (+/- 15o). If the application is solar cooling, the optimum installation angle is Latitude - 10o, so that the solar beam is perpendicular to the collector during summertime. If the application is solar heating, the optimum installation angle is Latitude + 10o. It was found however, that for year-round hot water application, the optimum angle is Latitude + 5o, which provides somewhat better performance during winter, when the hot water is more needed (Kalogirou, 2009)
Transport fluid options
The flat plate collectors can involve liquid or air heat transport.
Water is one of the common options as liquid fluid due to its accessibility and good thermal properties:
- It has a relatively high volumetric heat capacity
- It is incompressible (or almost incompressible)
- It has a high mass density (which allows using small tubes and pipes for transport)
One disadvantage of water is that it freezes during winter, which can damage the collector or piping system. This can be managed by draining down the collector at low solar inputs (below a critical insolation threshold). Drain down sensors are often employed to monitor the system and to ensure complete draining, as pocket water freezing can cause damage. Refilling the system with water on the next morning also is not perfect. Possible air pockets in the collector can be a problem, blocking water flow and decreasing system efficiency (Vanek and Albright, 2008).
Antifreeze mixtures can be used instead of pure water to alleviate the above-said problems. The common antifreeze components are ethylene glycol or propylene glycol. Those chemicals are mixed with water require closed-loop systems and proper disposal due to toxicity. Nominal antifreeze service like is about 5 years, after which it needs to be replaced.
Air can be used as transport fluid in some designs of flat -plate collectors. This option is better suited to space heating applications or crop drying. A fan is usually required to facilitate air flow in the system and efficient heat transport. Certain designs can provide passive (no fan) movement of air due to thermal buoyancy.
Phase-change liquids can also be used with flat-plate collectors. Some refrigerants are included in this group of fluids. They do not freeze, which eliminates troubles explained above for water, and, due to their low boiling point can change from liquid to gas as temperature increases. Those fluids can be practical in settings where quick response to rapid temperature fluctuation is needed.
Collector construction
The key considerations in flat plate collector design are maximizing absorption, minimizing reflection and radiation losses, and effective heat transfer from the collector plate to the fluids. One of the important issues is obtaining a good thermal bond between the absorber plate and changes (tubes or ducts containing the heat-transfer fluids). Different construction designs (shown below) try to address this issue.

The plate - channel assembly may use a variety of methods of component attachment - thermal cement, solder, clips, clamps, brazing, mechanical pressure applicators. One of the considerations in choosing the assembly method is cost of labor and materials.
Next, we are going to look at the energy transfer and balance within the flat-plate collector.
References:
- Kalogirou, S.A., Solar Energy Engineering, Elsevier, 2009
- Vanek, F.M, and Albright, L.D., Energy Systems Engineering, McGraw Hill, 2008.
3.2 Energy Balance in Flat-Plate Collectors
3.2 Energy Balance in Flat-Plate CollectorsA fundamental concept for thermal analysis of any thermal system is the conservation of energy, which can be analyzed through energy balance calculation under steady state conditions. In steady state, the useful energy output of the collector is the difference between the absorbed solar radiation and the total thermal losses from the collector
Useful energy = Absorbed solar energy - Thermal losses
Obviously, the higher the useful energy output from a particular design, the higher the expected efficiency. Thermal efficiency of the collector is an important parameter to consider in this kind of analysis as it creates the basis for comparison of different materials and modifications of collector systems. So many theoretical calculations presented in the books (as well as in this Lesson), are eventually aimed at evaluating efficiency.
Let us define the thermal efficiency (η) first, as it will be the focus and final destination of this chapter.
where Qu is the useful energy output from a collector, GT is the incident solar radiation flux (irradience), and Ac is the collector area. So the denominator here is the total energy input for the collector. In this formula the GT is the parameter characterizing the external conditions, and it is usually known from practical measurements (with a pyranometer) or assumptions for a specific location. The collector area is a set technical characteristic. So the main question here is how to estimate the Qu - the useful energy.
As was mentioned above, to find how much energy remains available for useful thermal work, we need to understand the energy balance within the collector: absorbed energy - losses.
The energy balance can also be expressed via the following key equation:
where S is the absorbed solar radiation, UL is the total losses, Tplate is the temperature of the absorbing plate, and Tambient is the temperature of the air, and Ac again is the area of the collector surface.
This equation stands as a cornerstone of the energy balance analysis presented in Chapter 6 of Duffie and Beckman's textbook. To implement this question, we need to understand how the quantities S and UL can be obtained. The most complete explanation can be found in the following reading.
Reading Assignment
Look through the following section of the D&B textbook to understand the ways to estimate the absorbed radiation S on a collector surface
Duffie, J.A., and Beckman, W.A., Solar Engineering of Thermal Processes, Wiley and Sons, 2013, Chapter 5, Section 5.9 (3 pages).
Equations (5.9.1) and (5.9.3) in the above reading provide the basis for estimating absorbed radiation depending on what initial information on incident radiation is available.
In a general case, when measurements of incident solar radiation (IT) are available, the convenient approximation for the absorbed energy is given by:
where (τα)av is the product of transmittance of the collector cover and absorptance of the plate averaged over different types of radiation. In fact, (τα)av ≈ 0.96(τα)beam based on practical estimattions.
Now let us see how the radiation losses can be determined. Please refer to the following reading.
Reading Assignment
Duffie, J.A., and Beckman, W.A., Solar Engineering of Thermal Processes, Wiley and Sons, 2013, Chapter 6, Sections 6.1-6.4 (18 pages).
These sections of the book explain the model and assumptions for flat-plate collector analysis. The thermal losses are specifically addressed in Section 6.4, and you are welcome to dig through the complete derivation and examples. Of practical interest are the charts in Figure 6.4.4 which describe the results of the model calculations of thermal loss coefficient versus plate temperature.
Another useful outcome from this chapter is the empirical equation (6.4.9), which offers an algebraic method of finding the losses from the top of the collector. You will have a chance to look closer at this equation and see how it works further in this lesson activity.
Now as the absorbed radiation and losses are defined, the useful energy gain can be determined via the energy balance equation given above.
3.3 Flat Plate Collector Performance and Characterization
3.3 Flat Plate Collector Performance and CharacterizationThe maximum possible useful energy gain can be achieved when the collector is at the same temperature as the inlet fluid. In this case, the heat losses are minimized. However, in an actual operation setting, this is not always the case. To describe the effective (actual) useful energy gain via heat exchange, we should introduce the heat removal factor - FR
This coefficient shows how much energy remains after heat losses to the surrounding due to collector and inlet temperature difference. Therefore, the energy balance equation for the actual system can be written as follows
This equation reminds us the energy balance equation discussed in the previous page of this lesson, only with the FR factor. This flow factor depends on the mass flow rate of the fluid and heat capacity, and you can learn more details about the flow factor and practical application of the above equation from the following reading.
Reading Assignment
Duffie, J.A., and Beckman, W.A., Solar Engineering of Thermal Processes, Wiley and Sons, 2013, Chapter 6, Sections 6.7 (4 pages).
The theoretical models and calculations described in the D&B textbook can be checked in practice by performing collector tests. As new materials and new collector designs appear on market, there is a need for standardized testing procedure, and metrics, which would allow clear comparison and assessment if a collector performance is good or not so good.
The basic method of assessment of collector performance is to expose the system to solar radiation, run the fluid through it, and measure the inlet and outlet temperature along with the flow rate. Then the useful energy gain can be calculated from the experimental data as follows
In addition the incident radiation on the collector (GT) and ambient temperature (Ta) can be recorded, so we can express the useful gain in terms of incident radiation:
and further the experimental efficiency of the system at each instant of operation can be obtained:
To see how the collector test data and efficiency look like in practice, please refer to the following reading:
Reading Assignment
Duffie, J.A., and Beckman, W.A., Solar Engineering of Thermal Processes, Wiley and Sons, 2013, Chapter 6, Sections 6.15-6.18 and 6.23 (16 pages).
Make sure to complete all the assigned reading in this lesson and take the reading quiz.
3.4 Assignment
3.4 AssignmentThis homework assignment consists of two quantitative problems that are closely tied with the readings. Please study examples in Chapter 6 (D&B book) as they can be especially helpful in developing the solutions.
Deliverable - Lesson 3 Assignment
Problems: 6.1 and 6.12 from the D&B textbook (see Appendix A)
Again I ask you to complete these problems by hand, clearly showing your work step by step. While you should feel free to use any calculation software or spreadsheets behind scenes, I will only read and grade your hand-written solutions. The recommended format for hand-written problems should include underlined statements of:
- knowns
- assumptions
- properties to find
- analysis (including what equations used, numbers, and units)
- solution (please draw a box around your final answer)
A sample hand-written problem is given in the Lesson 2 Module in Canvas.
Please create electronic images of your hand-written solutions (via scan or camera) and save them in a single PDF document. If you have series of images of your pages, you can first insert them into a MS Word document in proper order, and then save the file as PDF.
The assignment is due by 11:59 p.m. (Eastern Time) on Wednesday. Please see the Calendar in Canvas for specific due dates.
3.5 Summary and Final Tasks
3.5 Summary and Final TasksSummary
Flat plate collectors come in various shapes, sizes, materials, and configurations. This type of collectors represent a good model for understanding the energy balance and system performance.The basic principle of absorbing as much solar radiation as possible (via black absorptive surfaces) while minimizing losses to the surrounding environment as much as possible (via glazing surfaces, insulation, and vacuum tubes) can be accomplished by various technologies trading off the level of performance and material and manufacturing costs. Being able to discern between flat plate technologies for different applications and locales based on the underlying physics is a valuable skill to have.
Reminder - Complete all of the Lesson 3 tasks!
Please double-check the to-do list on the Lesson 3 Introduction page to make sure you have completed all of the activities listed there before you begin Lesson 4.
Lesson 4: Concentrating Collector Systems
Lesson 4: Concentrating Collector SystemsThe links below provide an outline of the material for this lesson.
4.0 Introduction
4.0 IntroductionWe’re trying to figure out how big the problem is and what we can do to minimize bird mortalities.
Solar concentration is the most cost effective way to achieve sufficiently high temperatures for generating steam for useful work. Concentration of solar radiation is acheieved by using an optical device between the source and absorber, and that allows to decrease the effective area of the absorber and associated radiative energy losses. As such, concentrating collectors are advantageous when high temperatures are needed. The one remaining caveat is that concentrating technologies typically rely on the direct normal irradiance component of the solar resources. Hence, locations with regularly clear skies and high levels of direct radiation (such as the southwest US and southern Spain) are best suited for concentrating solar power.
Learning Objectives
- Recognize various configurations of solar concentrators
- Calculate concentration ratios for concentrating collectors
- Analyze the optical characteristics of non-imaging optics.
- Compare thermal performance of concentrating systems.
What is due for Lesson 4?
This lesson will take us one week to complete. The list of assignments for this lesson is provided in the table below. More detailed instructions are given on respective pages of this lesson and in Canvas modules.
| Tasks | Assignment Details | Access/Directions |
|---|---|---|
| Readings | Required:
Supplementary:
| Registered students can use the following link to access the online textbook through the University Library. |
| Assignment | Problem set from D&B - calculation of concentrating collector characteristics | Specific directions for this Assignment are provided on the respective page of this lesson. |
| Quiz | 10 multiple choice questions based on lesson readings. | Registered students can access the quiz in the Lesson 4 Module in Canvas. |
| Discussion | New ideas for developing cost-effective concentrating collectors (Sunvapor case) | Please read directions and post your reflection in Lesson 4 Discussion in Canvas. |
Questions?
If you have any questions, please post them to our Questions and Answers discussion forum in Canvas. I will check that discussion forum daily to respond. While you are there, feel free to post your own responses if you, too, are able to help out a classmate.
4.1 Overview of Concentrating Collectors
4.1 Overview of Concentrating CollectorsThere are many different types of configurations of solar concentrators, ranging from cylindrical that focus on a line (tube) to circular that focus on a point (power tower). As was already mentioned, the main purpose of these configurations is to increase the radiation flux on the receiver, and that effect is achieved through reflection of light from multiple anlged or curved mirror surfaces. Figure below provides schematics of several common types of concentrating collectors.
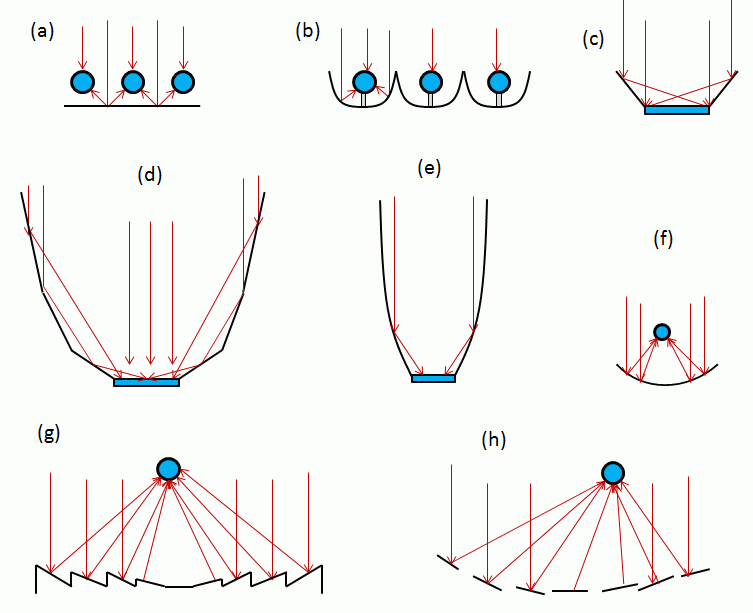
The light concentration process is typically characterized by the concentration ratio (C). By physical meaning, the concentration ratio is the factor by which the incident energy flux (Io) is optically enhanced on the receiving surface (Ir) - as shown in the Figure below. So, by confining the available energy coming through a chosen aperture to a smaller area on the receiver, we should be able to increase the flux.

The ratio of area of the receiver to the area of the aperture, Cgeo = Ar/Aa is called the area concentration ratio (in some sources also called geometric concentration ratio). It is easy to use, as the areas of the devices are known, although it is adequate only when the radiation flux is uniform over the aperture and over the receiver. Also, please note that for some imaging concentrators, the area of the available receiver surface can be different from the area of the image produced by the concentrator on the receiver. So, if the image does not cover the entire surface of the receiver, we need to use the image area to estimate the concentration ratio.
The concentration ratio can be also represented by the energy flux ratio at the aperture and at the receiver. In this case, it is termed flux concentration ratio Copt (in some sources - optical concentration ratio) and can be directly applied to thermal calculations.
In case the ambient energy flux over the aperture (insolation) and over the receiver (irradiance) is uniform, the geometric and optical concentration ratios are equal (Cgeo = Copt).
The concentration ratios are important metrics used to characterize and rank optical concentrators. There is a theoretical limit to solar concentration. For circular concentrators - 45,000, and for linear concentrators - 212, based on the geometrical considerations; however, these limits may be unreachable by real systems because of non-idealities and losses. In general sunlight, concentration systems are roughly classified into: low concentration range (C<10), medium concentration range (10<C<100), and high concentration range (C>100). However, only some of the systems provide uniform concentrated light flux (e.g., V-troughs or pyramidal plane reflectors) and can be characterized by a single concentration ratio. Many systems with curved reflecting surfaces (e.g., conical, parabolic, spherical) create a distribution of flux density over the receiver and would rather be characterized by a variable C over the receiver width. In that case, a local concentration ratio (Cl) is the main parameter to characterize the performance of the ideal concentrator:<100),>
where I(y) is determined for any local position y from the center of the produced image, and Iap is the intensity of the incident radiation at the aperture.

In many typical cases of imaging concentrators, the reflectance of the surface (ρ), i.e., the fraction of light radiation reflected from the surface compared to the total incident radiation, is also taken into account. Then the local intensity of the concentrated light, I(y), can be described as follows:
Next we are going to refer to the following text to learn more about the optical and thermal performance of concentration collectors.
Reading assignment
Book chapter: Duffie, J.A. Beckman, W., Solar Engineering of Thermal Processes, Chapter 7: Sections 7.1-7.4.
4.2 Non-Imaging Concentrators
4.2 Non-Imaging ConcentratorsNonimaging concentrators are called "non-imaging" because they do not produce any optical image of the source, as opposed to imaging concentrators, which produce an image of the sun by reflecting it on the receiver. The non-imaging concentrators are able to reflect to the receiver all of the incident radiation, either beam or diffused, intercepted over a wide range of incidence angles. These systems are not precise, but they are more flexible. For example, if the right hand side of the sun is reflected to the left hand side of the receiver, the image of the sun is not preserved while the total energy incident on the aperture of the concentrator is additive. The most commonly used technology that leverages nonimaging optics is the compound parabolic concentrator (CPC).
The typical concentration ratios of CPCs are in the single digits. Despite the low concentration ratios of nonimaging systems, nonimaging systems can be very useful for increasing the performance of systems are relatively low costs, particularly in regions where the solar resource is less than ideal for concentrating systems to begin with (such as most of Europe and the northeast of the US).
The following reading describes in detail the optical principles and energy paths in the CPC collectors.
Reading assignment
Book chapter: Duffie, J.A. Beckman, W., Solar Engineering of Thermal Processes, Chapter 7: Sections 7.6-7.8.
4.3 Imaging Concentrators
4.3 Imaging ConcentratorsImaging concentrators are used to achieve the highest temperatures that are currently achievable with a solar thermal system. Imaging concentrators enable a very large aperture area with a small absorber area, effectively reducing thermal losses at high temperatures. Ray tracing is used to evaluate such concentrating collectors during the design process. By (often digitally) drawing careful geometric reflections within a concentrating collector system, the distribution and angles of incidence of radiation on the absorber can be determined. This is a useful tool for both imaging and nonimaging concentrators, and can be used to show how active tracking systems on imaging concentrators (where the incident radiation is always perpendicular to the aperture) enable a much wider aperture with reduced reflectors compared with nonimaging systems. The typical concentration ratios of the currently existing large-scale systems that are using imaging concentrator technology (Ivanpah, SEGS, etc.) range from in the tens to as high as the low to mid hundreds.
Parabolic imaging concentrators are probably the most studied, both analytically and experimentally. To understand how these collectors are designed, it is necessary to understand the geometric properties of a parabola.
When light is reflected from the parabolic mirror onto a receiver to produce the optical image, the main parameters considered in the energy analysis are image size (width) and intensity of radiation within that image. Various models and examples of estimating those parameters are provided in the following reading.
Reading assignment
Book chapter: Duffie, J.A. Beckman, W., Solar Engineering of Thermal Processes, Chapter 7: Sections 7.9 - 7.10.
After you complete all assigned reading in this lesson, please take the reading quiz in Canvas (Lesson 4 module)
4.4. Assignment
4.4. AssignmentThis homework assignment consists of two quantitative problems that are closely tied with the readings. Please study examples in Chapter 7 (D&B book) as they can be especially helpful in developing the solutions.
Deliverable - Lesson 4 Assignment
Problems: 7.2 and 7.6 from the D&B textbook (see Appendix A)
As was requested in previous lessons, please complete these problems by hand, clearly showing your work step by step. While you should feel free to use any calculation software or spreadsheets behind scenes, I will only read and grade your hand-written solutions. The recommended format for hand-written problems should include underlined statements of:
- knowns
- assumptions
- properties to find
- analysis (including what equations used, numbers, and units)
- solution (please draw a box around your final answer)
A sample hand-written problem is given in the Lesson 2 Module in Canvas.
Please create electronic images of your hand-written solutions (via scan or camera) and save them in a single PDF document. If you have series of images of your pages, you can first insert them into a MS Word document in proper order, and then save the file as PDF.
The assignment is due by 11:59 p.m. (your local time) on Wednesday. Please see the Calendar in Canvas for specific due dates.
4.5. Summary and Final Tasks
4.5. Summary and Final TasksSummary
Concentrating solar power is a very useful tool that enables reaching high temperatures in solar energy conversion systems. Without concentration, the generation of electricity by conventional steam turbines using energy directly from the sun would not be cost effective. Optical concentration proves to be very advantageous since it reduces thermal losses and increases the useful energy gain.
Reminder - Complete all of the Lesson 4 tasks!
Please double-check the to-do list on the Lesson 4 Introduction page to make sure you have completed all of the activities listed there before you begin Lesson 5.
Lesson 5: Thermal Fluids
Lesson 5: Thermal FluidsThe links below provide an outline of the material for this lesson.
5.0 Introduction
5.0 IntroductionImagine that thermal fluid plays the same role in plant processes as blood in the human body. It is thus inextricably linked to the optimum functioning of the entire system; if cholesterol deposits congest arteries, then that directly affects the heart, which unfortunately leads to the organism shutting down.
Thermal fluids are used to move heat through a system. A system could be composed of solar collectors, storage tanks, heat exchangers, valves, pipes, and more. Through all of these components flow a fluid that carries the heat from one point to another within the system. In a heat exchanger, one fluid flows next to another fluid (e.g., air and water) and heat flows from the hotter fluid to the colder fluid (e.g., from a hot air stream to cold water, effectively cooling the air). In a storage tank, the fluid holds the heat and waits to be pumped to where the heat can be used. In a solar collector, the fluid passes through a tube (or pipe) that is either joined to black, radiation absorbing fins (flat plate collector) or contained within a vacuum glass tube (parabolic troughs) or a combination of both (evacuated tube collector). Selecting a thermal fluid requires knowledge of the physical properties of each fluid under different thermal conditions.
Learning Objectives
- Describe the available and developing thermal fluids used in solar thermal energy systems.
- Discuss relevant issues (i.e. cost, corrosivity, etc.) associated with available and developing thermal fluids.
- Apply thermal conductivity calculations.
- Apply heat capacity calculations.
- Select the proper working fluids for various applications.
What is due for Lesson 5?
This lesson will take us one week to complete. The list of assignments for this lesson is provided in the table below. More detailed instructions are given on respective pages of this lesson and in Canvas modules.
| Tasks | Assignment Details | Access/Directions |
|---|---|---|
| Readings | Required:
Supplementary:
This report presents a detailed heat transfer model for tubular absorber system and also includes equations and calculations for heat transfer to heat trasnfer fluids. It is a nice resource to supplement the theory from the D&B book. | All reading materials for this lesson can be accessed online via links provided. |
| Assignment | Comparative assessment of heat transfer fluids | Specific directions are provided on the respective page of this lesson. |
| Quiz | Take the Lesson 5 Reading Quiz. | Registered students can access the quiz in the Lesson 5 Module in Canvas. |
| Discussion | What makes a thermal fluid the top choice for solar project managers? | Please read directions and post your reflection in Lesson 5 Discussion in Canvas. |
Questions?
If you have any questions, please post them to our Questions and Answers discussion forum in Canvas. I will check that discussion forum daily to respond. While you are there, feel free to post your own responses if you, too, are able to help out a classmate.
5.1. Overview of Solar Thermal Fluids
5.1. Overview of Solar Thermal FluidsSolar thermal fluids (or heat-transfer fluides - HTF) come in six primary groups:
- Oil-based
- Water-based
- Molten salts
- Air
- Refrigerants
- Silicones
Each type of heat transfer fluid has advantages and disadvantages with respect to different types of solar thermal energy conversion systems. Oil, water, or molten salts can all be used in Parabolic Trough and Linear Fresnel collector systems, while only molten salt and water (oil is excluded here) in addition to the option of air can be used in a power tower system. Parabolic trough systems are the most widely installed type of system worldwide, at 90% of systems installed by the end of the year 2013 (source: iea.org). Refrigerants and silicones are rarely used in flat plate systems and are not used in concentrating systems for various reasons discussed later.
Oil-based fluids come in three categories; synthetic hydrocarbons, paraffin hydrocarbons, and aromatic refined mineral oils. Water based fluids can be either pure water or a water and glycol mixture with either ethylene or propylene glycol which are types of “antifreeze”. Molten salts are nitrate (ionic) salts that are only available in concentrating systems due to the high temperature requirements of the fluid. Air is standard air, comprised mostly of nitrogen and oxygen, useful for specific applications such as a drying industrial process or low grade heating of building spaces. Refrigerants are commonly used in refrigerators, air conditioners, and heat pumps, but are not commonly used in solar thermal systems today. Silicones can be either synthetic or organic, but are also not commonly used in solar thermal systems today.
There are seven key properties of a thermal fluid for solar application that must be understood before engaging in design work or decision-making regarding thermal fluid performance and/or selection. The properties include:
- Maximum temperature is the highest temperature before the fluid begins to break down or decompose. The hottest parts of a system are where this maximum temperature is most probable, and therefore must be carefully designed for those key points in the system. The critical locations include the center of any absorbing tubes in the solar collectors or at the auxiliary heater/boiler.
- Freezing temperature is the coldest temperature before the fluid changes phase into a solid, and cannot be pumped, potentially causing irreversible damage to system components. In the case of each fluid, additional properties such as the expansion of the fluid when it freezes are important when determining the potential impact of freezing.
- Density is the mass per unit volume and is temperature dependent. Density can change drastically for some fluids as they heat up. For example, hydrocarbon oils can have a ~30% decrease in density when increased from 25 degrees C to 390 degrees C.
- Steam pressure is the pressure required to prevent the fluid from changing state to a gas. At higher pressures, the temperature at which the heat transfer fluid changes phase from a liquid to a gas (steam) is also higher.
- Specific heat is measured in units of energy (J) per mass (kg) temperature (K) and represents the amount of energy required to raise the temperature of the heat transfer fluid per unit mass. For example, if a fluid had a specific heat of 2300 kJ/kgK, that fluid would require the supply of 2300 kJ of energy to raise one kg of the fluid by one degree Kelvin (Celsius). This parameter is very useful for energy and mass balance calculations.
- Enthalpy is measured in units of energy (J) per mass (kg), representing the energy contained in the fluid under specific conditions such as temperature.
- Viscosity is a fluid’s resistance to shear stress; essentially a measure of how much pumping force is required to move the fluid in a constrained environment. Viscosity can change greatly with temperature for some fluids. Lower viscosities are preferred to reduce pumping costs.
Learn more about the types and properties of common heat-transfer fluids in the following readings:
Reading assignment
- Heat Transfer Fluids for Solar Water Heating Systems, U.S. Department of Energy, URL: http://energy.gov/energysaver/heat-transfer-fluids-solar-water-heating-systems, Accessed 2016.
- L. Moens and D.M. Blake, Advanced Heat Transfer and Thermal Storage Fluids (pdf), National Renewable Energy Laboratory, Conference Paper CP-510-37083, January 2005.
(Source: http ://www.nrel.gov/docs/fy05osti/37083.pdf)
5.2. Applications of Various Fluids
5.2. Applications of Various FluidsCons and pros of various heat-transfer fluids
Most notably, molten salts bring a high level of corrosion with them. Additionally, molten salts must be kept above their freezing temperature in pipes running to and from collectors or must be drained back from the system components into a holding tank which is configured to deal with the solidification (freezing) of the salt. There has long been a search for molten salts that remain liquid at room temperature, as described briefly in the Advanced Heat Transfer and Thermal Storage Fluids article from the reading. Such salts are anticipated to be low in cost and their high thermal stability (resistance to flammability) makes them very desirable for high temperature applications where alternatives such as oil are highly flammable.
Water-based fluids, such as glycol solutions, degrade over time and must be changed every 3-5 years. If a glycol fluid is subjected to very high temperatures, such as stagnation temperatures when a system is at capacity and the load is not using the heat in the summer, this degradation speeds up, further reducing the life of the fluid. In part, this is one driver for solar air conditioning systems as a way to use excess heat in the summer, increasing the life of the fluid while using free fuel (solar radiation). Pure water is subject to freezing in the winter, but is ideal (very low cost) for locations that do not experience freezing temperatures as well as systems that are equipped (adding additional capital cost) with a drainback tank to hold the water in a thermally controlled space during the times when the collector temperature is below freezing.
Oils are a great fluid for concentrating systems because of their high boiling point (>300 degrees C). With relatively low costs, low freezing points, and high thermal capacity compared to water or air, oils are the best choice for most concentrating systems and are used worldwide.
Some systems use refrigerants, which was discussed briefly above. Chlorofluorocarbon (CFC) refrigerants, such as Freon, have been used historically in some solar thermal systems, but have been phased out due to the negative effect of CFCs on the earth’s ozone layer when CFCs are vented to the environment (either intentionally or accidentally). The benefit of refrigerants is a low boiling point enabling the leveraging of the fluid’s phase change as well as a high heat capacity. CFC refrigerants can be replaced, with some system modifications, by methyl alcohol, ammonia, and more. Research is ongoing in this field.
Silicones is another group of fluids discussed briefly above. Silicones are still rare in solar applications. These fluids require more energy to pump than alternatives due to a high viscosity and they also tend to leak easily through microscopic holes in a solar thermal system. Silicones are interesting and will easily be researched further because of their noncorrosive nature and long lifetime (compared with the 3-5 years of oil).
Applications
Flat plate collectors that are intended for domestic hot water and space heating typically use a water-based heat transfer fluid, either pure water if the location is either not subject to freezing temperatures or if the system contains a drain-back tank, or a water/glycol (antifreeze) mixture.
Parabolic trough collectors typically used an oil based heat transfer fluid, though water and molten salt can both be used as well. When water is used, it is used to directly generate steam for use in a turbine or other steam application. Oil can achieve a higher temperature before boiling, thus increasing the efficiency of the collector.
Power tower systems often use molten salt as a fluid of choice. This is because the molten salt does not need to be pumped through a long series of tubes to pass by each collector. The fluid simply resides in the central boiler tank where all of the power tower mirrors are aimed. When the sun sets and the heat is used up, the molten salt freezes (solidifies) in the boiler tank, ready to be melted again when the sun comes up. This greatly reduces the complexities associated with the fluid solidifying inside a series of tubes across a large area with parts that may or may not be easily subjected to solar radiation or other heat sources to melt the salt the following day. Air is typically only used in flat plate collectors, but can also be used in power towers. Air is a good choice for applications such as food/textile drying or space heating.
Please look through the following presentation at the IEA CSP Workshop - it provides additional summary of application of different heat transfer fluids in various solar thermal systems:
Reading assignment
- F. Lenzen, IEA CSP Workshop, Schott Solar 03/03/2014. Access via URL: http://www.iea.org/media/workshops/2014/solarelectricity/FrankLenzenOverviewofParabolictroughslinearFresnekreceivers.pdf (PDF)
5.3. Pumping Power Considerations
5.3. Pumping Power ConsiderationsPumping energy is one piece of the puzzle that is important to consider. Pumping power is calculated as the volume of the fluid per unit time (flow capacity) times the density of the fluid times the gravitational constant times the pumping head (vertical distance to be pumped). Pumping energy is simply power multiplied across time. 100kW of power for one hour is 100kWh of energy. Units must be tracked carefully to ensure the correct answer. Friction within the pipe, particularly for pumping over horizontal distances, can be calculated using the Darcy-Weisbach equation (noted in the second video) to relate friction and fluid speed. The head loss due to friction, and as such the required pumping power, is proportional to the square of the fluid speed. As such, this is an important calculation because if your system is designed in a way that requires high pumping speeds, you will have very high pumping energy costs. Additionally, if you pump too slow, you risk damaging your fluid and system components because of high temperatures gained from the solar radiation and not moving that energy through the system, away from the collectors, fast enough. This optimization problem is key to designing a good system.
The video below explains how we can estimate the pumping power required to move the heat-transfer fluid in the system. This kind of calculations becomes handy when you need to determine the cost of using one or another type of fluid for a specific system design. So, watch and see what parameters of the system and fluid need to be taken into account.
Example of Calculating Pumping Power (6:19)
Transcript: Example of Calculating Pumping Power (6:19)
PRESENTER: OK, so this is going to be an example of pumping power. And we're going to use water for now. But essentially, the only difference is the density. So for this equation-- and so if you had a fluid that was denser or less dense, for example, like oil, it would be pretty comparable to this calculation. So power is equal to basically the volumetric flow per unit time times the density of the fluid, times earth's acceleration due to gravity-- acceleration due to gravity on earth, which is 9.81 meters per second, you may recall from physics class, potentially even in high school-- times the head of the pipe that you're in. The distance. And that's essentially it. And you have to just be careful of the units. So if, for example, we have fluid that's traveling 1 meter cubed per hour-- that's the volumetric flow rate-- and the density of our fluid is water, so 1,000 kilograms per meter cubed. And we know that g is 9.81 meters per second squared, acceleration. And let's pick a distance of 10 meters. We want to pump our fluid up 10 meters, essentially. What we end up with, 1 meter cubed per hour times the density is 1,000 kilograms per meter cubed-- and those cancel-- times 9.81 meters per second squared and-- oops. Meters did not cancel with anything yet. Sorry about that. And our distance is 10 meters. So you can see here in the numerator we have kilograms, meters squared, per second squared. There's kilograms, meters squared, per second squared. Kilogram, meters squared, per second squared is equal to a joule unit of energy. We also have time still in the denominator over here. So if we have joules per time, that's power, but we need a conversion factor. We need to say that one hour is 3,600 seconds. So then we can cancel hours, and we're left with seconds, and a joule per second. So a joule per second is equal to a watt. So we get it in watts if we do that. So when we multiply all of those pieces together-- handy-dandy calculator here. 1,000 times 9.81 times 10 meters, divided by 3,600. Divided by 3,600. That would be the error I just typed in my calculator. For all I know, you've actually already done this quicker than I have. You end up with 27.25 watts as your pumping power to achieve that flow rate of 1 meter cubed of fluid per hour. That's the continuous pumping power required to do that. So just real quick here. If we wanted to know the energy, say, over a four-hour period, 27 and 1/4 watts for four hours is 109 watt hours, or 0.11 kilowatt hours of energy. So in this case, we weren't pumping too fast. 1 meter cubed per hour is not that high of rate. We weren't pumping it very far either. Only 10 meters up against gravity. So it's pretty low-cost, low-energy result. But as you scale that up over, say, an entire multiple acres of collectors or whatever, you would definitely see high pumping costs. Thanks.
The example above shows how we can estimate the pumping energy for pumping fluid upwards over a certain vertical distance. The video below shows the case when the fluid moves through horizontal pipes, which is quite common of solar applications. How much energy would be needed in this case? Watch as see how this calculation is done using the Darcy-Weisbach equation.
Example Calculation of HeadLoss (8:20)
Transcript: Example Calculation of HeadLoss (8:20)
PRESENTER: So in the previous example, calculated the pumping energy and power requirements for pumping water up 10 meters. In most cases in a solar array, there's horizontal piping, not vertical piping. You're piping the fluid through the collector across a big horizontal surface area. So that still requires energy because of the friction in the pipe. So how do you translate that to an equivalent head loss, essentially? And we do this with the Darcy-Weisbach, which says-- let's see here-- Darcy-Weisbach equation, which says that the head loss due to friction is equal to Darcy friction factor, which can be looked up based on your various fluid parameters, such as the Reynolds number, whether your flows turbulent or laminar, things like that, times the length of your pipe. So if you're pumping it 1,000 meters, that would go there and then the internal diameter of your pipe. Oh, back to the Darcy friction factor, that also has to do with the roughness of the pipe. So if you have a very smooth pipe, then you would get a lower friction factor. Times the average velocity of the fluid squared. Divide by 2 times the acceleration on Earth, 9.81 meters per second squared. So you can see already that the head over here is-- h sub f, the thing we're calculating, is affected by the square of velocity, which shows that as speed increases in your fluid, you're going to have a much higher head lost, which from the previous calculation shows you have much higher energy. So if we have a Darcy friction factor of say, 0.2 and that's unitless and we want to say, do a pipe that's 1,000 meters long with an internal diameter of about an inch, 0.03 meters, we're going to do it for two different philosophies here. So let's say that the average velocity for the first round is 3 meters per second. And we know that g is 9.81 meters per second squared. And we plug all these values in-- 0.02 times 1,000 meters, diameter of 0.03 meters. Velocity is 3 meters per second squared. 2 times 9.81 meters per second squared. So you can see some of these units cancel out, meters, meters, seconds squared, seconds squared. We have meters squared, meters in the denominator, so we're going to end up with meters, because there's two meters up top, one below. So in the end, this is equivalent to units of meters. Once we crunch the numbers, times 1,000 divided by 0.03 times 3 squared divided by 2 divided by 9.81, we end up with 306 meters of head loss. So what this says is that one pipe that's 1,000 meters long and one inch in diameter at 3 meters per second has the same essentially energetic requirements as pumping fluid with no friction losses but straight up 306 meters vertically on Earth. For on the moon, it would take less energy, just as a side note, because the moon has 1/6 the gravitational constant. So it does matter these types of things, though I doubt you'll be installing a solar collector on the moon for now. But just a little side note there, all these little details do matter. And so let's see how this changes if instead of 3 meters per second average velocity, we have say, 1/2 a meter per second average velocity. So up here, this 3 would change to be 0.5 and we would run that calculation again. And we would get-- let's see here-- 0.2 times 1,000 times 0.5 squared instead of 3 squared divided by 2 and 9.81. Hold on. I forgot to divide by 0.3-- 0.03, I mean. There we go. That's a better number. There we get about 8.5 meters for the second version of this calculation. And so you can see that by reducing the flow speed to 0.5, we have much less head loss or much less pumping energy required. And so the implications of this are really that you can save a lot of energy by pumping slower. At the same time, in a solar thermal energy collection application, that means your fluid would get hotter a lot faster. And so it could be a good thing under certain circumstances and in others, it could be bad, because your fluid could be overheating if it's going too slow through your collector. So this becomes an optimization problem where you have to balance all these different things happening at once, the fluid flow, as well as the rate of energy being absorbed, as well as what those maximum temperature thresholds are for good operation of your system without damaging the fluid or any other components, as well. That's sort of a fine line that has to be walked to ensure that your system is working correctly. So hopefully, that gives you a little bit of an insight into that on a more technical level. And thanks for listening.
5.4. Assignment
5.4. AssignmentThermal fluids have several key properties that need to be carefully considered when selecting a fluid for a specific application. These properties include maximum temperature, freezing temperature, density, vapor pressure, specific heat, enthalpy, and viscosity. By performing calculations, one can save a significant amount of money that would otherwise be spent on trial and error experiments and extra equipment, which potentially can be avoided.
This assignment is a series of short analytical problems dealing with thermal fluid assessment. Some problems will require conceptual explanation and some will involved quantitative calculations.
Scenario:
There are two heat transfer fluids - oils that are similar in cost, quality, and expected lifetime. Here are their technical characteristics:
Oil A:
Tmax = 300°C
Tfreeze = -10°C
Cp = 1.7 kJ/kgK (specific heat)
ρ = 800 kg/m3 (density)
Oil B:
Tmax = 395°C
Tfreeze = 13°C
Cp = 2.3 kJ/kgK (specific heat)
ρ = 700 kg/m3 (density)
Range of reasonable Darcy Friction Factors:
0.01 > fd > 0.09 (for problem 3, use fd = 0.04)
Tin = 150°C
Tout = 280 oC
Answer the following questions:
- Which of the two fluids above should be used, and why, if the process requires a temperature of (a) 380°C, (b) 300 oC?
- If the system is required to output 2 MW of thermal energy, what should the mass flow rate (kg/hr) be with Oil A? What about with Oil B? (Hint: you can use equation 10.1.2 from the D&B book to develop this problem),
- Based on results from Question 2, for each of the two oils, calculate the flow speed (m/s) in a pipe with an inner diameter of 3 cm?
- What is the resulting pumping head loss for each fluid in a 200 m long collector pipe with Darcy Friction Factor of fd = 0.04?
- Based on results from Questions 3 and 4, calculate the pumping power required for each fluid’s head loss and associated annual costs of energy, considering rate $0.10/kWh and system's capacity factor of 20% over the year (i.e., it is pumping 20% of the time). Discuss the difference in pumping power (or cost) between the fluids.
List all your answers in the comparative table Oil A vs Oil B and include it in the end of your report.
Deliverable - Lesson 5 Assignment
The problems can be either typed (size 12 Times New Roman or equivalent font) or hand-written as scanned (like in previous lessons). Please submit your solutions in a single PDF file to Lesson 5 assignment dropbox in Canvas. Remember to show all key equations and analytical steps you take in your solution.
5.5. Summary and Final Tasks
5.5. Summary and Final TasksSummary
The main function of the thermal fluids is moving heat from the collector to the point of demand in STE systems. Solar thermal heat transfer fluids come in all types and densities (as opposed to shapes and sizes, since that’s not really possible with a fluid). The properties of each fluid make some fluids better for certain applications than others. Sometimes it is a challenge to choose one fluid over another with seemingly equal tradeoffs between the various options. In the end, reliability and historical track records that reduce the risk associated with any single fluid option are typically what steers decisions in the end. As new fluids are researched and developed, we must push forward with systems that use the current state-of-the-art fluids that are proven already.
Reminder - Complete all of the Lesson 5 tasks!
Please double-check the to-do list on the Lesson 5 Introduction page to make sure you have completed all of the activities listed there before you begin Lesson 6.
Lesson 6: Performance of Solar Thermal Collectors and Systems
Lesson 6: Performance of Solar Thermal Collectors and SystemsThe links below provide an outline of the material for this lesson.
6.0 Introduction
6.0 IntroductionInformed decision making via an integrative design process and iterative energy simulations (early and often) is crucial during the development of a building design.
This lesson introduces the concept of load and demonstrates how the fundamental heat transfer computations are applied to simple practical scenarios. In the previous lessons we focused on how the solar raditaion is converted to heat and how much useful gain is acquired from different collectors. Now we are moving into the applications zone. Let us see what kind of work that heat does next. You will have an opportunity to run a SAM model for a small scale solar heating system and see how the performance depends on different initial parameters and how it varies over time. Chapter 10 in D&B contains a number of example problems, which explain the behind-the-scene math for such modeling.
Learning Objectives
- Understand the concept of load.
- Apply themal calculation methods to find energy balance and efficiency of water heating systems
- Apply a simulation tool to a model solar thermal system.
- Analyze solar thermal system performance.
What is due for Lesson 6?
This lesson will take us one week to complete. Specific directions for different assignments are given in the table below and within this lesson pages.
| Tasks | Assignment Details | Access/Directions |
|---|---|---|
| Readings | Required:
Supplementary:
|
|
| Assignment | SAM model of a water heating system (based on D&B example, pp. ) | Specific directions for the assignments are provided on the Assignment page of this lesson. |
| Quiz | 10 multiple choice questions related to Lesson 6 readings | Registered students can access the quiz in the Lesson 6 module in Canvas. |
| Course Project | In lieu of discussion, this week think about the topic or scenario you would like to analyze in your Design Proposal for this course. | Share your proposed topic on the Project Topic discussion board in Course Project module in Canvas. Note: it is not final - the main goal is to start thinking in this direction and collect peer feedback. |
Questions?
If you have any questions, please post them to our Questions and Answers discussion forum in Canvas. I will check that discussion forum daily to respond. While you are there, feel free to post your own responses if you, too, are able to help out a classmate.
6.1. Load of Solar Thermal Systems
6.1. Load of Solar Thermal SystemsIn each solar energy system, there are supply and demand of energy, which, ideally, should be matched. The supply of solar energy depends on the available solar resource, the technology to convert solar radiation to the usable heat, losses, properties of materials, and system design. The energy demand depends on applications connected to the collectors - let it be water stoarge tank to be heated for domestic or industrial use, a space, a swimming pool, etc. Both supply and demand are time dependent. It is understandable that the solar energy varies on the daily basis, usually peaking during the day and diminishing over the night. The use of available energy also varies over time based on human activities or technical processes involved in the system. Here we use the term "load" to define a time-dependent energy need. Load is the amount of energy obtained from the source to do the work.
In a certain system, we can have a solar collector and another system - the auxiliary - to meet energy demand requirements. The solar system alone is not sometimes sufficient and requires such a backup to make sure the application in use does not run out of energy. The auxiliary can be represented by an on-site natural gas combustion system or grid, for example. Then the system load can be represented as:
L = Ls + La
with subscripts s and a standing for solar and auxiliary, respectively.
It is also useful to define the load rates (e.i. demanded power). The load rate is
L' = dL/dt
Note L' (rate) is denoted in the D&B book as L with a dot. Load rates are useful because the load are highly variable, and we may see times when the demands are met by solar energy and times when theya are met by auxiliar energy. The one important purpose of system modeling is to determine the hour-by-hour energy performance of the system, match it with loads, and decide how much auxiliary energy must be secured or purchased.
Here we can also define heating and cooling loads. Those depend on system thermal requirements. For example, if a building is too cold and requires some heating to meet a certain standard, then we deal with a heating load. On the contrary, if the building is too warm, due to internal gains and losses, then we deal with a cooling load, in other words we need to remove energy from the space.
How can loads be estimated?
Please refer to the following reading to understand what heat gains and losses should be taken into account and what equations can be used.
Reading assignment
Book chapter: Duffie, J.A. Beckman, W., Solar Engineering of Thermal Processes, Chapter 9.
This text explains more detail about the hot-water loads, space-heating and cooling loads. Also you will be introduced to such terms as degree-days, balance temperature, building loss coefficient, and building energy storage capacity.
One commonly used method for calculating the heating and cooling requirements of a building is to calculate degree days (DD) as discussed in Section 9.3 of the D&B textbook. The rate of energy transfer from the building to the exterior environment makes up a significant piece of the energy balance calculation. This rate of energy transfer is considered to be directly proportional to degree days. The following video (3:36) provides a brief explanation on the calculation of degree days, showing how the number of degree days is directly calculated by a difference in temperature over a period of time.
Solution to example 9.3.1 (3:36)
Transcript: Solution to example 9.3.1 (3:36)
OK, so this is a much shorter video than the last one, based on it example 9.3.1, which focuses on heating degree days. I just want to chat a bit about heating degree days, do one simple calculation, and talk about some of meaning behind it. So in this example, we're given a base temperature of 18 degrees Celsius and we're in Madison, Wisconsin. The example goes into much more detail on calculating heating degree days for different months, but at the real basic level we're going to calculate just December's here. Heating degree days are calculated simply by the number of days in the month and the base temperature and the month's ambient average temperatures, so t ambient bar is t average for the month. So for December, there's 31 days in the month, the base temperature's 18, and this is given a negative 5. It's pretty cold in Wisconsin. So what we end up with is 31 times 23.3, which is 722 heating degree days. So it's pretty high number. And again, I just want to chat a bit about what this means and why it's important. And essentially this number gives you an idea for how often you are far away from the reasonable temperature for your indoor space. So if it's really cold, then you'll get a high number, and that means you need to be heating a lot. Whereas, if your ambient temperature is close in temperature, if t ambient was 18 degrees right here, if this was 18 you get zero. Once you'd have zero. You would end up with zero degree days. So that means you don't need any heating that month if your month's average temperature was 18 degrees Celsius. So that's really the essence of what heating degree days are. And then in the summer months when you need cooling it goes the other way around where then you would end up with some degree days. If you're in a location that required cooling and they would be cooling degree days. So if your t ambient was very hot, then you would end up with a different number there as well. So again, that these numbers are used essentially to calculate overall heating cooling loads and how much a specific location would need in light of the ambient temperature. All right, thanks for listening.
6.2. Component and System Models
6.2. Component and System ModelsThe real-life solar energy systems are composed of a number of different components and units. Each of those components has specifics that require certain theoretical background and consideration. Several previous lessons introduced some theory behind those component models - heat transfer from the Sun to the collector; heat transfer from the collector to thermal fluid; concentration of solar radiation on optical devices, etc. While the basic calculations performed for those components can answer questions about what energy parameters can be output and what efficiency can be expected from each part of the system, the question still remains how those component models can be combined into a system model, that would allow optimization of the performance for a target application.
Overview of those component models is given in the first part of Chapter 10 if the D&B book. In these sections we can also read about the role of the heat exchangers, which provide interface between different components and allowheat transfer from one part of the system to another. Figure 10.2.1 from the D&B textbook shows a typical solar water heating system, containing a collector, heat exchanger, storage tank, pipes, and pumps. Throughout the system diagram, temperatures are noted. It is by these temperatures that the system component efficiencies can be calculated and subsequently integrated to find overall efficiency.
Reading assignment
Book chapter: Duffie, J.A. Beckman, W., Solar Engineering of Thermal Processes, Chapter 10, Sections 10.1-10.3.
These sections discuss the key parameters responsible for heat exchange between the system components. You can also quickly scan through Sections 10.4-10.8 to be aware of various conditional adjustments to component models.
"System models are assemblies of appropriate component models." When you put together the equations decribing each of the components into the system model, the simultaneous solving of all those equations may be a serious challenge. Sometimes it is advantageous to treat the systems of equations numerically, especially if some of them are non-linear. A number of computer simulation software have been developed to help with this task. Commonly, models cover annual cycle of system operation based on available meteorological data.
Thermal analysis performed for the whole system over significant period of time provide valuable information for assessing the economics of the project. There are a couple of useful parameters that we need to introduce here. The first one - solar fraction (f) is the ratio of the solar energy obtained by the system to the total load:
fi = LS,i /Li
where Ls is the amount of solar energy used in the load, and Li is the total load per unit of time.
Or in integrated form (over a year), the same concept will be expressed as annual solar fraction (F):
F = LS/L
The second parameter useful from economical standpoint is solar savings fraction (Fsav). It accounts for energy expenditures needed to run the solar system equipment (pumps, fans, controllers..) - so call "parasitic energy".
Fsav = F - (CefΔE)/L
where Cef is the ratio of cost of additional electricity for solar system operation to the cost of fuel; ΔE is the amount of required "parasitic" electric energy. Read more about these metrics in the following source:
Reading assignment
Book chapter: Duffie, J.A. Beckman, W., Solar Engineering of Thermal Processes, Chapter 10, Sections 10.9-10.11.
In this lesson activity you will be asked to estimate these factors for an example solar water heating system using SAM modeling.
Equilibrium and steady state are two very different thermal states, but both provide a way to analyze the thermal status of a system. Recall that an object in outer space absorbing solar radiation could be analyzed at thermal equilibrium to calculate the temperature of the object in light of the radiative heat loss and solar gain. A steady state energy balance is a similar method that is used to analyze heat transfer in light of system dynamics. The Alleyne and Jain article from the Mechanical Engineering magazine gives an overview of basic transient system modeling for thermal systems in light of the application of steady state energy balance. This method is how TRNSYS works, under the hood. Note that to simulate a thermal system, at steady state, the energy balance is calculated iteratively across time, and results in a time dependent solution. By calculating and tracking the energy through the system at each interface or sub-system, we can obtain the overall energy balance of the whole system. Careful accounting is required to calculate an accurate energy balance. All energy gain (heat transfer into the system) must equal all energy loss (heat transfer out of the system). When all energy is accounted for, we find a series of energy balance equations and can solve them simultaneously to calculate unknown temperatures, heat flow, and thermal properties.
Supplemental reading:
Journal article: Alleyne A. and Jain N., Transient Thermal System, Focus on Dynamic Systems and Control, 2014, pp. 4-12.
6.3. Assignment
6.3. AssignmentComputer energy modeling is often used to compare the performance and cost of system alternatives. While many software tools are available for various energy modeling applications, few offer a flexible suite of components for multiple energy system types, such as buildings, solar thermal, photovoltaics, etc. One such tool that is System Advisor Model (SAM), which helps create performance and financial model for a variety of solar systems and projects. This assignment provides you with another opportunity to apply SAM modeling to a solar heating system.
The Assignment
Use the the example from the Introduction section of D&B online textbook (pages xxi - xxvi) to create a SAM profile of the water heating system and run the simulation for your chosen location.
The goal is to generate an estimate for the annual utilization of a solar water heater. Extract performance information, expected energy gains, and expected costs savings for water heating (here consider only cost of energy, not equipment). The adjustable parameters you can use to optimize the system performance are: type of the collector, tilt of the collector, and size of the collector.
More detailed instruction for this assignment in posted in Lesson 6 Module in Canvas.
Deliverable
Based on your model output, prepare a brief report to present your data and discuss the system performance. Submit your report as a single PDF file to the Lesson 6 Assignment dropbox in Canvas by 11:55 pm Wednesday night. You can insert the SAM output diagrams to your report to facilitate your discussion, although make sure they are clearly readable.
6.4 Summary and Final Tasks
6.4 Summary and Final TasksComputer energy modeling is utilized heavily in decision making during the design and retrofit process for solar thermal systems. While rarely “dead on” when it comes to accuracy, the comparative value (as opposed to absolute value) of one benchmarked model against another is tangible. Simulated energetic and financial impact of design alternatives enables the best path forward while developing a solar project.
Reminder - Complete all of the Lesson 6 tasks!
Please double-check the to-do list on the Lesson 6 Introduction page to make sure you have completed all of the activities listed there before you begin Lesson 7.
Lesson 7: Buildings and District Heating
Lesson 7: Buildings and District HeatingThe links below provide an outline of the material for this lesson.
7.0 Introduction
7.0 IntroductionFor well-being and health, the homestead should be airy in summer and sunny in winter. A homestead possessing these qualities would be longer than it is deep; and its main front would face south.
It is very warm and light, not only from the direct rays of the sun, but by their reflection from the sea.
Passive solar architecture can trace its origins back thousands of years. Buildings have long been used as solar collectors and thermal storage systems (D&B Chapter 14). Today we have some well-defined ways of calculating the time-dependent loads within our buildings, the space heating requirements, and the thermal behavior of buildings (D&B Chapter 9). This enables the active heating of buildings using solar thermal collection systems (D&B Chapter 13). On top of that, there are districts that have centralized or distributed solar heating systems for use at a community wide scale. With the technology available to us today, we could supply the vast majority of all building heating worldwide with solar thermal energy at reasonable cost. The key element is seasonal solar thermal energy storage enabling an adequate solution for regions with long winters due to poor solar access during that time (D&B Chapter 8). Appropriately sizing systems is a critical step towards good and cost effective solutions.
Lesson Objectives
- Describe the differences between active and passive systems/methods.
- Understand the principles of different thermal energy storage types.
- Examine the heating options for a residence or office.
- Perform basic thermal balance calculation for residential storage tank.
What is due for Lesson 7?
This lesson will take us one week to complete. Specific directions for different assignments are given in the table below and within this lesson pages.
| Task | Assignment Details | Access/Directions |
|---|---|---|
| Readings | Required
Supplementary
| Registered students can use the following link to access the online textbook through the University Library. |
| Assignment | Mini-proposal on residential heating solutions. | More directions to the assignment are provided on the 7.3. Assignment page of this lesson. |
| Quiz | 10 multiple choice questions based on assigned readings | Registered students can access the quiz in the Lesson 7 Module in Canvas. |
| Discussion | Thermal energy storage: best options for the present; best ideas for the future | Please read directions and post your reflection in Lesson 7 Discussion in Canvas. |
Questions?
If you have any questions, please post them to our Questions and Answers discussion forum in Canvas. I will check that discussion forum daily to respond. While you are there, feel free to post your own responses if you, too, are able to help out a classmate.
7.1. Active versus Passive
7.1. Active versus PassiveD&B Chapters 13 and 14 cover the two types of district heating; active and passive.
The difference between those types is rather simple. The active heating implies using specially designed solar collectors that are installed on the building and supply energy to partially of wholly satify the building energy loads. The passive heating means that building itself acts as a solar collector, and hence the properties of building materials and building design both play role in the energy balance of the system.
The typical basic components of an active solar heating system include:
- collector,
- storage unit
- load
- auxiliary source
Design approach is similar for both air and water heating systems, but the storage types and equipment are different. When such standard designs are applied to specific building cases, a number of key parameters are manipulated to ensure that the thermal performance of the system meets the space heating requirements. Please refer to the following reading for more details on active solar heating.
Reading assignment
Book chapter: Duffie, J.A. Beckman, W., Solar Engineering of Thermal Processes, Chapter 13:
-- Sections 13.1-13.3 -- These sections present the basic information on how the solar heating systems are designed. It provides schematics and tables of design parameters that regulate the thermal performance. Study both types of designs - with air and water as heat transfer fluids.
-- Section 13.5 -- This section presents an example of computed design for a specific residence area and shows some parameter matching and performance data for this case.
-- Section 13.8 -- This section describes the concept of seasonal energy storage
Reading assignment
Book chapter: Duffie, J.A. Beckman, W., Solar Engineering of Thermal Processes, Chapter 14: Sections 14.1-14.3
Website: Drake Landing Solar Community (DLSC), Okotoks, Alberta (Canada), URL: http://www.dlsc.ca/
This website contains information about the solar community in Canada, which implements a range of solar technologies to cover 90% of their space heating needs. The website contains description of features and technologies, and under 'Publications', you will find a number of bi-annual reports showing performance and meteo data from different periods of DLSC operation.
Supplemental reading:
Duffie, J.A. Beckman, W., Solar Engineering of Thermal Processes, Chapter 14.
Read the rest of Chapter 14 of the textbook if you are interested to learn about various passive technologies and how they are assessed.
7.2. Energy storage considerations
7.2. Energy storage considerationsEnergy storage is a very important element of many sollar heating systems due to inherent intermittency of solar flux. The storage unit is typically represented by medium capable of effectively maintaining its temperature over a certain period of time. When the direct solar gain is unavailable, storage heat can be used for meeting the load requirement. The optimal storage capacity (size of the unit) is always dependent on the expected time variations of solar radiation availability.
The D&B Chapter 8 describes several types of thermal energy storage, which can be used with either liquid-based or air-based heating systems.
The most common thermal energy storage system in many houses is a hot water tank. The insulated tank typically holds 50-80 gallons of water and can be very efficient at storing energy depending on the level of insulation. Solar water heating systems will often use a water tank that is sized larger than would be sized for a conventional domestic hot water system so as to increase the solar fraction of the system.
For solar heating systems that use air, a packed rock bed storage system is a great alternative to requiring water-air heat exchangers with a hot water storage tank. The airflow requirements of a packed bed storage system result in a limitation of rock bed storage, where, unlike in a water tank, heat cannot be input and extracted at the same time.
Both types - water tank and pebble bed - are storage options that were discussed earlier in space heating design.
Reading assignment
Book chapter: Duffie, J.A. Beckman, W., Solar Engineering of Thermal Processes, Chapter 8. Section 8.3
You are encouraged to read through this chapter to become familiar with various avaiable options for solar thermal energy stoarge. The main focus here is put on Section 8.3 since it provides a clear analysis on the thermal performance of the water tank energy storage. The example 8.3.1. shows how you would approach temperature calculations in the storage over time based on the solar energy gain and properties of storage medium. As this example appears of good practical value, the video discussion (18:15) of it is given below.
Solution to Example 8.3.1 (18:15)
Transcript: Solution to Example 8.3.1 (18:15)
PRESENTER: So this is example 8.3.1 from page 378 of Duffie and Beckman text. So we're asked to solve for the temperature in a hot water tank. So we're given a few things here, the mass of the tank is 1,500 kilograms. That's water. The loss coefficient area product of the storage volume or tank is 11.1 watts per degree Celsius, which you have to multiply by 3,600 seconds per hour to convert that into joules per hour, which we'll have to do later. Let's see here, the ambient temperature is 20 degrees Celsius. And the initial tank temperature is 45 degrees Celsius. In a table in the text, we are given the useful energy gain Qu as well as the loads for that tank-- how much water is drawn from the tank for each hour. And with that information, we're asked to find the temperature of the tank at each hour for 12 hours. So we're going to start here by solving for one hour by hand and then we're just going to implement in a spreadsheet to get the rest of the hours iteratively. So there are three methods of heat exchange in this tank. So first we have the loads, which are given in the example in the text. Then we have solar gains, which also given in the text. And these are calculated by the delta T, which is given by equation 8.3.1. And then the next mode of heat exchange is with the surroundings. We're losing heat to the surroundings by convection off the tank surface. And this one we can calculate with the equation 8.3.3. 0.3 So the first part is we need to know how much energy potential is in the tank to begin with. So calculate energy potential of the tank. And we do this with that first equation, 8.3.1. So the amount of heat in the storage unit that is available to us is a function of the mass of the tank and the key capacitance of the fluid in the tank and the temperature difference between the tank and the surroundings. So if we do a quick unit check on this, we have kilograms for mass. We have Cp up here I could have mentioned earlier. In the example, the heat capacitance of this fluid is 4,190 and the units are joules per kilogram Kelvin. So down here we have joules per kilogram Kelvin. And all of that multiplied by the temperature difference in Celsius, which is equivalent to Kelvin. So you can see that kilograms will cancel out as will Kelvin, and we're left with joules for the units here. So plugging in some numbers, we get 1,500 times 4190 times our temperature difference, which is 45 minus 20. Punch that in the calculator, we get 157.1 megajoules. So if you just punch that in, you're going to get 157 million joules. So that's step one here, is just calculating how much energy is there in the text. Next, we have to include some of these modes of heat transfer. We're going to include first the load and the solar gain. And we're going to essentially use the same equation, but flipping it around a bit. So now we're going to include Qu and Ls. So Qs is equal to, in this case, what we calculated before, 157.1. But now we're going to include 0 solar gain during this first hour and 12 megajoules of load, as per the table on page 378. It may be on the next page. I forget if it's on the next page or not, 379. So when we calculate that, including those important gains and losses, we end up with 145.1 megajoules. And that is equal to the mass of our tank, 1,500, times Cp, 4190, times-- we're going to call this T intermediate right here, so as we finish this calculation, that will make sense-- minus the ambient temperature. Solving for T intermediate, we get that it is equal to 43.09 degrees Celsius. 0.1 either way. So you take 145 right here, divide it by 1,500, divide it by 4190, and then add 20 back on to the other side. And then you get intermediate temperature, 43.09. So next, we have to include-- so come up here to the top of the page again. So now we're going to include loss to our surroundings. For that, we're going to use equation 8.3.3. Ts plus, so time at the next time step essentially is equal to Rt intermediate, or essentially the temperature of the tank in light of the loads and gains plus our time step divided by MCP, mass of the tank and the heat capacitance of that heat transfer fluid. Again, the useful energy gain, the loads, and now heat conductive losses times Ts minus Ta. Sorry for running out of room up here. Just squeaking it in on the edge there. So here we have our T intermediate is 43.1. Our timestep is-- I should make that a lowercase t, actually-- timestep is one hour. Mass is 1,500 Cp is still 4190. Qu is still 0. Loads are still 12. Ua is 11.1 times 3,600. Ts is 45 and Ta is 20. So once you plug all those numbers in, you end up with 43.1 plus an additional loss, which is negative 0.16. So you end up with Ts plus equals 42.9 degrees Celsius for the end of hour 1. So the table from page 378 gives us these 12 hours. And then next, we're given the solar energy gain at each hour, and we're given the load profile at each hour. So for this first piece, we have 0 solar gain and 12 megajoules of loss. And the initial temperature is 45 degrees. So let me clear these contents here so we can type them all in. Over here on the right, you can see I've set up the system parameters. Heat capacitance of the tank is 4190, mass of the tank 1500. Ambient temperature is 20 degree Celsius. And the heat loss coefficient is 11.1, which is equal to 39,960 joules per hour. So I have to change the units on that one, because we're looking at hourly data. So for this first thing here, Qs, how much energy is in the tank, essentially? So that's equal to the mass of the tank times the heat capacitance of the fluid times the temperature difference. So 45 minus T ambient. And we want this in megajoules, because that's the units of our solar gains and loads. So we're going to divide by 10 to the 6 to convert from joules to megajoules. Because as you can see, our heat capacitance is in units of joules per kilograms Kelvin. So you've really got to make sure that you're tracking your units through this stuff. And I that really throw your answers off in any situation. And in order to be able to drag this column all the way to the ground, everything that's from the parameters section needs to have those cells held so that they don't move anywhere. So you get 157. If we look back at what we calculated before, you can see that that is exactly what we got right here, 157 megajoules for that first step. So that's great. That equation looks like we've implemented it correctly. So then we move on to the next cell, this T intermediate. And for this one, we want to add up the different loads and gains in light of the ambient temperature to figure out what the temperature of the tank is in light of those factors. So we're going to have our solar gains minus our loads plus the ambient or the total tank potential energy, essentially, in light of the temperature difference. And now we have to multiply it by 10 to the 6th for the megajoules and joules conversion. Because those are in megajoules, we want to get back into joules briefly for this intermediate step, because we're going to have to multiply by the system parameters again. And then we multiply by M Cp. So again, we're going to want to tag these ones with dollar signs that get held when we drag those cells down. And right off the bat, I see I made a mistake. I have 23.1. I also need to add in the ambient temperature for this step. 43.1. And so if we go back to our handwritten example right here, that answer 43.1 after implementing this equation right here into our spreadsheet. So that's great. So we did that step correctly as well. And then the last piece of the calculation is just to calculate, well, what is that final temperature at the beginning of the next time step or the end of this time step? So to do that, we use equation 8.3.3. And this is equal to that intermediate temperature that we calculated here in light of gains and loads, plus now the losses to our surroundings. We haven't included that yet. So that's the last piece that we have to include. I could have done all of the T intermediate and this last calculation in one step. But it's a little bit more transparent by splitting it up. The textbook doesn't split that up, and it makes it a little bit hard to figure out. So plus 1 over mass of the tank times the heat capacitance times the energy gained minus loads minus 11.1 times 3,600, which is this number over here, M in the M column, 39,960. That's 11.1 times 3,600. So again, get it in units of joules instead of watts. Because a watt is a joule per second. So this is actually-- that's a typo right there. I'll fix that in a minute. And then you have to multiply that Ua sub s term by the temperature difference of Ts, tank temperature minus T ambient. Then we've got to close all of our parentheses, to add a few dollar signs in here, to lock these cells so we can drag them down. C2 D2 M5 needs to be locked and K4 needs to be locked. That should do it. So the typo I mentioned earlier, this one right here, should not be watts per second. It's just watts. And then that means that when you multiply-- because a watt is a joule per second. So we want joules, so joules per hour, the hourly data. So that's this cell, you can see, is simply 11.1 times 3,600. So back up here to our H column where we had just typed in that last T sub s to the plus equation, you can see that after we do that, we get 42.9, which going back to our hand calculation right here, that's what we had. So we've implemented that equation correctly as well now. So now that we have that, we should be able to simply set this cell in column E equal-- so this is the tank temperature at the beginning of time step number two. We should be able to set that equal to the temperature of the tank at the end of the previous time step. So if we drag that down through all the hours and then we proceed to drag these guys down through all the hours, and then plot it, we will get the temperature over time at all those time steps. And that's the solution for this example. Thanks for listening. Again, this has been example 8.3.1 in the text.
Seasonal thermal energy storage is a hot topic at present. The type of storage enables the wintertime use of abundant solar thermal energy from the summer months. While as much as half of the collected summer energy that is put into any seasonal thermal energy storage system is lost, the remaining half that is stored and eventually extracted can cover as much as 95% of the total heating requirements. [source: Sibbit et al., The Performance of a High Solar Fraction Seasonal Storage District Heating System – Five Years of Operation Energy Procedia, 2011]. The Drake Landing Solar Community in Alberta, Canada, that you became famliar with in the previous Section, is an example of unprecedented success in the field of seasonal thermal energy storage for the heating of buildings. Seasonal thermal energy storage systems can take many years to achieve their operational goals as there is a lot of thermal lag while the system “charges” over the course of the first few summers. Retrofitting a building or community to use a seasonal thermal energy storage system can be challenging, especially in urban settings, since most such storage systems are large and are installed underground and hence may require digging or drilling, which can be both costly in space-demanding. Some solutions to this cost barrier include compact drilling rigs for urban settings and horizontally oriented storage system layouts.
7.3. f-Chart Method for Solar Heating Design
7.3. f-Chart Method for Solar Heating DesignThe method called f-Chart is one of the empirical frameworks that uses standardized metrics to characterize the long-term performance of solar heating systems. It was originally developed by Klein, Beckman, and Duffie in 1976. Although it has some uncertainties and is mostly applied to standard designs, it provides a quick and robust estimate of system performance using collector parameters and average monthly radiation and temperature data. To this end, understanding the f-Chart data can be useful.
The f value, which is a targeted output in f-Chart computations, characterizes the fraction of a total heating load supplied by solar energy:
To set up the calculation you need to choose and specify the following variables: collector area, collector type, storage capacity, fluid flow rates, heat exchanger sizes. Those parameters can be set at the design stage and can be adjusted further to achieve a desirable outcome.
The f-Chart model correlates those parameters with thermal performance. This correlation is empirical and is the result of treatment of hundreds of simulations and case studies of solar heating systems. In the end, f is presented as a function of two dimensionless parameters X and Y:
These metrics are normally defined for a one-month period. In terms of collector properties, these values can also be expressed as follows:
All the parameters and properties used in these metrics are available from collector tests and conditions chosen, so they should be quite straightforward to calculate. Let us define all the properties included (D&B, 2013):
Ac = collector area (m2)
F'R = collector heat exchanger efficiency factor
Δt = total number of seconds in month
Ta = monthly average ambient temperature (oC)
Tref = empirical reference temperature (100 oC)
L = monthly total heating load for space heating and hot water (J)
HT = monthly average daily radiation incident on collector (J/m2)
N = number days in month
(τα) = monthly average transmittance-absorptance product
The products FR(τα) and FRUL are determined from standard collector tests. The example calculations of X and Y values for a typical solar heating system are given in Example 20.2.1 of the D&B textbook. Further, X and Y are used to calculate f - the monthly fraction of the load supplied by the solar energy. For tha purpose, the following empirical equations are used:
For liquid systems:
For air systems:
Note: these equations are the result of model data fitting (so do not try to justify it by any theoretical derivations). They are simply used as the approximations of model results fitted to the pair of X and Y values.
Further, the total solar fraction of annual load (F) can be found by the sum of all monthly fractions:
For example, for a liquid-based heating system, if we perform this calculation for different collector areas, we observe an increase of solar energy fraction as the system gets larger (Figure below). Based on this output, we can select the collector area for the project to cover the desired amount of energy needs.

Figure 7.1: Annual solar energy fraction in total load as a function of collector area of a solar heating system determined by f-Chart method.
The chart above is only one representation of f-Chart performance data. A number of other properties can be presented in similar diagrams. Please refer to the following reading to learn more details about the f-Chart method and to see more examples and illustrations of how it is applied.
Reading Assignment
Examples in Sections 20.2-20.4 are especially useful.
The f-Chart method can be applied to the following systems (Haberl and Cho, 2004):
- Water storage heating
- Pebble bed storage heating
- Building storage heating
- Domestic water heating
- Integral collector-ctorage DHW
- Indoor and outdoor pool heating
- Passive direct gain
- Passive collector-storage wall
The following types of solar collectors can be included in this treatment:
- Flat plate
- Evacuated tube
- Compound parabolic concentrating
- 1-axis and 2-axis tracking
To summarize: the f-Chart method is an express tool for thermal design assessment. It allows quick estimation of solar heating system performance, although errors up to 5-10% may be present due to approximations. That is the price of speed and convenience. The uncertainties may be due to variations in meteorological data, averaging performance data, system use and occupants' behavior, and individual system flaws and imperfections.
This method is especially recommended for exploring relative effects of design changes and also as a benchmark for comparison with real-life performance data from a system.
While the calculations described above can be made by hand, there is licensed software (FCHART) available (but not free) via www.fchart.com (2005).
References:
Duffie, J.A. Beckman, W., Solar Engineering of Thermal Processes, John WIley & Sons, 2013.
Haberl, J.S. and Cho, S., Literature Review of Uncertainty of Analysis Methods (F-Chart Program), Report to the Texas Commission on Environmental Quality, Energy Systems Laboratory, Texas A&M Univeristy, ESL-TR-04/08-04, August 2004.
Klein, S.A., Beckman, W.A., and Duffie, J.A. A Design Procedure For Solar Heating Systems, Solar energy 18, 113- 126 (1976).
7.4. Assignment
7.4. AssignmentBuildings are often not designed to maximize solar utility for the building occupants. As such, there can be some “low hanging fruit” when it comes to increasing solar gain and solar energy utilization in the heating season. Additionally, active solar heating systems can be set up to offset significant portions of annual heating costs.
Consider the heating of your home, apartment, or office during the heating season. If you are in a region where there is little or no heating requirement, please imagine your home, apartment, or office in a location where you would need a heating system. What solar passive solutions would reduce your heating requirements at low capital cost? What solar active systems would help to offset your energy consumption for space heating? Section 13.2 of the D&B text provides some system schematics and specifications for typical, active solar thermal systems to give you some ideas.
Deliverable: Lesson 7 Assignment
Write up a 200-300 word mini-proposal of your solar thermal heating solution(s) for your built environment of choice. Include two schematics:
- a floor plan of your area (site map) with solar access, obstacles (trees), orientation, and location; and
- a schematic of solar thermal system design (including any collectors, pumps, fans, pipes, heat exchangers, and tanks) that you help to offset your energy needs.
Prepare both schematics using any convenient software (Power Point, CAD, SketchUp, etc.). Please insert your graphics to your proposal document and save as PDF. Submit your report as a single PDF file to the Lesson 7 Assignment dropbox in Canvas by 11:55 pm Wednesday night.
7.5. Summary and Final Tasks
7.5. Summary and Final TasksBuildings are solar energy conversion systems, absorbing solar radiation and impacting comfort within building zones. Building facades (walls) behave as flat plate absorber systems (with no covers) while windows behave as cavity absorber systems - the radiation is transmitted through the window and part of it is reflected around in the zone until it is absorbed by the floor, walls, and ceiling. The energy balance of a building is comprised of gains, loads, and losses, all of which are time dependent. Careful accounting of each piece of the overall energy balance and choosing the right specifications for collector and energy storage are needed to create an energy-efficient dwelling.
Reminder - Complete all of the Lesson 7 tasks!
Please double-check the to-do list on the Lesson 7 Introduction page to make sure you have completed all of the activities listed there before you begin Lesson 8.
Lesson 8: Solar Cooling
Lesson 8: Solar CoolingThe links below provide an outline of the material for this lesson.
8.0 Introduction
8.0 IntroductionLast year, I made a refrigerator in my basement. And I needed … to figure how … there is no such thing as 'cold.' There is only less heat.
Cooling needs are an excellent fit for solar thermal energy because of the often-synchronous nature of the energy source and load schedule. What we know of as refrigeration or cooling is simply the moving of heat from our cold zone (building space, refrigerator, etc.) to a heat sink (often the ambient air). The driving of heat from a cold space to a hot space requires the input of energy because that is not the natural direction that heat would flow. An analogy would be pushing a cart uphill, when it wants to roll downhill, requiring the input of energy to get the cart to move uphill. Depending on the type of technology that is used, thermal energy can drive heat in a desired direction, thus creating “cold,” which is actually just less heat. Solar thermal energy is often thought of as some unique source that must have complex technology to convert it to useful work. That is not the case. Solar thermal energy is no different from any other type of thermal energy. Depending on the collector setup and working fluid, different temperatures and operating temperature ranges can be obtained. This heat can then be used for any thermal process that would normally be driven by some other heat source such as natural gas, propane, or electric resistance heat.
Learning Objectives
- Identify different types of solar cooling - e.g. absorption chiller, desiccant, etc.
- Use the psychrometric chart to explain cooling effect
- Select a solar thermal solution for a residence that helps address cooling requirements.
What is due for Lesson 8?
This lesson will take us one week to complete. Specific directions for different assignments are given in the table below and within this lesson pages.
| Tasks | Assignment Details | Access/Directions |
|---|---|---|
| Readings | Required
| Registered students can use the following link to access the online textbook through the University Library. |
| Quiz | 10 multiple choice questions based on lesson readings | Registered students can access the quiz through the Lesson 8 Module in Canvas. |
| Assignment | Cooling system mini-proposal | Specific directions for the assignment are provided on the respective page of this lesson. |
| Discussion | Solar cooling systems - implementation examples | Please see additional directions for this discussion in the Lesson 8 Module in Canvas. |
Questions?
If you have any questions, please post them to our Questions and answers discussion forum in Canvas. I will check that discussion forum daily to respond. While you are there, feel free to post your own responses if you, too, are able to help out a classmate.
8.1. Overview of Solar Cooling
8.1. Overview of Solar CoolingThe solar air conditioning immediately seems a very attractive idea when you think of using solar heat to counteract that heat. How does that become possible? The concept however is not new, as it dates back to 1960s and 1970s, when several cooling and refrigeration cycles were investigated and proposed. In general, the use of solar cooling was intended for two main purposes:
1. Refrigeration for food storage and
2. Space cooling (air conditioning)
Furthermore it was realized that such systems as flat-plate solar collectors can be use for heating in the winter and cooling in the summer, thus significantly increasing system usability and efficiency.
The main idea behind this concept is that the physicochemical cycle that is able to transfer thermal energy from one location to another is driven by an external heat source (solar or non-solar). Another important idea here is that removal of heat from any part of the system essentially equals cooling. There are a number of different cooling cycles based on somewhat different principles. The following three are mentioned by Duffie and Beckman (2013) in connection with solar thermal systems:
- Absorption cycles
- Desiccant cycles
- Solar mechanical cycles
All of these cycles may have some technical variations depending on specific conditions and load.
Absorption cooling technology is considered in more detail here. The cooling effect is based on the evaporative cooling of a refrigerant. Because the vaporization process requires energy input, when it happens it takes heat from the system, thus making the remaining fluid colder.
Desiccant cooling is based on cycling dehumidification-humidification processes. It uses some hygroscopic substances or materials for dehumidification, and those materials are regenerated in the cycle by applying solar heat.
Solar mechanical cycles attempt to combine the solar-powered mechanical work cycles (such as Rankine) with conventional air conditioning systems. The solar-driven part of the system is not actually the chiller, but the engine that produces energy for operating the air conditioner.
At over 50 years of history of commercial systems, why haven't solar absorption chillers simply taken off and taken over the air conditioning market? What about solar desiccant cooling systems? If the theory and proof of concept have been shown to work, the only thing that holds back a technology from taking off is the cost. In this case, for most locations, electricity generated from fossil fuels is currently less costly than the cost of a solar thermal collector, storage tank, and other system components required for cooling with solar thermal energy. Even when combined with solar heating for both domestic hot water as well as space heating (as shown in Figure 15.3.1 of the D&B text), where cost savings through shared system components are expected, the payback period is often too long to justify with current low fossil fuel energy costs as the alternative. In certain applications, however, such systems are indeed the lowest cost alternative, and, as time goes on, these dual-purpose (heating and cooling) systems will become more competitive.
Since cooling is quite expensive, reducing cooling loads via methods of passive building design and insulation are important for overall efficiency. For example, summer solar gains in the building can be minimized by using windows with low transmittance in the infrared part of spectrum. Also various shading designs (internal and external) can be planned to manipulate direct solar gains. Creating passive ventilation loops that take advantage of natural air flows and prevailing winds at a locale can also prevent excessive indoor heating. Finally some building designs may use the ground as heat sink ("earth tempering"). All these methods are discussed in more detail in Passive Cooling Handbook (US DOE, 1980) and should certainly be considered in building designs in warm climates as a way of reducing cooling loads.
8.2. Absorption Cooling
8.2. Absorption CoolingAbsorption cycle is one of the promising methods to utilize the solar heat for space cooling in domestic and industrial applications. Until recently the absorption cooling technology was not readily available for small capacity applications and was quite expensive compared to the traditional vapor compression cooling technology. However, there is a significant opportunity to combine an absorption system with building envelop design to provide environmentally benign way of controlling internal environment using solar energy.
There are two basic types of absortpion cooling cycles: (1) Lithium Bromide (LiBr)-Water and (2) Ammonia-Water. The LiBr-H2O appears to be more suitable for small-scale and low-cost solar applications due to lower operating temperature of this cycle (Florides et al., 2001).
Absorption systems are in some way similar to vapor compression systems, but differ in pressurization phase. Maybe it can be useful to briefly review how the conventional vapor compression systems work, such as those found in electric refrigerators.
In a compression refrigeration cycle, a working fluid (refrigerant) is compressed via electrical energy input to a mechanical compressor. We can recall from thermodynamics' ideal gas law that pressure multiplied by volume is proportional to temperature:
PV = nRT
As such, when the working fluid undergoes compression (an increase in pressure in the same volume), the temperature of the working fluid must increase. Then, the compressed, higher temperature fluid is pumped through a heat exchanger, where it exchanges heat with the ambient air (this is either the coil and fins you see on your outdoor unit of your heat pump, the coil and fins on the back of your window air conditioner unit, or the coil and fins on the back of your electric refrigerator). This process results in a heat loss from the fluid to the surrounding air (which is cooler than the fluid), effectively cooling the fluid.
Next, this colder (but still compressed) working fluid passes through an expansion valve where it is returned to its pre-compression pressure (at the same volume) which requires that the fluid decrease in temperature according to the ideal gas law again. This step drops the temperature of the working fluid to a level that can be used for cooling of your space or refrigerator.
The process of cooling in such a refrigerator is essentially transfer of heat from the target cooled space to the working fluid and to the environment. The cycle loops here, with the fluid exiting the heat exchanger to your space/fridge and heading back to the compressor.
Now let us look how the absorption cooling cycle works.
It was already mentioned that in comparison with the conventional refrigeration cycle (described above), the absorption cycle has a different kind of pressurization. Instead of using a mechanical compressor (usually power-expensive), it completes pressurization by dissolving the refrigerant in the absorbent. In case of LiBr-H2O system, LiBr acts as an absorbent, and H2O acts as refrigerant. LiBr is a salt, so we can guess that if the LiBr-H2O solution boils, water will go, and salt will stay. The solubility limit of LiBr in water is quite high, so the solution used in the absorption cycle is very concentrated (~60% LiBr by mass).
There are four main components of the absorption cooling cycle: generator, absorber, condenser, and evaporator (where the cooling effect is achieved). The simplified schematic diagram of the absorption cycle is shown below:

The solar (or other external) heat input to the system is denoted QG. The heat that is absorbed by the system from the cooled space due to evaporation process is denoted QE. The heat rejected from condenser and absorber are shown respectively as QC and QA. The overall energy balance of the system is therefore:
QC + QA = QG + QE
The cycle, step by step goes as follows:
- Absorber contains the absorbent-refrigerant mixture (in this case LiBr-H2O), which is delivered by a liquid pump to the generator. The solution passes through a heat exchanger where its temperature increases. We can call this pumped mixture "strong solution" because it is rich in refrigerant.
- Generator heats the absorbent-refrigerant mixture using the external heat source - for example, solar heat from a flat-plate collector. The heat causes the solution to boil, and water turns into vapor flows to the condenser. Remaining LiBr with still some water is sent back to absorber via a heat exchanger (this returning fraction can be called "weak solution" since it is depleted of refrigerant).
- Condenser condenses the water vapor coming from the generator. At this point heat is rejected, since condensation process is exothermic. This liquid condensate is now directed to the evaporator through an expansion valve.
- Evaporator absorbs the heat from the load (cooled space) due to evaporation of the refrigerant at low pressure. This creates the cooling effect. Vaporized refrigerant then flows back to the absorber, where it mixes with the "weak solution" of LiBr.
Then the cycle continues. In this scheme, the solar heat provided to the generator is driving this cycle. The cooling effect achieved in the evaporator is applied to either chilling water flow or air flow that is passed through the evaporator. This chilling water flow is not part of the cycle, it simply acts as a vehicle to deliver "cold" to the target space or environment.
The following practical values of the system parameters are typical for LiBr-H2O system:
- Generator temperature ~75oC
- Evaporator temperature ~6oC
- Heat exchanger temperature ~55oC
- "Strong" solution 55% LiBr(aq) by mass fraction
- "Weak" solution 60% LiBr(aq) by mass fraction
The performance of such system can be characterized by cooling coefficient of performance (COP metric):
COPcooling = QE/QG
which is essentially the heat load of the evaporator per unit of heat load of the generator. This metric can become useful when comparing system costs. The COP values for LiBr-H2O system is typically in the range from 0.6 to 0.8 (Duffie and Beckman, 2013).
The following reading will give you more details and analysis of the adsorption cooling systems.
Reading Assignment
Duffie, J.A., and Beckman, W.A., Solar Engineering of Thermal Processes, Wiley and Sons, 2013, Chapter 15. Sections 15.1-15.6.
The temperature-pressure diagram presented in Figure 15.2.2 is a typical way to analyze cooling and heating cycles. Try to identify different stages and points of the cycle on this diagram and understand why temperature and pressure change the way they do.
Probing question:
What are some key advantages of the absorption cooling cycle compared to the conventional compression refrigeration cycle?
- An absorption cooling cycle (including a solar driven one) can work without any mechanical pumps, providing cooling without any electrical input.
- An absorption cooling cycle is quieter and has no vibrations (from compressors/pumps).
- An absorption cooling cycle uses working fluids that are more environmentally friendly.
- A solar absorption cooling cycle, with some storage, is synchronized with solar driven heat gains providing a real-time energy source that scales with the load.
8.3. Psychrometrics and Desiccants
8.3. Psychrometrics and DesiccantsSolar desiccant cooling systems focus on the dehumidification of air as a means of cooling air for a building space. Psychrometrics is the field of engineering concerned with the amount of moisture (as vapor) in the atmosphere. To understand psychrometrics, we use a psychrometric chart, below (there are many charts available free online from various sources and companies. (The following chart is from engineeringtoolbox.com). Use the following link to access a scalable PDF file of the psychrometric chart.

The x-axis here is dry bulb temperature (this is the temperature measured by thermometer shielded from radiation or moisture - true thermodynamic temperature). The y-axis is water content, or moisture, measured in mass of water per unit mass of dry air. As you move to the left on the chart, you decrease the sensible heat. As you move to the right, you increase the sensible heat. As you move up you increase the humidity, increasing latent heat. As you move down you decrease the humidity.
You can learn the anatomy of the the psychrometric chart in more detail from the following source:
Reading Assignment:
Website: Psychrometric Charts, Autodesk Education Community, URL: http://sustainabilityworkshop.autodesk.com/buildings/psychrometric-charts
The psychrometric charts help to understand how the solar desiccant cooling works. This is the second class of solar cooling systems, which are based on humidification-dehumidification process using a hygroscopic material (desiccant), which is capable of absorbing moisture from air. This cycle uses water in the direct contact with air as refrigerant. Both liquid or solid desiccant can be used: for example, silica gel, LiCl salt (solid) or glycol, LiCl solution (liquid). An interesting feature of the desiccant cycle is that it is an open system, meaning that water (refrigerant) is discarded from the system via dehumidification process, and then new water is taken in during humidification phase. The desiccant cycles are typically used with flat-plate solar collectors. Solar heat is applied to regenerate the desiccant.
Learn more details about how desiccant cycle works from the following reading:
Reading Assignment:
Duffie, J.A., and Beckman, W.A., Solar Engineering of Thermal Processes, Wiley and Sons, 2013, Chapter 15, Sections 15.7-15.8.
Sahlot, M and Riffat, S.B., Desiccant Cooling Systems: a Review, Int. J. Low Carbon Tech., 2016, pp. 1-17.
Figure 15.7.2 in the D&B text shows the psychrometric path through a rotary desiccant solar cooling system, with numbers tagged on the chart that correspond with the numbers tagged on the system diagram. Figures 15.8.1 and 15.8.2 in the D&B text each show an additional system configuration that uses a desiccant and the subsequent psychrometric chart path that results from the use of the system. Revisit each of these three figures and follow the path through the system on the psychrometric chart.
8.4. Assignment
8.4. AssignmentSolar cooling is a field of great interest for the buildings industry. Solar gains driving cooling loads, and as such, if utilized to drive a cooling system would result in synchronized cooling loads and cooling energy supply. Consider the cooling of your home, apartment, or office during the cooling season. If you are in a region where there is little or no cooling requirement, please imagine your home, apartment, or office in a location where you would need a cooling system. What passive solutions would reduce your cooling requirements? Chapter 15 of the D&B text provides some detailed system schematics and specifications for typical solar cooling systems to give you some ideas.
Deliverable: Lesson 8 Assignment
Write up a 200-300 word mini-proposal of your solar cooling solution(s) for your built environment of choice. Include two schematics:
- a floor plan of your area (site map) with solar access, obstacles (trees), orientation, and location; and
- a schematic of solar cooling system design (including collectors, pumps, fans, pipes, heat exchangers, and tanks) that would help to address your cooling load
Prepare both schematics using any convenient software (Power Point, CAD, SketchUp, etc.). Please insert your graphics to your proposal document and save as PDF. Submit your report as a single PDF file to the Lesson 8 Assignment dropbox in Canvas by 11:55 pm Wednesday night.
8.5. Course Project Pre-Proposal
8.5. Course Project Pre-ProposalCourse project pre-proposal will help define the scope of your final design proposal and will be used to obtain class feedback before you develop the idea to the final stage.
Your Project Pre-Proposal should include the following sections:
- Introduction - briefly explain your project motivation and goals.
- Project area definition – define the location, buildings, processes, etc.
- Thermal energy requirements – define peak demand, average demand, scheduling, etc.
- Alternative technological solutions – describe available alternatives including a no- action alternative if applicable.
- Potential impact – describe the best case cost and energy savings potential.
- Overview of methods to be used – list any tools or calculation methods that you will need to employ for the full system design proposal.
Please limit your Pre-Proposal to three pages to facilitate quick review. You can include some originally made graphics if it is important to convey your idea. Consider the content of this pre-proposal as a working outline of your final project.
These pre-proposals will be subject to peer-review, which will happen over the next two weeks. Everyone will be assigned two pre-proposals to critique. Please submit your feedback on each author's submission as comment or attachment to your comment. Again - the deadline for the peer-review will be two weeks from the due date for pre-proposal submission.
Deliverable: Course Project Pre-Proposal
Please submit your pre-proposal as a single PDF file to the Course Project Module in Canvas.
Check Canvas calendar for specific deadlines.
8.6. Summary and Final Tasks
8.6. Summary and Final TasksSummary
Solar cooling is a field of great interest because of the potential opportunity for decreased costs, synchronized energy supply with energy demand, and the utilization of heat from solar heating processes during times when heat is not needed but rather cooling is needed. The (typical) higher cost of absorption cooling systems over compression cooling systems is what has led to the current widely established norm of compression cooling for most processes. However, in certain applications, absorption cooling wins economically and in the environmental context it is indeed the best option.
Reminder - Complete all of the Lesson 8 tasks!
Double-check the to-do list on the Lesson 8 Introduction page to make sure you have completed all of the assigned tasks before you begin Lesson 9.
Lesson 9: Industrial Processing Requirements
Lesson 9: Industrial Processing RequirementsThe links below provide an outline of the material for this lesson.
9.0 Introduction
9.0 IntroductionIn several specific industry sectors, such as food, wine and beverages, transport equipment, machinery, textiles, pulp and paper, the share of heat demand at low and medium temperatures (below 250°C) is around 60%. Tapping into this potential would provide a significant solar contribution to industrial energy requirements.
Global industrial processes have significant thermal energy needs that are addressable by solar thermal energy conversion systems. Any industrial process that requires heat at temperatures below 250°C is readily addressable by a solar thermal energy system. Systems that require higher temperatures are also addressable by solar thermal solutions, but the costs for such systems at small and medium scales are prohibitive. There is more to it than simply the temperature; but, at first glance, using temperature thresholds as a guide enables a rapid assessment of global potential.
Learning Objectives
- Match industrial processes with appropriate solar thermal technologies based on process parameters and inputs.
- Calculate industrial processing system requirements.
- Apply basic cost analysis to the solar thermal system in industry applications.
What is due for Lesson 9?
This lesson will take us one week to complete. Specific directions for different assignments are given in the table below and within this lesson pages.
| Tasks | Assignment Details | Access/Directions |
|---|---|---|
| Readings | Required:
Supplementary: |
|
| Discussion | Topic for this lesson discussion is provided in Module 9 in Canvas | |
| Assignment | Problem set on solar thermal applications in industrial processes. | Specific directions for this assignment are provided on the respective page of this lesson. |
| Quiz | 10 multiple choice questions closely related to lesson readings | Registered students can access the quiz in the Lesson 9 Module in Canvas. |
Questions?
If you have any questions, please post them to our Questions and answers discussion forum in Canvas. I will check that discussion forum daily to respond. While you are there, feel free to post your own responses if you, too, are able to help out a classmate.
9.1. Overview of Solar Heat for Industrial Processes
9.1. Overview of Solar Heat for Industrial ProcessesIndustries all over the world use heat. Heat is heat, whether it comes from solar radiation or from fossil fuel combustion. Using solar thermal systems for generating heat for industrial processes is a very attractive avenue since it allows significant reduction in fuel costs and decreases environmental impact due to carbon emissions. Another reason is that a wide range of industrial applications require temperatures from near-ambient to those corresponding to low-pressure steam (<400 oC) - the range that fits very well the output temperatures of solar thermal collectors. So why not switch?
The key difference is the dispatchable nature of fossil fuels. Solar heat must be stored to achieve some level of dispatchability, or the industrial process that uses the heat must be flexible to adjust and only use the heat when the solar resource is available. Most often, some combination of a small storage solution along with modifications to the industrial process is the best solution.
At present ~40% of industrial primary energy consumption is provided by natural gas and ~41% by petroleum. So there is a technical potential to increase the share of solar thermal heat and possibly reach the solar thermal deployment in the industrial sector of 33% by 2030 (IRENA, 2015).
Many industries can be potentially benefitted, including but not limited to:
- Chemical processing
- Food production
- Beverage production
- Paper making
- Tanning
- Malt processing
- Desalination
- Textile
- Paint drying
- Masonry curing
- others..
The two key factors to consider in determination of the most suitable solar system for supplying energy to an industrial application are temperature and thermal medium. How much heat does the thermal fluid need to carry? What is the best type of fluid to use in the process?
For example, if hot steam is needed to operate an application, the solar system needs to be designed to deliver temperature significantly over 100 oC, and therefore concentrating collectors will be probably required. Or if hot water is needed (e.g. for such applications as desalination or sewage treatment), liquid-based flat plat collectors can be employed.
Learn more details on the status of solar energy implementation in different industries in the following report prepared by International Renewable Energy Agency:
Reading Assignment:
Report: Solar Heat for Industrial Processes, IEA-ETSAP and IRENA© Technology Brief E21 – January 2015. (29 pages)
9.2. Economic Aspects of Industrial Solar Heat
9.2. Economic Aspects of Industrial Solar HeatOne of the key economic impacts expected from the solar heat applications is fuel deduction costs. While deploying solar collectors involves additional up-front capital costs, the operational costs are much lower compared to fuel-fired units. However, due to reliability requirements, auxiliary energy supply is still typically included in industrial applications. In this case, the useful energy from the solar system is used to reduce the auxiliary fuel consumption.
Solar thermal systems are relatively high in capital costs compared against alternative thermal energy systems. However, the solar fuel is free. As such, the cost structure is inherently different from low capital cost but relatively high and often volatile fuel costs associated with petroleum, coal, natural gas, and other fossil fuel thermal energy systems. So another attractive aspect of solar thermal systems, and one of the primary drivers behind their growing installations worldwide, is the insulation that such systems provide against price shocks of fossil fuels.
For industry, taking into account depreciation rates over the long-term projects is important. In this connection, discounted cash flow analysis is a good tool to estimate the Net Present Value (NPV) of the project and realistic pay-back time. Those metrics are initially used to evaluate the economic viability of the project.
Let us recall what Net Present Value (NPV) is. In brief, NPV is the current value - as of today - of all related cash flows through the time of the project. Because $100 today is worth more than $100 next year (due to inflation rate), expenditures that will occur in the future are not valued as much as the same expenditures occurring today. This is why cheap natural gas boilers often appear as an economic choice in the light of the high capital cost of a solar thermal energy systems. Below we review the basic methods of calculating NPV.
Simple payback approach
This approach is suitable for short-term projects with quick return on investment. In this case, discounting (for money value declining over time) may be unnecessary.
In simple payback evaluation, all cash flows into and out of the project are added up to find Net Present Value (NPV). That includes initial cost (capital investment), annuities (net utility obtained from the operation, i.e. renevue minus maintenance and operation costs), and salvage value (in the end of the project) (Vanek and Albright, 2008):
NPV = Initial Cost + S(Annuities) + Salvage Value
- If NPV is positive, the project is considered financially viable.
For example, consider a hypothetical technology project with the initial cost of $100,000, net positive annuity of $20,000 for 10 years, and a salvage value in the end of that term of $5,000. Then, its net present value can be calculated as:
NPV = - 100,000 + (10 years x 20,000) + 5,000 = $105,000
The positive NPV value indicates that the project is financially viable.
The break-even point, i.e., the year when the sum of annuities surpasses the initial cost, and the initial expenditures have been paid back, is characterized by the Simple Payback Period (SPB):
SPB (years) = Initial Cost / Net annuity
- SPB indicates the number of years after which the initial expenditures are paid back.
For the case described above:
SPB = $100,000 / $20,000 = 5 years
Capital Recovery Factor (CRF) evaluates the relationship between the cash flow and investment cost. This evaluation is applicable to short-term investments (within N=10 years).
CRF = ACC / NPV
where ACC = Annual Capital Cost
ACC = Annuity – NPV/N
Here, the NPV/N term is the average share of the net present value per each year of the project. So, ACC is the part of the annuity that goes each year to cover the investment; it does not go towards profit.
For the hypothetical project example described above, we can calculate:
ACC = $20,000 – $105,000/10 = $9,500
CRF = $9,500 /$105,000 = 0.09 (9%)
- CRF factor should not be too high for a project to be considered financially viable.
By recommendation of the Electric Power Research Institute (EPRI), CRF value should not exceed 12%.
Discounted Cash Flow Analysis
This approach is better applied to long-term projects with slow payback. Money value declines over time, so it must be taken into account. This is especially relevant to solar projects, which typically have high capital costs and long pay-pack periods.
In the case of discounted cash flow, we need to evaluate how much any cash flow element would value in the future. That would depend on the interest rate (i) imposed on initial investment and the number of years (N) the project is underway. The following conversion factors are used to adjust the future money values (Vanek and Albright 2008):
and
Then the discounted flow NPV can be derived as follows:
NPVfuture = Initial cost + (P/A) × Annuity + (P/F) × Salvage value
For the example used in simple payback approach section above, if the interest rate on the initial investment is set at 5%, the conversion factors for 10-year project can be calculated as:
(P/F, 5%, 10) = 0.614 and (P/A, 5%, 10) = 7.722
And the discounted NPV future value can be found as:
NPVfuture = Initial cost + (P/A) × Annuity + (P/F) × Salvage value =
= -100,000 + 7.722 × 20,000 + 0.614 × 5,000 = $57,510
Here, when depreciation is taken into account, the NPV value is much lower than that in case of simple payback assessment. But the NPV of this project is still positive, indicating that the project is economically viable.
Supplemental Reading:
Vanek, F.M. and Albright, L.D., Energy Systems Engineering, McGraw Hill, 2008. Chapter 3. Economic Tools for Energy Systems.
In case of solar system providing heating for a facility or a process, the generated thermal energy is not sold to create monetary revenue, but instead is accounted in energy savings. So amount money saved per year can be assigned as monetized benefit.
Example
Let us estimate the NPV values for a hypothetical solar collector system of total area 10 m2 designed to offset the thermal energy expenditures of a building. Assume the system cost estimated at $725 per m2 of collector surface. This includes cost of collector, associated storage, pumps, and piping. Also assume that the yearly energy savings from the solar system are 7500 kWh, and the monetary value of energy is $0.16 per kWh (this is how much the consumer would need to pay for electric water heating if the solar system is not employed). Would this system be viable over the term of 15 years? or 10 years?
Based on these parameters and assumptions, the total system installation cost will be $725/m2 x 10 m2 = $7250. We can neglect possible maintenance or repair costs in this example. So this will be the total investment.
Then, the monetary value of the saved energy will be: 0.16 $/kWh x 7500 kWh/year = $1200. This is how much annuity (in terms of energy saving) the system brings.
To assess the economic viability, first we can use the simple payback check:
NPV = - 7250 + (1200 x 15) = $10,750
This is a positive value, therefore the project makes economic sense. However, depreciation rate is not taken into account here. If we assume that depreciation is 5% (and this is how much interest will be put annually on the initial investment), we can estimate the discounted NPV as follows:
NPVfuture = Initial cost + (P/A) × Annuity + (P/F) × Salvage value
where the (P/A, 5%, 15) factor is equal to 10.38 (if you apply the above-mentioned formula). The (P/F) factor is not needed in this calculation because we are not considering any salvage value. So finally:
NPVfuture = - 7250 + (10.38 x 1200) = $5,206
This is again a positive value, so with the current economic conditions, the project is considered viable.
Self-check
Now perform the same NPV calculation for a 10-year term and a 5-year term. What do these results tell us?
Simple payback: NPV = $4,750
Discounted: NPV = $2,016
Although the value is positive, it is much lower now than in 15-year case. Is it positive enough?
As an additional step, we can check CRF value. In this case it comes to 15% which is too high to make the investment financially attractive.
Simple payback: NPV = -$1,250
Discounted: NPV = -$2,055
With negative NPV values, this project is not considered viable over 5-year term.
Another thing to consider in the economics of the solar heat - industrial process combo is investment tax credits. Those incentives effectively reduce the up-front capital costs and may create a more favorable economic scenario and allow solar to compete with relatively cheap fossil fuel heat generation. So if available in specific location, tax credits should be included in the cash flow analysis.
9.3. Industrial Process Applications and Requirements
9.3. Industrial Process Applications and RequirementsThe use of solar heating technologies can be linked to a variety of industrial applications and can replace significant amounts of fossil fuels burned in the process. The potential is high since about 30% of industrial heating demand is withing the range of solar thermal systems. Typically solar heat is supplied via heated water, steam, or air.
Industrial heating needs can be categorized into three main temperature ranges:
(1) < 80oC - low temperature - flat plate solar collectors are capable of meeting these temperatures;
(2) 80 - 250 oC - medium temperatures - concentrating collectors are needed;
(3) >250 oC - high temperatures - this range requires imaging concentrated systems to achieve such high temperatures.
All of these categories can be matched with solar systems.
For learning about some specific applications and system designs, you are now re-directed to the following textbook chapters:
Reading Assignment
Duffie, J.A., and Beckman, W.A., Solar Engineering of Thermal Processes, Wiley and Sons, 2013, Chapter 16, Sections 16.4- 16.8 (13 pages).
9.4. Assignment
9.4. AssignmentThe Solar Heating and Cooling Program of the International Energy Agency is documenting the majority of solar thermal projects in a database. Understanding system components and how external forces, such as policy and alternative fuel costs, impact decision is critical to being effective in the sector of industrial processing.
This assignment is a series of short answer problems and calculations. These problems will require both conceptual thinking and some quantitative operations.
Lesson 9 Problem Set:
- Take a look at Figure 16.6.1 in the D&B text. Why would a system be designed with a flat plate collector in series with a concentrating collector? Please discuss at least two benefits of this configuration.
- Equation 16.4.1 in the D&B text says that the useful energy gain (Qu) of an open-circuit air heating system is proportional to the area of the collector (Ac), how much heat is removed from the system (FR) based on fan speed, and how much solar energy is incident on the collector minus optical losses (S). Check out a project in Germany of an air heating system for a vehicle paint shop. Which of the three variables (Ac, FR, S) that impact Qu must be increased if the system owner wanted to supply air to a second paint room? Why?
- There are several ways that a solar thermal energy system’s capital cost can be paid back within a reasonable time frame. Tax credits, other tax benefits such as depreciation, high alternative fuel costs (including a carbon tax), and more. Download the Lesson7-STE-Payback.xlsx file from Canvas in the Lesson 7 Module. If you do not have access to Microsoft Excel or an equivalent spreadsheet editor, use Google Drive (Upload the file to drive.google.com, check the box next to the file once uploaded to drive, then click More>Open with>Google Sheets). In that spreadsheet, there are several cells highlighted in green that are the input cells to the payback calculator. Adjust any/all of those values appropriately to achieve a system payback period less than 10 years. Your adjustments should match a specific project that actually exists (e.g., from the solar thermal projects database), including location specific details such as annual solar resource. Policy related adjustments (tax credits, carbon tax, etc.) should be based on real policies for your location. If you are not able to find actual policies for your location, policies from other locations are okay to use if necessary. All policy related adjustments must be supported by references. Deliverable: a write-up describing the project you are assessing including a table of your adjustment values, an exported payback graph from the spreadsheet, and written justification (including references) for each of the values that you selected.
Deliverable
Submit completed problems in a single pdf file to the Lesson 9 Dropbox in Canvas by 11:55PM on Wednesday. Please check Canvas Calendar for specific deadlines.
9.5. Summary and Final Tasks
9.5. Summary and Final TasksSummary
Solar heating for industrial processes is one of the largest potential markets for solar energy. However, unlike the photovoltaic industry, the solar heating for industrial processes has yet to really take off. In addition to being one of the largest potential markets for solar energy, solar thermal systems are really fundamental to the field of solar energy conversion systems. Not only are flat plate collectors comprised simply of pipes, black, and glass (technologically simple), but also the concept of absorbing solar radiation as heat has been around for thousands of years. It is about time that we start to make solar heating for industrial processes really work. The opportunity is very large.
Reminder - Complete all of the Lesson 9 tasks!
Double-check the to-do list on the Lesson 9 Introduction page to make sure you have completed all of the assigned tasks before you begin Lesson 10.
Lesson 10: Solar Thermal Power Systems
Lesson 10: Solar Thermal Power SystemsThe links below provide an outline of the material for this lesson.
10.0 Introduction
10.0 IntroductionConversion of solar to mechanical and electrical energy has been the objective of experiments for over a century.
Solar radiation is a great source of heat for generating steam. Steam is a highly useful working fluid that has been used to drive mechanical systems for centuries. Heat is heat, no matter what its origin. As such, as solar thermal technologies continue to be developed and decrease in cost, more and more thermal systems that are currently driven by steam that is generated from the burning of fossil fuels can have their fuel source replaced by the sun.
Learning Objectives
- Identify the steps of the processes required to convert solar energy to mechanical and electrical energy.
- Compare the thermal behavior of solar thermal power systems.
- Summarize the technical details of the solar thermal power systems existing and emerging over the globe.
What is due for Lesson 10?
This lesson will take us one week to complete. Specific directions for different assignments are given in the table below and within this lesson pages.
| Tasks | Assignment Details | Access/Directions |
|---|---|---|
| Readings | Required:
Supplementary:
| Registered students can use the following link to access the D&B textbook through the University Library. Other reading materials are available via Lesson 10 Module in Canvas |
| Assignment | Essay on the solar thermal power techologies | Specific directions for the assignment are provided on the respective page of this lesson. |
| Quiz | 10 multiple choice questions related to lesson readings | Registered students can access the quiz in the Lesson 10 Module in Canvas. |
| Course project | Peer critique on the course project pre-proposals is due this week | Please see your peer-review assignments in Canvas. The reviews should be submitted as comments or attachments to comment to each author's submission |
Questions?
If you have any questions, please post them to our Questions and Answers discussion forum in Canvas. I will check that discussion forum daily to respond. While you are there, feel free to post your own responses if you, too, are able to help out a classmate.
10.1. Overview of Solar Thermal Power Systems
10.1. Overview of Solar Thermal Power SystemsSteam has been used for centuries to perform mechanical work. Steam locomotive engines are probably one of the most popular machines known for converting steam to mechanical work. Any modern steam turbine does a similar conversion at higher energy conversion efficiency. Many steam turbines are used because of their high efficiency at turning steam energy into kinetic rotational energy. This rotational energy can be further used to drive an electricity generator or any other process that requires mechanical energy to operate. Historically, the steam required for such processes was derived from burning fossil fuels such as coal or natural gas, while solar thermal energy was used experimentally for over a century. Steam that is generated by renewable methods (such as solar radiation) is identical to steam generated by burning a fuel to heat water, and the principles of conversion of solar heat to mechanical and electrical energy are fundamentally similar to those used in combustion systems. Concentrating solar thermal technologies are best suited to achieve high temperatures under higher pressures, simultaneously meeting the demands of large-scale turbines that require a significant amount of high-quality steam. The general strategy of energy conversion using solar thermal energy is presented on the diagram below.

The solar energy obtained and converted to heat by the collector system is transferred by the thermal fluid to the storage and further to a boiler, where steam is generated. Further steam is supplied to a turbine in the heat engine, where it is converted to mechanical energy, while some heat is rejected. If the electric power is desirable output, the mechanical energy is supplied to a generator, where it is converted to electricity. At each conversion step, we can expect some losses due to non-100% efficiency. One of the challenges here is that the efficiency of the solar collectors decreases with increasing operating temperature, while the efficiency of the heat engine increases at a higher temperature (Duffie and Beckman, 2013). Therefore optimization is needed to select system operation conditions. Typically the temperatures delivered by the flat-plate collectors are too low for heat engines to be efficient; thus concentrating collectors (e.g. parabolic systems) or evacuated tubular collectors are more preferable choices.
The main configurations of solar thermal power systems include:
- Parabolic troughs
- Parabolic dish
- Central receiver systems (power tower)
- Solar updraft tower
You can re-visit those technologies on the Energy Information Association website
The overall efficiency of the power conversion system is composed of the efficiency of the solar collectors (with parabolic troughs, max ~75%), the efficiency of the heat engine (~35%). Minus field losses, the typical average overall efficiency of solar trough thermal plants is around 15-20%.
The following pages of this lesson refer you to various types and system designs.
10.2. Parabolic Trough Collector Systems
10.2. Parabolic Trough Collector SystemsParabolic trough technology is the most widespread among utility-scale solar thermal plants. The potential of this type of concentrating collectors is very high and can provide output fluid temperatures in the range up to 500°C. Parabolic trough is the linear-focus collector, which consists of a cylindrically curved parabolic mirror, which reflects the sunlight onto a tubular receiver positioned in the focus line of the parabola. The tubular receiver contains the fluid that absorbs heat and transfers it via circulation to the boiler or another device to produce steam.

Rows of parabolic mirrors are mounted in parallel on either a north-south axis (typical) or an east-west axis (there are pros and cons to each orientation based on location and energy production requirements) and move to track the sun across the sky. The tubes are very carefully designed to absorb solar radiation and transfer the heat to the heat exchange fluid passing through the tube. Fluid is pumped through the absorber tubes that are connected in series and parallel. Some systems employ an insulated storage tank to enable power generation when the solar resource is either intermittent (due to something like cloud cover) or unavailable (typically during the early evening hours). The heat transfer fluid is then passed through the storage tank, if it exists, and then pumped to heat exchangers to transfer the heat to water (except in the case of direct steam generation where water is already the heat transfer fluid and a heat exchanger is not needed) to generate steam for expansion in a steam turbine to generate electricity.
Solar Energy Generating Systems (SEGS) is the name of the world’s largest parabolic trough solar thermal electricity generation system, developed by Luz in southern California, USA. SEGS is the second largest solar thermal power plant in the world at 354 MW (surpassed by the 377MW Ivanpah Solar Power Tower system discussed in the next section). The three largest plants in the world currently range in size from 250 MW to 354 MW and are all located in the US. The next twelve largest plants in the world range in size from 100 MW to 200 MW and are all located in Spain.
Reading Assignment
Zarza Moya, E. Parabolic-Trough Concentrating Solar Power (CSP) Systems, Chapter 7 in Concentrating Solar Power Technology. Principles, Developments, and Applications., Lovegrove K., and Stein W., Eds., Woodhead Publishing, 2012. pp. 197-237. (This reading material is available in Canvas e-reserve Module 10).
Duffie, J.A., and Beckman, W.A., Solar Engineering of Thermal Processes, Wiley and Sons, 2013, Chapter 17, Section 17.3 (5 pages).
10.3. Central Receiver Systems - Power Tower
10.3. Central Receiver Systems - Power TowerUnlike linear concentrating systems (troughs), which reflect light onto a focal line, the central receiver systems send concentrated light onto a remote central receiver. A typical example of such a system is a solar power tower system, which consists of multiple tracking mirrors (heliostats) positioned in the field around a main external receiver installed on a tower. Such systems are capable of reaching of much higher levels of concentration than linear systems. Concentrated radiation is further used as heat to produce steam and convert it to electricity (like in a regular power plant), or the generated thermal energy can be stored in a molten salt storage.

Central receiver systems are typically large-scale plants that are usually built to power a steam cycle. The central position of the receiver offers a universal advantage to collect all energy at one location and save on transport networks. At the same time, the fixed position of such a central receiver results in a limitation of light collection: heliostats are always oriented at an angle to the direct beam, so the amount of energy collected is less compared to a parabolic concentrator. Therefore, to reach necessary efficiencies of light concentration, the size of the collecting field is increased, which brings into considerations such issues as land use, higher environmental impacts, and higher capital costs. Significant potential for developing large-scale central receiver solar plants is hence attributed to deserts and flat arid areas which have plenty of sunshine and lower land value with respect to other applications and industries.
The world’s current largest solar thermal power system is a power tower system named Ivanpah. Located in Southern California on the border with Nevada, Ivanpah has three main towers, nearly 2.5 million square meters of heliostats (mirrors), and can generate as much as 377MW of power under the right conditions. Worldwide, solar power tower systems have been used for decades to generate steam for both electricity generation and various industrial processes, with large-scale implementations in the tens of MW often for research purposes. Ivanpah is the first and only solar power tower plant in operation in the world that is larger than 20MW. While there are plans and ongoing construction in many countries around the world to build plants that are similar in size and even five times as large as the Ivanpah system, our global experience with such large solar power tower systems is very limited.
In the Ivanpah plant, there are several buildings near the base of the tower that contain the components of a typical steam electricity generation station. Once high-quality steam is generated in the tower and pumped down to the generation station at the base of the tower, the remaining components of the electricity generation system are no different than conventional electricity generation components.
Globally, some countries have much more history and subsequent experience with solar power towers. Spain and the USA are the two leading nations, with many other countries operating small power tower systems or currently developing plans to construct large (>10 MW) solar power tower electricity generation stations. The USA currently houses the largest solar power tower plant in the world and has the history of Solar One and Solar Two, which are currently decommissioned, but were 10 MW in size. Spain houses three active solar power tower systems larger than 10 MW with plans to build three more of that magnitude.
Further please proceed further to the following sources to learn about basic configurations and design of the central receiver solar power technology and some specifications of the heliostats and receivers utilized in known facilities of this type.
Reading Assignment
Book chapter: Vant-Hull, L.L., Central Tower Concentrating Solar Power (SCP), Chapter 8 in Concentrating Solar Power Technology. Principles, Developments, and Applications., Lovegrove K., and Stein W., Eds., Woodhead Publishing, 2012. pp. 240-281. (This reading material is available in Canvas e-reserve Module 10).
Duffie, J.A., and Beckman, W.A., Solar Engineering of Thermal Processes, Wiley and Sons, 2013, Chapter 17, Sections 17.4-17.5 (5 pages).
10.4. Solar Updraft Towers
10.4. Solar Updraft TowersSolar updraft towers for generating electric power were first conceived over a hundred years ago. Several prototypes have been developed over the decades, and some have been implemented and operated over the course of several years. These prototypes vary in size and scale, with the largest ones capable of producing tens of kilowatt of power with towers that are a couple of hundred meters tall (most notably, the solar updraft tower in Manzanares, Spain with a tower of 194 m tall and capable of producing 50 kW of electrical power).

Figure 10.4: Solar Chimney prototype at Manzanares, Spain. The tower is seen through the polyester roof.
The principle of operation of solar updraft towers is based on the stack effect: difference in the density of air due to temperature and humidity differences can drive air movement. Solar energy is used to increase the air temperature at the bottom of the tall chimney (tower), creating a gradient in density, which creates upward air movement. This solar-induced "wind" is used to rotate wind turbines installed in the confined space in the chimney. The power output of a solar updraft tower depends on two design variables - solar collector area and height of the tower. The collector is represented by a greenhouse-like structure at the surrounding ground at the base of the tower, and the commercial size collectors are designed up to 4-5 square miles in area. A greater height of the tower creates greater pressure gradient due to stack effect and results in more usable wind power. The known system heights are in the range 100-200 m, while systems as tall as 1500 m are being proposed (Wikipedia- Solar Updraft Tower).
There have been and continue to be many proposals for projects in countries around the world for solar updraft tower systems that are incredibly large compared to the scale that has been proven to date. The high capital cost remains the main barrier to commercialization and widespread use of this technology.
Supplemental reading:
Grouse, T.K., Solar Chimneys Can Convert Hot Air to Energy, But Is Funding a Mirage? National Geographic, April 16, 2014. URL: http://news.nationalgeographic.com/news/energy/2014/04/140416-solar-updraft-towers-convert-hot-air-to-energy
Zhou, X and Xu, Y., Solar Updraft Tower Power Generation, Solar Energy, 128, 95-125 (2016).
This paper presents a comprehensive technology review with some analysis of the performance, cost, and impacts.
10.5. Assignment
10.5. AssignmentA lot of solar technologies appear to be very similar at face value. However, the history of various technologies as well as knowledge of how each system works help reveal why certain technologies are selected over other solutions. Parabolic trough was mentioned as most widespread solar thermal power technology, and there should be reasons.
For this lesson assignment:
- Summarize in a table the main cons and pros of the four types of the solar power systems listed in this lesson - parabolic trough, central receiver, parabolic dish, and solar updraft tower (Take into account both technical and economic factors).
- Provide a discussion as to why certain technologies in this list out-pace others. What are the primary barriers preventing any of these technology options from becoming more widely accepted? Do you have any reason to think that one of the current technologies will become the sole winner in solar thermal power market?
Some supplemental reading resources that can be helpful in this assignment are provided in Module 10 in Canvas.
Deliverable - Lesson 10 Assignment
Submit your table and essay as a single PDF or MS Word file to the Lesson 10 Dropbox in Canvas by 11:55 PM on Wednesday.
10.6. Summary and Final Tasks
10.6. Summary and Final TasksSummary
Solar thermal power systems are a great way to convert solar radiation to electricity. Historically, there have been many complex issues that have been addressed one by one, making utility scale solar thermal power systems a reality today. Concentrating solar power systems are the main enabler of this reality. By concentrating solar radiation with parabolic troughs or heliostats, higher temperatures and, thus, higher quality steam can be achieved at competitive cost.
Reminder - Complete all of the Lesson 10 tasks!
Double-check the to-do list on the Lesson 10 Introduction page to make sure you have completed all of the assigned tasks before you begin Lesson 11.
Lesson 11: Solar Drying, Desalination, and Chemical Applications
Lesson 11: Solar Drying, Desalination, and Chemical ApplicationsThe links below provide an outline of the material for this lesson.
11.0 Introduction
11.0 IntroductionSolar thermal energy can be applied to any process that would otherwise require the use of heat or electromagnetic radiation (within the solar spectrum). Three main areas that will be covered in this lesson are solar drying, desalination, and chemistry applications. All three areas are closely connected to the topic of energy sustainability and related question - how can we use renewable energy for any process or application if in some foreseeable future there is no more access to fossil fuels? Furthermore, desalination technologies may become a major part of the sustainable water management, especially in the arid areas with acute water shortages.
Learning Objectives
- Explain the active and passive designed for solar dryers.
- Estimate the parameters of the solar desalination system for an application.
- Articulate the features of solar system designs for drying and desalination processes.
What is due for Lesson 11?
This lesson will take us one week to complete. Specific directions for different assignments are given in the table below and within this lesson pages.
| Task | Assignment Details | Access/Directions |
|---|---|---|
| Reading |
Required:
Supplemental:
|
Registered students can use the following link to access the online textbook through the University Library. Specific pages to read are indicated in the respective sections of the lesson. |
| Assignment |
Solar desalination still design |
Specific directions for the assignment are provided on the Assignment page and in Canvas (Module 11). |
| Quiz | 10 multiple questions related to readings | Registered students can access the quiz in the Lesson 11 Module in Canvas. |
| Discussion | Solar chemical applications | Registered students can access the discussion board in the Lesson 11 Module in Canvas. |
Questions?
If you have any questions, please post them to our Questions and Answers discussion forum in Canvas. I will check that discussion forum daily to respond. While you are there, feel free to post your own responses if you, too, are able to help out a classmate.
11.1. Solar Drying
11.1. Solar DryingSolar dryers are predominantly used in agricultural industry to dry foods for storage purposes. There are direct and indirect types of solar dryers.
The direct drying systems expose the product to the direct sunlight. The key processes here are heat transfer from the heating source to the target product and mass transfer of moisture from the product to the air. In these systems, the drying process is sometimes assisted by air flow, which helps to transport moisture convectively.

Indirect dryers use absorbing surfaces, which heat the air, which is further passed over the target product. So there is no direct contact of the solar radiation with the product in this design. In indirect systems, it is easier to protect the agricultural product from external damage (weather, birds, insects, direct radiation).
The main idea of dryer system is to supply more heat to the process than would be available under ambient exposure and also to improve moisture migration via active or passive design.
Active and passive solar energy dryer designs are overviewed in the following reading source:
Reading assignment
Kalogirou, S.A., Solar Energy Engineering, Chapter 7. Section 7.4. Solar Dryers. (7 pages)
This book is available online through the Penn State Library system.
Supplemental Reading on Solar Drying
Belessiotis, V. and Delyannis, E., Solar Drying, Solar Energy 85 (2011), 1665-1691.
11.2. Solar Desalination
11.2. Solar DesalinationSolar desalination is an elegant combo since the solar heat, which in arid areas creates problems with fresh water shortages, is used to counter-act the problem. This idea has been under development and implementation in zones which will probably have to rely on desalination of seawater to meet their potable water needs, such as California, Israel, Arabian Peninsula, and some others.
One of the processes that can be used for desalination is water distillation. It is one of the oldest approaches when thermal energy is used to evaporate water from a saline solution and condense it in a separate collector. What is left behind is more concentrated brine solution or in case of complete evaporation? Solid salt. This process has been used for millennia for production of salt fromseawaterr. There are salt production facilities around the world that still use the same salt production techniques that were developed hundreds of years ago. The earliest use of solar distillation for obtaining fresh water is attributed to Aristotle (4th Century BC).
Example of a small scale self-made system is given in the figure below. In this design, black-backed water basin is absorbing solar radiation, and the evaporating water is condensed on the tilted dome or roof, further dripping down to the channel and directed for collection. This is the same process that is used by nature to power the evaporation/condensation/rain/stream cycle, but in a contained and controlledenvironment.

While on the topic of the history of solar desalination, during World War II, the use of a portable solar still that was included in U.S. Air Force and Navy emergency kits saved many lives in the South Pacific. When airmen and seamen were stranded at sea for extended periods of time, survival was possible through the production of clean drinking water by a solar driven desalination process.
Today, there are many solar thermal desalination water production facilities around the world of much larger scale, but based on the same physical principles. Those may use direct sunlight or standard collector technologies to provide heat for the extracting of clean water from seawater or brackish water.
Learn more about solar distillation and evaporation processes in the following reading:
Reading assignment
Kalogirou, S.A., Solar Energy Engineering, Elsevier 2009. Chapter 8, Sections 8.1 and 8.3. (12 pages).
This book is available online via Penn State library system
Distillation vs. Reverse Osmosis
Distillation is much cleaner process compared to the reverse osmosis technique used by many contemporary desalination plants. In this technology, water is pushed through the semipermeable membrane, which separates out the ions, macromolecules, particles, and other contaminants contained in water. One of the cons of this method is the need for pressurization, which is commonly achieved by applying conventional energy sources (electric high-pressure pumps, etc). Hence this technology is a potential contributor to carbon emissions if fossil fuels are used in powering the process. Its energy efficiency has been improving, so it is still the most widespread method of commercial desalination. Recent reports boast 3 kWh/m3 of processed water as energy rate. Another disadvantage of the reverse osmosis is waste water production. Not all water entering the system passes through the membrane - 15 to 85% (depending on the operating pressure) of it is rejected and sent to the wastewater stream. The necessity to dispose off the wastewater containing increased amounts of salts and contaminants is an additional problem, which adds to the cost and complexity of operation.
Passive vs. Active Solar Desalination
The passive methods of solar desalination do not use any heat collectors, but rather use the direct sunlight for evaporating the input water. Although this creates a limitation on the system efficiency and rate of fresh water production, the simplicity of design makes passive devices applicable at the field conditions at different scales (e.g WaterconeTM or CarocellTM products etc.).
The active methods employ flat-plate, CPC, or parabolic trough collectors to provide higher temperature heat and enable faster distillation process. One of the examples is Aqua4 technology designed by WaterFX with the purpose of reclaiming process water and make businesses and communities less dependent on imported fresh water. The technology is modular, and each module combines a parabolic trough collector and steam-heated evaporator, which is able to produce fresh water with 90% efficiency as well as recover solid salt components.
You can learn more about this project from the video and WaterFX website:
WaterFX-Aqua4 (5:30)
Transcript: WaterFX-Aqua4 (5:30)
PRESENTER: For our customers to be able to control their own water resources. So we're developing tools and technology here at the aquifer demonstration plant that will enable large uses of water to actually reclaim their own fresh water, rather than depending on the outside delivery of water to them. We've partnered with the Panoche Water and Drainage District, as the Panoche Water District has done a lot of work to look at different drainage reuse scenarios.
They've tested a number of different technologies. They've designated land as a drainage region. They are even looking at growing salt tolerant crops, things like Jose tall wheat grass that actually can handle higher levels of salinity So we're amongst a very progressive water district, that is sort of leading the charge in developing new solutions.
The challenge is finding an outlet for the drainage water. We've reached the point where local water resources, especially in water scarce regions like California, are no longer suitable. The quality has declined over time, because there are a lot of natural minerals and natural salts in the ground. That drainage water can range in salinity from a couple of thousand parts per million, all the way up to 15,000 parts per million-- which is about half the salinity of seawater. And because the drainage water has that level of salts that's not suitable for discharge to the river systems, because it affects the natural wildlife.
The primary objective is we want to recover freshwater, and use that freshwater for agricultural purposes, for potable consumption, for any use of fresh water that you can think of. But the secondary objective is that we actually want to concentrate the salts and recover the valuable components. And so what we're doing here at this particular demonstration project, is we're going to recover that drainage water, and treat it so that it can be reused as fresh water and we can actually remove the salts. In the salts themselves, there's chemicals, there's metals, there's fertilizer, and there's components that can be used for building products. So there's a number of things in there that can actually generate revenue. The water that we produce here is the highest quality fresh water. It's pure H2O, and so it can be used for any fresh water purposes.
The Aqua4 technology involves four distinct steps. The first stage is to collect solar radiation in a concentrated solar collector. We use that energy to generate heat and deliver the heat through a mineral oil to the second stage, which is a multi-effect evaporator.
In the evaporator, we basically generate steam from the heat, and we use that steam to condense and recover fresh water. And then the steam is efficiently used in three separate effects to generate the product water. The third stage is a heat pump, where we efficiently recover waste steam to increase the productivity. And the fourth stage is a thermal storage system, where we store excess heat, and we use that to run the plant 24 hours a day.
Aqua4 is a concentrated solar still. It's a device for capturing solar energy and using that energy to generate heat and evaporate and recover fresh water. The concept of a solar still is not new. It's a technology that's been around for literally hundreds of years. But what we've done here is we've made it quite a bit more efficient, and we've accelerated the rate of evaporation by a factor of about 30. So whereas with natural solar energy you would require, let's say, an area of 30 acres to evaporate a given volume of water, with this particular technology, we can do the same rate of evaporation in 1 acre.
The design of the system is such that we wanted it to be highly modular and highly scalable. So we want the same system to be usable for very small applications all the way up to very large scales. So the way it's been designed, a single module takes up about 6,500 square feet and at commercial scale will produce about 65,000 gallons per day of fresh water or treat 65,000 gallons per day. So that boils down to about 10 gallons per square foot per day. And that basic number can be used to scale this system up really to any size.
Every year, water availability has become tighter. And so this year as an example, the water districts in this particular area only received about 20% of the water that they're allocated. And so when the availability of water goes down, the cost obviously goes up because they have to scramble to find alternative sources. And that does affect food prices. It affects economic activity in the state. It affects agricultural jobs. And so we think that this is one potential solution to alleviate the dependency on imported water and instead put the control over water resources back in the hands of the businesses that utilize water.
The systems such as the one demonstrated in the video are classified among the indirect systems because there is not direct exposure of the input water to the sunlight. Instead the solar heat is absorbed by a solar collector and further used to run a disalination process. Learn more about the indirect desalination processes in the following reading:
Reading Assignment
Kalogirou, S.A., Solar Energy Engineering, Elsevier 2009. Chapter 8, Section 8.4 Indirect Collection Systems. (12 pages).
This book is available online via Penn State library system.
Solar Moisture Extraction
There are relatively new methods being developed at the research level that use liquid desiccants to extract water from air. This does not exactly fall within the desalination field, but pursues the same purpose - providing potable water. Liquid desiccants, such as brine solutions (e.g. LiCl) are used to absorb moisture from air; then solar heat is used to regenerate the desiccant by evaporating water, which is collected as condensate. This technology is even applicable in very hot and dry climates (deserts). Source: Science Daily
11.3. Chemistry Applications
11.3. Chemistry ApplicationsSolar thermal energy can be used to drive chemical processes in such areas as fuel reforming, materials processing, detoxification, catalysis, and photolysis to name a few. This is not a complete list, and new ideas and technologies are constantly research and analyzed to take advantage of the available solar resource.
Here are a couple of examples:
Photolysis is the process in which solar radiation is directly absorbed by reagents to create a certain reaction product. For instance, photolysis can be used for the disinfection of clear water for drinking by placing contaminated water in clear plastic (PET) bottles in the sun for several hours of direct radiation. Through the combined use of increased temperature and ultraviolet radiation, water that contains pathogens, such as microorganisms or bacteria, will become potable as the pathogens are killed by the UV light and increased temperature over the course of several hours in full sun. This process is typically used at small scales for individual household use in the developing world, and is recommended by the World Health Organization for purifying and storing household water.
Photocatalysis uses solar radiation as a catalyst of a chemical reaction. In this case not necessarily solar thermal energy is the main input. Either visible light or ultraviolet components of the solar spectrum can be used to trigger electrochemical reactions or to increase the rate of reactions in the prosence of a catalyst. An example of photocatalysis is photo-catalytic oxidation (PCO). In this process visible and UV photos are combined with the nano-catalytic material to destroy volatile organic compounds, fungi, and bacteria. This approach is applied in sanitation and air purification.
The following reading provides you with an overview if solar chemistry applications:
Reading Assignment:
Kalogirou, S.A., Solar Energy Engineering, Elseveier 2009. Chapter 7. Section 7.3. (10 pages)
This book is available online via Penn State library system
11.4. Assignment
11.4. AssignmentRobinson Crusoe Problem
Scenario: pretend that as a result of ship wreckage you find yourself on an isolated island with plenty of sunshine, but with no fresh water supply. Luckily some materials and some tools are washed out to the shore that can be used for building a solar desalination still.
Assignment: create a design for the solar desalination still, identify the materials, and make a corresponding schematic of the system.
Key Question: How large should be the water basin under the still to safely provide for your daily potable water needs? Support your answer with necessary calculations.
Tip: The property to determine is mw - the hourly distillate output per square meter. Please use the chapter book resource referenced below to treat this problem analytically. You will need to find data or make educated assumptions on the system parameters and properties to include in this treatment. Please provide references to your sources.
Performance of Solar Stills:
Kalogirou, S.A., Solar Energy Engineering, Elsevier 2009. Section 8.3.2. p.436.
This book is available online via Penn State library system.
Deliverable - Lesson 11 Assignment
Submit your report as a single PDF file to the Lesson 11 Dropbox in Canvas by 11:55 PM on Wednesday.
11.5. Summary and Final Tasks
11.5. Summary and Final TasksSummary
This lesson reviwed some of the smaller size applications of solar thermal energy, which may create significant value in rural areas as sustainable technologies that do not require extensive infrastructure, fuels, or sophisticated materials for operation. Our consideration was mainly confined to solar drying and solar desalination as most widespread and most assessed processes. However, there are certainly more applications, such as chemical synthesis, washing and sterilization, timber treatment, brick curing, and others which comprise a long list of possible uses of solar heat.
Reminder - Complete all of the Lesson 11 tasks!
Double-check the to-do list on the Lesson 11 Introduction page to make sure you have completed all of the assigned tasks before you begin Lesson 12.
Lesson 12: Markets for Solar Thermal Energy Applications
Lesson 12: Markets for Solar Thermal Energy ApplicationsThe links below provide an outline of the material for this lesson.
12.0 Introduction
12.0 Introduction"Compared with other forms of renewable energy, solar heating’s contribution in meeting global energy demand is, besides the traditional renewable energies like biomass and hydropower, second only to wind power… In terms of cumulated installed capacity in operation solar thermal is almost equal with wind power by end of 2015"
Solar Thermal Energy (STE) is available in many different market sectors. The rate of growth is variable, and recent report show stiff competition of STE with emerging PV, wind, and other renewables. The purpose of this lesson is to give an overview of the current status of STE markets as well as trends for future development. In the dynamic energy market picture, in the recent years, we can see significant re-orientation of solar thermal towards smaller scale applications.
"In 2014, 94% of the energy provided by solar thermal systems worldwide was used for heating domestic hot water..." [Mauthner et al., 2016]
Learning Objectives
- Recognize markets available for utility scale solar thermal energy.
- Recognize markets available for small-medium scale solar thermal.
- Differentiate markets by system attributes (i.e. scale).
This lesson will take us one week to complete. Specific directions for different assignments are given in the table below and within this lesson pages.
| Tasks | Assignment Details | Access/Directions |
|---|---|---|
| Read | Required:
Supplementary:
|
Most of assigned reading materials are available online and can be accessed through links in this lesson. |
| Discussion | Future investement opportunities in solar thermal systems | Registered students can access the Lesson 12 discussion board in Canvas. |
| Assignment | Market overview chapter for your course project proposal | Specific directions for the assignments are provided on the respective page of this lesson and in Lesson 12 module in Canvas. |
| Quiz | 10 multiple choice and short answer questions closely related to readings. | Registered students can access the quiz in the Lesson 12 Module in Canvas. |
Questions?
If you have any questions, please post them to our Questions and Answers discussion forum in Canvas. I will check that discussion forum daily to respond. While you are there, feel free to post your own responses if you, too, are able to help out a classmate.
12.1. Market Overview for Solar Thermal Energy
12.1. Market Overview for Solar Thermal EnergyWhat is the main rationale for detailed market analysis in solar energy field today?
Understanding the current state of the market and future trends will help with the following:
- Identifying key growth and investment opportunities in the global solar thermal market;
- Identifying key players and stake holders on market and their strategic moves;
- Making decisions with respect to technology development based on history and forecast data
- Develop business strategies based on the latest economy, customer base, and policy related to the solar thermal field
- Dealing with potential issues and restraints
- Minimizing economic risks
Solar thermal energy markets are diverse and range widely in their fields of application. We can identify six main market areas:
- Solar water heating
- Building heating
- Solar cooling
- Industrial process heat
- Thermal power systems
- Solar ponds
Each of these fields is briefly summarized below. Note that each field may have their own trends in market, which depend on local conditions, economy, and policies.
Solar water heating is performed all over the world and is one of the most widely used forms of solar thermal energy. Systems can be active with a mechanical pump, or passive with either a thermosyphon or geyser pump driving the fluid flow through the collector(s). Additionally, collectors can be constructed from a range of materials as simple as plastic sheets, laminated together with no glazing, for pool heating and as complex as multi-layered glass over black copper fins in a black aluminum enclosure.
Solar building heating can also be an active or passive activity. While active solar building heating is very similar in nature to solar water heating, passive solar building heating design results in some creative and interesting architectural requirements that are derived from the use of strategically placed thermal mass and the subsequent aperture requirements to effectively use a building as a solar thermal collector with high heat capacitance. Passive solar building design is a large field that combines meteorology, thermodynamics, fluid mechanics, and human thermal comfort. The Passive House (Passivhaus) Standard is the highest bar that is widely used for designing buildings that use significantly less energy than is required by most building codes. Solar heat gains are one of the required energy inputs to accomplish this level of energy reduction in a building.
Solar cooling has been a field of great interest for many people for many years. The concept of using heat from the sun to drive a cooling process that exists primarily because of that same source, the sun, is very desirable. This is because if solar radiation is not available over some time frame, presumably the loss of that source of heat reduces the cooling loads over that same time frame. Coupling the cooling source’s energy supply to a same driver of the cooling loads enables a balanced system design. Methods for solar cooling include desiccants, absorption chillers, mechanical systems such as Rankine engines, and passive systems.
Solar industrial process heat can range in use case from large textile factories to small rural agricultural processes and anything in between. Any industrial process that requires heat (particularly as steam) can be integrated with a solar thermal energy conversion system to increase the solar utility of that company or individual. This is particularly applicable in cases where a solar thermal system can supplement either an existing heat system such as steam or a process that does not need to run continuously and can instead run in batches when the sun is shining with sufficient intensity to generate the heat required.
Solar thermal power systems are one of the most publicized forms of solar thermal heat. Using solar thermal energy to generate high quality steam for use in a standard electricity generating steam turbine is happening world wide on the scale of hundreds of MWs of power, the largest of which, at 392 MW, is currently the Ivanpah Solar Power Facility in California that we read about in an earlier lesson. These types of systems have been under development for several decades now, and have now started crossing over the levelized cost of energy barrier through cost reductions and economies of scale.
Solar ponds can be used for multiple purposes ranging from active electrical power generation to distilling water and producing salt. Most of the solar pond research and testing for novel applications has occurred in Israel. One of the oldest solar driven evaporative processes is the production of salt, which occurs worldwide and accounts for about one third of the world’s annual salt production.
All of these STE markets have been capitalized on to some extent, but all of them have a lot more room to grow in both research as well as implementation. As energy costs continue to rise, solar energy of all forms may become more attractive in various locations. When working in any field, it is good to know what alternatives and options are available as both competitors in your sector (one solar thermal water heating system versus another) as well as alternative application of your core technology (solar thermal concentrators for power generation versus industrial processes).
Reading Assignment
The following report contains overview of the status of these technologies and discusses the current market trends. Please read it with the question in mind: what solar thermal systems will be in use next year, next decade, and what systems - not?
Mauthner, F., Weiss W., abd Spork-Dur, M.,Solar Heat Worldwide, Solar Cooling Heating Programme, International Energy Agency, 2016.
Supplemental reading:
This report shares results of STE market analysis in Europe. The trends we see in such solar-leading countries as Germany and Spain are not necessarily repeated in other parts of the world. Can you think of a few reasons?
Solar Thermal Markets in Europe, European Solar Thermal Industry Federation (ESTIF), 2015
12.2. How to Identify a Good Market for STE
12.2. How to Identify a Good Market for STEWhen determining which types of STE systems are best for a certain area or application, several key pieces of information need to be identified:
- The temperature of targeted application
- The solar resource at the given locale
- Schedule for the required energy use.
With these three pieces of information, the system selection can be made relatively straightforward. Once the system types are known, the capital and operating costs can be evaluated and compared with alternative (conventional) fuel system costs.
To determine a required temperature, you may need to do some research on similar systems or to contact the facility management directly.
To assess the solar resource, there are a handful of tools available for free that can provide solar radiation information at varying levels of detail depending on your location. The most widely used meteorological information is a Typical Meteorological Year (TMY) file, which contains solar radiation data. While the TMY data does not contain inter-annual extremes, it does capture typical seasonal variation, which should be sufficient for any first level market assessment. TMY data is available for the whole world from the EnergyPlus website but is formatted for EnergyPlus. The data can be extracted manually using a spreadsheet or script but is not readily available on the web. Historical actual meteorological data, containing seasonal variations from year to year, can be obtained for the U.S. from solaranywhere.com. Basic solar resource information for Africa, Asia, and Europe can be obtained from PVGIS.
To assess the load schedule for a given solar thermal application, the existing schedule, requirements, seasonal and daily variations, and overall flexibility of the process need to be explored. This requires good understanding and some research on the targeted process.
The following table matches some applications with solar thermals technologies implemented. The data contained in the table are from Chapter 16 of Power From the Sun.
| Project | Process | Collector Type | Collector Fluid | System Output |
|---|---|---|---|---|
| Campbell Soup Co., Sacramento, CA | Can washing | Flat plate and Parabolic Trough | Water | 91 °C process hot water |
| Reigel Textile Corp., La France, SC | Textile drying | Flat plate | Water/ethylene glycol | 88 °C boiler water preheat |
| York Building Prod., Harrisburg, PA | Concrete block curing | Multireflector linear concentrator | Water/ethylene glycol | 71 °C process hot water |
| Various | Food and/or Lumber drying | Flat plate and/or Evacuated tube | Air and/or water | 80 to 60 °C drying/preheat air |
| Johnson & Johnson, Sherman, TX | Gauze bleaching | Parabolic Trough | Pressurized water | 175 °C / 0.86MPa process steam |
| The Home Laundry, Pasadena, CA | Laundry processing | Parabolic Trough | Pressurized water | 171 °C / 0.83MPa process steam |
| ORE-IDA Foods, Ontario, OR | Fryer heating | Parabolic Trough | Pressurized water | 216 °C / 2.17MPa process steam |
| Southern Union Gas, Hobbs, NM | Oil Refining | Parabolic trough | Oil | 191 °C / 1.28MPa process steam |
12.3. Solar Heating and Cooling Status and Trends
12.3. Solar Heating and Cooling Status and TrendsSolar heating and cooling, especially distributed energy systems, are considered especially promising in the context of strong emergence of PV solar technologies to the solar power markets. Interestingly, in 2014, 94% of the energy supplied by solar thermal systems worldwide was used for heating domestic hot water, mainly by small-scale systems, mainly including in single-family houses (68% of load) . Other larger applications such as multi-family houses, hotels, schools, accounted for ~27%. [Solar Heat Worldwide, 2016]. This niche is expected to expand.
Video assignment
The SolarThermalWorld webinar (video below) overviews the key data and findings of the recently published comprehensive studies of solar heating and cooling employed in different parts of the world. These studies looking at new installations, industry trends, and market barriers.
SolarThermalWorld Webinar (1:15:47)
Transcript: SolarThermalWorld Webinar (1:15:47)
NIGEL COTTON: Good morning, good afternoon, good evening, depending on where you are in the world. And welcome to today's webcast, "Status of Solar Heating and Cooling Worldwide" is brought to you by solarthermalworld.org.
This webinar is jointly organized by REN21 Secretariat. And international agency Solar Heating and Cooling Technology Program. I am Nigel Cotton, founder of solarthermalworld.org and program director at the European Copper Institute. I am your moderator for today.
Before we begin, I'll just give you a few housekeeping announcements. This webinar is designed to be interactive between you and the presenters. Slides will be available within 48 hours of the end of the webinar on solarthermalworld.org. This presentation is being recorded.
You can do participate in the questions and answer session at the end of the presentation by asking questions at anytime during the presentation. Just type the question into the Q&A widget to the left of the slide window. And then click.
You may address the area of any widget, such as the slide area, by dragging the lower right hand corner of the widget window, and dragging the mouse. The slides will advance automatically throughout the event.
The web and will last about one hour, 30 minutes, 20 minutes for each presentation and approximately 20 minutes of Q&A after the presentations. If you are experiencing problems with the program, please refresh your browser or close your window and relaunch the presentation.
OK. Now, onto today's presentations. Discussing today's topic will be Rana Adib, the research coordinator at REN21 Secretariat. And she will be highlighting the status of renewable energies based on REN21's Renewables 2016 Global Status report. Following her will be Werner Weiss. He's director of the Austrian Institute AEE INTEC and co-author of the study "Solar Heat Worldwide from the IAA Solar Heating Cooling Program" Werner will share key data on solar heating and cooling from the study on added capacity, prospering application, jobs, and costs.
The third speaker will be Barbel Epp, news editor of the solarthermalworld.org and author of the Global Status Report Section Solar Heating and Cooling Market and Industry Trends. We'll present recent developments in the industry and policy.
My name is Nigel Cotton. I am a founding member of ESTIF, the European Solar and Thermal Industry Federation. And part of several organizations and founder of solarthermalworld.org.
OK. Now we will move on to the presentations. The first one is from Rana. So, Rana, your slides are now up. OK. You may begin, Rana.
RANA ADIB: OK. Thank you very much, Nigel, and thanks for the introduction and the opportunity to do the webinar and collaboration with you. Hello, everybody. I'm very happy to have this opportunity to speak about the topic, which is not always so visible, but very important when we are talking about the energy transition. And I'm really excited also to host this webinar together with AAE INTEC, the IA Solar Heating and Cooling progarm and SORICO, as well as Solar Thermal World.
So I will present to you some key results of the Renewables 2016 Global Status report, which REN21, which is a renewable energy pulse network for the 21st century, is producing every year. Sorry.
Hello? Nigel, could you eventually show the slides? Can you hear me?
NIGEL COTTON: Yeah. Is that visible now?
RANA ADIB: Yes. It's visible. Thank you. Sorry for that. So what is REN21? We are a global multi-stakeholder network which is dedicated to the rapid uptake of renewable energy worldwide. And we're representing basically a network of different types of organizations. There are NGOs, science and academia, international organizations, national government, and industry association.
It's basically the coalition of the willing to reach the energy transition building on renewable energy. The objective is really to foster renewable energy deployments, focusing in particular also on the policy and regulatory angle of it.
Sorry. I got an error, again. Sorry for that, Nigel. OK. Sorry for this.
So every year-- I'm mentioning the fact that it's multi-focal in network because this is something which is really fundamental also to our approaches when we are producing the Renewable Global Status report. It is a report which is produced as a collaborative effort of a network of 700 experts worldwide, of which something like 350 are really actively participating.
And this report is basically aiming to illustrate in a very neutral way the status of renewable energy. There is a focus on the global overview, which is looking in particular at the power sector, heating, and cooling, and transport market and industry trends where we're looking into the different renewable and the technologies, distributed renewable energy for energy access.
The investment flow. This is in cooperation with UNAP and Bloomberg New Energy Finance. The policy landscape since two years-- actually, we have a full section of energy efficiency, just because the energy transition is not possible if we do not also look into energy demand. And this is certainly a topic which also needs to be-- I mean, the awareness needs to be raised. It needs more integrated approaches also, looking into renewables and energy efficiency.
And we have a feature every year, which is changing. In this edition, we have a feature specifically on community renewable energy. So the report covers all renewable energy technologies, power, heating, and cooling, and transfer sector. Data collected throughout the process are available on the Renewables interactive map.
Here you see the community. And I'm mentioning this because we also see that basically the data for the heating and cooling sector is often more dispersed. So we're really looking or are trying to mobilize lots of players who think that they might have a piece of the puzzle, basically, to contribute here.
Our objective is clearly to strengthen the section on heating and cooling and on transfer, just because we see that there is a big focus on power from policymakers, from industry. But we need to address these factors more. And that's also why we're really happy to have this webinar. So if you have the impression that you could be interested or could contribute, please don't hesitate to contact me.
So what is the status in 2016? It has been an extraordinary year for renewal energy, with 147 gigawatt of renewable power capacity added in 2015, which is the largest annual increase ever. So this is really significant. It's also important to mention that the inflow capacities in new power-- the new added capacities in the power sector exceed for the second time the installed capacities in fossil fuel-based power generation capacity.
So here we clearly see that there is a big trend towards renewable energy power. And this is driven very much by the wind and the PV sector, and obviously also by low cost or decrease cost in these sectors.
In the renewable heat sector, there is also a positive trend with an increased capacity of 38 gigawatt thermal. However, the developments are at a slower pace. Total biofuels production also rose. So when we hear these positive trends occur, it's important to keep in mind that in 2016, basically, the fossil fuel prices were really low, which mean that-- which makes renewables shine more, I guess, because they have been so successful.
We have some renewable energy indicators, but there are obviously also some champions. When we are looking into the investment and the renewable power and fuels, not including large hydro, the front runners are China, the US, Japan, United Kingdom, and India.
The picture is very different when we bring this down to a unit of GDP, with Mauritania, Honduras, Uruguay, Morocco, and Jamaica being front runners. And this is something which is really interesting because we see a shift from traditional historic markets to developing countries. And we also see that there is a key engagement of developing countries to deploy renewable energy.
Interestingly, when we are looking into the renewable power capacity per capita amongst the top 20 countries, we have Denmark, Germany, Sweden, Spain, and Portugal. And I'm raising this because this really shows that the importance of policy engagement. These are countries which engaged into the renewable energy route since a long time, have set up these policy and regulated frameworks. And this is really reflected by the fact that they are leading.
When we're looking into the heat sectors, solar watt heating collector capacity, China, the US, Germany, Turkey, and Brazil are forerunner. Per capita, it's, again, Austria, Cyprus, Israel, Barbados, and Greece.
I mentioned the cursorial of policy. So today, almost all countries have either renewable energy targets and/or renewable energy support policies. What we clearly see-- and you have the blue bars are the power policies, the orange ones are heating and cooling, and the green ones is transfer. So we clearly see that there is a focus of policymakers on the power sector.
And what we also see in the power sector is that with the evolve or the development of the markets, we also see a shift of type of policies. Historically, we have lots of hidden tariffs. And now we see that countries with the majority of the markets cascading down are growing more and more into tendering auction systems.
So you can see that we have 114 countries with power policies, 66 countries with transfer, and only 21 countries with heating and cooling policies. Here, when we are talking about heating and cooling, we are looking at the technology-neutral obligations and solar obligations. So there is a lot of space for improvement. That's clearly a lesson of 2016.
Coming to the power sector, renewables accounted for 28.9% of global power generation capacity, and 23.7% of the global electricity demand. They made up 60% of net additions-- sorry, something moved here-- to global power capacity. And the total renewable energy power capacity was 1,849 gigawatt, which is an increase of over 9% or-- sorry, increase of almost 9% compared to 2014. We clearly see that hydropower plays a big role. But the other leaders are wind, bio power, solar PV.
When we are looking at the heating and cooling sector-- and just the fact that I'm not able to show you, say, similar slides in the heating and cooling sector, as we have in the power sector here, shows already that we have another challenge in the heating and cooling sector. Its much more dispersed information. And its more challenging to really assess the installed capacities, as well as the heat and the production, the energy production of these sectors.
However, energy use for heat accounts for about half of the total world final energy consumption, as you probably all know. And the renewable energy share represents around 8%. When you see basically the slide here, I mentioned that 20 countries or 21 countries with heating and cooling policies, we really see that many countries could and should engage in setting up these frameworks.
In the transfer sector, the situation is a little more positive when we look at the policy sector, policy frameworks. However, renewable energy accounted for an estimated 4% of global energy demand for road transport in 2013, which is up from 2% in 2007. But, again, space for improvement, too.
What we clearly also see is the development, the very dynamic developments in the power sector, have an influence on development in the heating and cooling and the transport sector. We see that there is cost pressure on heating and cooling technologies, that there is, to a certain extent, an electrification trend which is taking place. And it is certainly important that the solar thermal sector, for instance, also really underline the importance for also having thermal solutions in these sectors. Because it's really key to reach 100% renewable energy.
I will very quickly, without going too much into detail, go through some developments in the different technologies. I will not cover all of these. Please visit our website, the Global Stats Report Website to see more.
So solar PV is clearly a leader in the renewable energy technologies in 2015, with capacity added of 50 gigawatt reaching at 220 gigawatt of installed capacities. What is really important, and you see it at the curve, basically, it's very dynamic. And annual PV market in 2015 was nearly 10 times the world cumulative solar PV capacity of a decade earlier. So this is, really, very significant.
In the wind power sector, 63 gigawatts of capacity has been added, reaching 433 gigawatts. In some countries, we also see that there is a trend in the offshore wind, with an estimated 3.4 gigawatt of grid connected-- of off-grid wind added in 2015.
What is interesting here is, there is always this discussion of integration of variable and renewables into the grids. And there are these countries, like Denmark and Germany, Portugal, Uruguay, reaching really high shares of wind power in their grid, up to 70%. And this is just-- yeah. Success stories, which also need to be out there. It is possible to have such a transition.
Looking at concentrating solar thermal power, there was a total capacity of 4.8 gigawatts in 2015, with 0.4 gigawatts added, which is an increase of 10%. What we see here, however-- and this is, to a certain extent, also linked to the developments in PV and wind is that the rate, the increase, is going down somewhat compared to a couple of years earlier.
And the other aspect we see is that markets continue to shift to developing countries, too. So I will not go into solar, thermal, heating, and cooling because you will have a great presentation of Werner and Barbel, with whom we're also collaborating, basically, on the solar panel section. So Barbel Epp is the author of that section. And IA INTAC, under the IA Solar Heating and Cooling program is providing a lot of data because they really have that continuous historic data on solar capacities, et cetera, in their report.
So we're collaborating here. However, just to tell you, solar power, heating, and cooling has a space in the global status report. And our message clearly is also not to only look at the power sector, but also in these sectors.
All these developments obviously also are reflected in the development of global investment in renewable energy, which was of $286 billion US dollar in 2015, which is a new record high. It's an increase of 5% compared to 2014. And when we include hydropower, then large hydropower, it even reaches $328.9 billion US dollars.
What is interesting-- and you'll have it when you look at the yellow bar-- this is developed countries. The grayest bars are China, India, and Brazil. And the other developing countries up here. And for the first time, investment in renewable energy in developing countries exceeded investment in developed countries.
And this is-- I mean, this is a big, big method. There are markets out there, there is an interest. Today it's an economic solution. And renewable energy also plays a very important role when we are talking about meeting the Universal Energy Act, so the sustainable development goals and objectives.
When we are looking-- sorry. Just to be more precise in developing in emerging country, the increase was of 19%, compared to 2014. And in developed countries, there was a decrease of 8%. So another aspect underlining the shift.
When we are looking now into the different renewable energy sectors, we see that solar power was going up significantly, plus 12%. This is a change relative to 2014. Wind was plus 4%. All the other renewable energy technologies went down. So solar power was the leader in receiving 56%, actually, of total new investment in renewables.
Especially, when we are also talking to policymakers jobs in renewable energy is obviously another argument to also go in these sectors. And we we're interested in this. The global employment in renewables increased by 5% in 2015 and reached an estimated 8.1 million direct and indirect jobs in the renewable energy industry.
The leading employers were China, Brazil, the US, and India. And when it comes to technologies, we see the solar energy sector, but also the bioenergy sector as leaders.
We have this feature on community renewable energy. And you see that we-- so, first, community renewable energy is really a big, big trend over the last years. We see that the initiatives are increasing a lot, in particular in Europe. But it's also a trend which takes place in other regions. I mean, there is a lot of community energy ongoing in Africa, in Asia, in the US, and Latin America.
So in Europe, there is more than 2,800 energy cooperatives. In Germany, 772. And I think if I recall correctly, it's up from 200, 5 years ago. The Netherlands, 500. And this is also something which is pushed a lot by the 100% Renewable Energy Movement, but also the Energy Autonomy discussion, where you can also find the whole discussion of having energy storage in the houses, et cetera.
What is interesting is, very often, we talk about power here, but we see that there is lots of things ongoing on district heating, too. And good examples, for instance, coming from Denmark on having community renewable heat.
So very quickly in mentioning, I said that we have a section on energy efficiency. We see here, when we are looking at the policy map, that there is an increased emphasis on activities to improve energy efficiency in all sectors. And there is also policy support. There are 146 countries with policies, and 128 countries with targets. So I invite you to go to the section to read more about it. Clearly, energy efficiency needs to be built into a more integrated approach.
So all these developments led to a share of renewable energy in the global final energy consumption of 19.2%. This is 2014 data. And what we also see is that the share of modern renewable increased to 10.3%. So this is really relevant for the use of traditional biomass in developing countries, mainly.
So I'm coming to my closing slides. So what are the conclusions? Renewable energy, the largest global capacity additions come from renewables to date. This is really a great message. It's a great method, but more is possible, I think. For the second year in the row-- and this is obviously very important-- global carbon emissions associated with energy consumption remain stable, while the global economy grew. So we really have a decoupling of growth and carbon emissions, which is linked to renewable energy and energy efficiency deployments.
A big message is, the majority of the fossil fuel reserves need to be kept in the ground in order to reach the two-degree Celsius climate target. And this is really important. It's in particular important when we think about the fact that for every dollar of subsidies to renewables, $4 are spent. So it's really a considerable method.
And very clearly, more emphasis needs to take place on renewable energy in heating and cooling, as well as transport sectors. And also on sector coupling. We really see the need for an integrated approach at the local level, at the national level, at the regional level.
We need to build smarter and more flexible systems to also accommodate both centralized, as well as decentralized generation. This is really true for countries which already have very good grid infrastructures, for instance. In the developing countries, we really have a great opportunity to develop infrastructures, which already accommodate for integrating renewable energies.
And so here we have some other activities. You can go on our website. And if you would like to be involved in the Global Status Report 2017, just click on that link and be in touch with us. Thank you very much.
NIGEL COTTON: Thank you, Rana. So I noticed we have a couple of questions that we can probably just take now. One is from Jonathan K saying, why is your opinion-- in your opinion, governments focusing on electrical power so heavily, when 70%, 80% of all energy needs are HVAC, which can be replaced by thermal? Question mark. I don't know if you have a comment on--
RANA ADIB: To be honest, I think there are different reasons for it. One is certainly that lots of the power sectors, I guess, renewable power sectors are more centralized, and more streamlined technologies, too. When we're looking at the heating and cooling sector, when you're talking about buyer entities, solar therma, et cetera, it's very often more decentralized solutions which take place at the local level more, where you also have local players in the market.
And there is a bigger need, I guess, to coordinate, consolidate data, for instance, so we have bigger challenges in these sectors to have good consolidated data information. This also means that there is another power, I guess, to lobby for better policy and regulated frameworks. This is certainly one aspect.
And this also calls for, I guess, inter-ministerial collaboration. So let's take the example, when you're looking at the local level building, it just means that you have different sectors that need to work together, develop the same languages. It's cross-sectoral approaches which are needed. And this is often more complicated. And so I think that this is really contributing a lot to the fact that there is a focus on the power sector.
The other part is, really, that the cost went down so significantly during the last couple of years, so that basically there is a cost pressure, too, on the heating and cooling sectors.
NIGEL COTTON: OK. So for purposes of time, we need to swap to the next speaker, which is Werner Weiss. I'll just put his slides through.
WERNER WEISS: OK. Thank you very much, Nigel, for your introduction. I'm going to present a study AEE, INTEC. annually for the IA Solar Heating and Cooling program. And the co-authors of this study are Franz Mauthner and Monika Spork-Dur.
So, basically, what I presents are the results of the 2016 edition. Of course, the full story can be downloaded from the AEE's Solar Heating and Cooling website. They get significantly more information and data than I can present now.
We're starting with an overview and comparison with other renewable energy technologies. it brings me back a little bit to the first question we had, why is the policy mainly focusing on the power sector? If you have electricity or if you have energy discussions, usually the energy discussions are mainly electricity discussions. And therefore, they simply forget that about 50% of the final energy demand world-wide is heat.
And it's also represented here. If you look on the total installed capacity, by the end of 2015, then we have 435 gigawatt installed capacity on solar thermal. Photovoltaic represents 227 gigawatt install capacity. And solar thermal power, concentrating solar power is 5 gigawatt installed capacity. On the [INAUDIBLE] there it is completely vise versa. So people are just focusing on photovoltaic and believing its much more installed than solar thermal.
This is comparing the figures, which were given by Rana before. She mentioned, if I recall it right, picowatt new installed capacity in 2015, and so in thermal in 2014, it was 46 gigawatt new installed capacity. So its in the same range. But it was really underestimated and simply not seen.
Focusing on the total installed capacity in the operations, so its accumulated installed capacity worldwide by the end of 2014, it's what you see on the screen. You can see that the really dominating market is China, representing 70% of the total world market. About 11.6% is in Europe, and the rest of the world is less than 18%. Something of 4.4% in North America, 2.6% in Asia without China, 2.4% in Latin America, and so forth. So really dominated by China.
And if we look a little bit back in history, just to 2012, it changes. Then you can see in 2012 it was 67% in China and it was nearly 16% in Europe so that means China is really taking more and more of the share of solar thermal install capacity.
If we look to the total installed capacity of unglazed and glazed water collectors in operation. So the 10 leading countries by the end of 2014. China is leading, it has an install capacity of 289 collectors. And the different markets you would have in these different countries. So China has clearly dominated by evacuated tube collectors, even if you can't see it clearly on this slide. On the top of the flat plate collectors, it goes really up to the second floor, if you have one here.
The US market is dominated the unglazed plastic collectors mainly because we import heating. So these are the blue parts of what you can see here in the US. And the small part of flat plate collectors. Germany, mainly flat plate collectors, about 10% evacuated tube collectors. And then, you have in Turkey, again, the same way like in Germany, Brazil, and so forth. So they are mixed flat plate and evacuated tube collectors.
But this shows also different applications, especially in the US. But the main market is on pool heating. And it's also a significant share in Brazil and in Australia.
If you look to the top 10 related to the per 1,000 inhabitants, which shows you more on the market penetration, you can see-- Rana mentioned it already-- Austria is leading here ahead of Cyprus, Israel, Barbados, Greece, the Palestinian territories, Australia and China. In terms of installed capacity per 1,000 inhabitants, it's number eight. So in absolute terms, it's leading. In terms of installed capacity per inhabitant, it's number eight worldwide.
What I should mention here maybe in this slide is, this these top 10 countries are not leading because they're all coming from a region where it unavaliable most of these countries have a long term support scheme. European countries, like Australia, their subsidy scheme in place for quite a long time. Israel was one of the countries who had already introduced already in 1980 a obligation. And so for us, I don't want to go into detail here. But many of these countries are top 10 because they have long term policy in place what I might mention here, this year, Turkey overtook Germany in the top 10 from number 10 to number 9.
Distribution of the total installed capacity by collector type. So China is leading on the worldwide scale flat plate tube collectors more than 70% on the worldwide scale. And just 22% of flat plate collectors. If you focus on Europe, you have the opposite picture. Flat plate collectors are dominating with nearly 84%, and the vacated tube collectors, it's about 11% of the market in Europe. So this really, really different worldwide or if you focus on Europe.
Distribution by collector type in different economic regions. If you start on the left hand side, as I mentioned already, in the US and Canada, the unglazed pool collector is dominating. If you look on Australia and New Zealand, still nearly 60% is pool heating, about 40% of flat plate collectors. Sub-Saharan Africa, its 53% is unglazed water collector. 37% is flat plate collector, 10% evacuated tubes.
If you look on Europe, it's dominated by 85% of flat plate collectors and about 11% of evacuated tubes. On the worldwide scale, of course, due to the dominance of China, again, 71% is evacuated tube collectors.
The distribution by type of system. Again, I want to start at the worldwide scale it's 78% of the installed capacity on thermosyphon systems, so non-pump systems and pump systems on the worldwide scale is just 22%. If you look to North America, if you look to Europe, then you have a different picture. In Europe, you have 61% pump system and 39% are thermosyphon systems.
And here, I have to mention that in Europe, the countries and also Turkey, with geographical point of view to Europe. Therefore, it's nearly 40% of thermosyphon systems, and here 61% are pump systems. In the US, Canada, and North America it's 97% of the systems are pumped system. So we have completely different markets in different regions worldwide.
Distribution by application. I don't want to go too much in detail here, but we get more and more different pictures. So different implications. On the worldwide scale, it's still 63% is domestic hot water systems for single family houses. Then you have this red part, with 28%, it's large scale domestic hot water systems for multiple family houses, but also for the tourism sector and public sector hotels, hospitals. So medium scale systems.
Then you have other. It's this small yellow part. But this is significantly growing. Solar district heating and solar process heat. And 6% is on swimming pool heating. And then, of course, it's different in the different regions worldwide, which you can see here on these slides.
The bad news is now-- it was mentioned already also by Rana-- compared to the year 2013, the new collector install worldwide decreased by 15%. And this is really-- this indicates a trend change. Up to now, we've only said growing markets. And in 2014, this was the first time we have a decreased worldwide market.
And this also seems to be a trend. The data we know already from 2015-- and this is in the main markets worldwide. This trend seems to continue, unfortunately.
So this is just showing the market growth from 2000. So we had between 4% was the highest market growth in 2008. 2013 was 2%. And this year-- sorry for this. It's minus 15% in 2014.
In detail, the market growth compared to 2013, you can see we had growth rates of 8% in Latin America. We had growth rates in Asia without China. We had significantly drops in the market in Australia, and especially minus 18% in China. This was a major drop, taking into account that they are dominating the world market, which results in a worldwide decrease of minus 15%.
Focusing now on just the installed capacity in 2014, so it's a capacity which was installed in this year. Again, in total terms, China was leading with 36 gigawatt installed capacity, followed by Turkey, Brazil, India, the US, and so forth. So, again, dominance of China. And I mentioned already, here was a change in Germany fell back. And the newcomers in the top 10 is Mexico and Greece in 2014. And if I compare it to the year 2010, just looking just four years back, then we have already a significant change.
It means in 2010 we have four European countries under the top 10. And if we look to 2014, there's just Germany left on the top 10 from Europe. So it's a clear trend going to new markets who are dominating the world market. It's not any more major, the industrialized countries. So other countries are coming in and investing heavily in this technology.
Again, installed. 2014 by 1,000 inhabitants. You see a different picture. Of course, again, then you have Israel is still number one. China is in second place, followed by the Palestinian territories. Denmark. So it's the large scale systems, district heating, they are now number 4. Followed by Australia, Greece, Turkey, Austria, Cyprus. And new under the top 10 is Switzerland in terms of installed capacity by 1,000 inhabitants.
There's been a very positive development in large scale district heating and cooling applications in Europe, but also in other parts of the world. But this slide basically shows the development in Europe on large scale systems. In total, how large scale district heating systems, we have installed about 1.1 million square meters. And there's a very positive trend, as I mentioned already. It's been about 20 new systems installed per year.
If you look where they are installed, they are mainly installed in Denmark. In Denmark, there are nearly 79 systems installed to the total capacity of 577 megawatt. And if you compare it to Germany, Austria, or Sweden-- so number two, three, and four-- you can see that the average size of the system in Denmark is significantly higher. In Denmark, the average size per system is about seven megawatt, which relates to about 10,000 square meter per system.
And in Germany, Austria, and Sweden, the average size of this district heating, solar-assisted district heating systems, within the range of one megawatt per 1,500 square meters. So there's a significant difference between Denmark and the rest of Europe, if you want.
Just to give you one picture. One of the biggest systems at the moment is Vojens this district heating plant in Denmark. In the meantime, it's even bigger. It's about 70,000 square meters. And in the middle of the picture, on the left hand side, you'll see that huge seasonal storage is 203,000 cubic meter of seasonal heat storage.
There is a big discussion in Austria at the moment to install in the next three years a very big system with about 450,000 square meters and a 1.8 million cubic meter peak storage. But this is under discussion, but it looks quite optimistic that this system will be built in the next years. So a very positive trend in large scale district heating systems.
Looking on solar cooling systems, here, we've we lost a little bit. The dynamic is still going up, but still in low scale. The total installed number of systems is in the range of 1,200 worldwide, and about 900 of these systems are installed in Europe.
The global processing applications, it's also a growing market, a large scale market. The total installed capacity, we have documented-- I have to mention these other results of the IA Solar Heating and Cooling Task 49 SHIP Databank worldwide database on solar heating for industrial process application. This is what is shown here.
So in total, it's about 200,000 square meters installed. So significantly smaller than industry heating. And if we start on the left hand side, you'll see the large scale systems bigger than 4.7 megawatt or bigger than 1,000 square meters. Then we have 21 systems installed with a total of 75 megawatts, or about 110,000 square meters. Then you have systems in the range between 500 and 1,000 square meters.
We have 35 systems installed with a total capacity of 16 megawatt and small scale industrial processes applications between 100 and 500 square meters. The biggest number is 86 systems, representing 14 megawatt. And, again, in the range of 20,000 square meters.
Most of these systems either go in the food and beverage industry. So a lot was done, for instance, in the beer brewing, in the brewing industry. But also in the galvanic industry. And the picture you see here is of the biggest system at the moment in industrial processing. It's a copper mine in Chile.
The total installed capacity of 39,000 square meters representing 26 megawatt in the Atacama desert. And the heat is used here for processed heat, so for the rose seed copper winning process of the copper mine.
Very quickly the number of jobs. So in total, worldwide, we have something like 730,000 jobs worldwide in solar and thermal. The turnover worldwide is estimated at about $21 billion euro or $24 billion US dollar. So it's really significant turnover done by the solar thermal industry.
Finally, what we published first time in our study, solar thermal system cost and levelised cost of heat or solar-generated heat, because this was always a big discussion, are going to present now-- we focused on four types of systems. The wandering of the levelised cost of thermosyphon systems, pump systems, or small scale systems so for domestic hot water systems for single family houses, then pump systems for multiple family houses or for large systems. And, finally, complex systems for hot water and space heating. These are the next four slides.
What you can see here on the slide on the bottom, you see the different system or several systems we compared from Australia, Brazil, China, India, Israel, South Africa, and Turkey. And the left y-axis, you see the specific system cost in Euro per square meter of cross collector area. So this includes the total system cost, including installation. This is shown here on the left y-axis. And on the right y-axis, you see the localized cost of heat in euros and per kilowatt hour.
What you can see here-- these diamonds-- they show you the levelised cost of heat from thermosyphon systems. For domestic hot water systems in Turkey, they have the lowest levelised costs. So for a four-square meter system with a 170 liter storage tank. And even if they were just tourists lifetime of 10 years, they reached levelised cost of heat in the range of 3 euro cent per kilowatt hour.
You go to South Africa, a similar system. So the levelised cost of heat are significantly higher, in the range of more than 8 euro cent per kilowatt hour. This is, of course, due to the fact that the system cost is significantly higher in South Africa than compared to Turkey.
If you go to Australia, they have significantly higher cost system. Higher system lifetimes for thermosyphon system. So we'll be taking to consideration here, also the knowledge we have of the average system lifetime. And this is, of course, a significant role in that end of levelised cost of heat.
Jumping now to the specific investment cost and levelised cost of solar heat for small pump systems, so these systems are in the range of four to six square meter collector area in combination with a 200 to 300 liter storage tank. And, again, we compare here a range of different systems per country. And the cost of levelised-- the specific cost euro per square meter, and the range between 250 euro per square meter and can go up, like in China here, to 600. And in the worst case, we are like in France, we are in the range of nearly 1,400 euro per square meter.
Concerning levelised cost of heat, you can see this system in China. We have something like 8 euro cent per kilowatt hour. And we can reach the same with the Australians system. It's also in the range of 8 euro cent per kilowatt hour. And the most expensive systems in France, with the average specific cost of the system of 1,400 euro per square meter ends up, of course, at nearly 20 euro cent per kilowatt hour.
But nevertheless, even the French system is still in the range of electricity cost if you would repair hot water with electricity. It's in the same range like the electricity. All other countries are significantly below and can compete with gas and, of course, with electricity in all cases.
Now, for large pump systems, more or less the same situation. Depending on the climatic conditions, of course. The cost of the system, the lifetime of the system in the range, between three euro cent per kilowatt hour. And in France, we are in the range of 14 euro cent per kilowatt hour. This shows you, again, brings me back to the question of before, why is the policy focusing mainly on electricity? Is it significantly simpler to work with levelised cost of electricity? Because this is mainly usually the same range worldwide, whereas heat is very-- especially coming from solar thermal, it's significantly depending on the implication.
But nevertheless, in summary, and in the Sun Belt of the rotary, the high solar radiation, behind the range between 3 and 8 euro cent per kilowatt hour. And in central and northern Europe, we're in the range between 8 and 15 euro cent per kilowatt hour. And the combi systems, it's obviously in this range depending on the country. The cheaper systems are in Brazil.
And with this, I want to thank you for your attention. If you want to know a little bit more about this study, just download it from the IA Solar Heating and Cooling Website. Thank you for your attention.
NIGEL COTTON: Thank you, Werner. Excellent presentation I have a couple of questions for clarification. One is from Jonathan Kay. What variables are included in the highest cost of heat?
WERNER WEISS: The variables are-- on the one hand it's-- so we have a definition. So that you can see it, I'll just go back one slide. On the one hand, we have this-- the system is defined. So we have some reference systems. We have the service lifetime. It is variable, it's the climatic condition, and it's the cost. And, of course, it's the financing cost, so the interest rate. But you'll find all the variables in detail in the study. You'll find all the variables for each of the countries.
NIGEL COTTON: OK. Great. And the other one was did your presentation include the project Glass Point in Oman?
WERNER WEISS: No. It's not including concentrating systems. The Glass Point system is a parabolic trough collector. So we're thinking about to include the heat implications from concentrating systems, so for an evacuated parabolic trough or funnel in the next edition next year. But this is not included up to now.
NIGEL COTTON: OK. Great. There's just one clarification point here. You're using the indicator per 1,000 inhabitants. What is that actually telling the audience because certain countries will have quite a heavy heat load and others maybe not?
WERNER WEISS: Yeah. But in general, if you show the installed capacity per 1,000 inhabitants, it shows-- it gives you an indicator on the market penetration. So what is installed per capita. This is the main reason why we show it, because otherwise, maybe it's also the background-- I'm coming from Austria. We are representing eight million. And if you compare it to China, which is 1.4 billion people, of course they always install more, even if they have a significantly lower market penetration.
And, of course, it's not focusing on the different heat loads. If you keep in mind that most of the installations of solar heat at the moment, for all the preparation, this makes not a significant difference between the demand in a hot climate or a cold climate. So it's not a significant difference. But it's mainly showing the market penetration, when we show it per capita.
NIGEL COTTON: Excellent. Thank you very much for that. It's now time to move on to our next speaker, so I will change the slides. And that is Barbel Epp, from the solar thermal world.org
I need to unmute Barbel. Excellent. Barbel, please continue.
Barbel EPP: Yes. Good afternoon, everybody. I go back to my starting point. Excellent. Good afternoon. Thank you, Nigel, for the nice introduction. My topic today is solar heating and cooling trends in policy and industry.
One of the key issues of the GSR 2015 is describing the market development most currently, that means year 2015, on global and national level. Generally speaking, the markets were under pressure in 2015. And this is the key chart showing the market development 2015 in newly added capacities. In total, these 18 countries declined by 14%, which is the same trend like Rana already explained for 2014.
I want to give some reasons. China is down by 17% again, so it's a big collapse. And this is due to the overheated construction market. The real estate market dropped in China from double-digit annual growth rates at the beginning of 2014 to stagnation in December 2015. So a steep decline. The second reason is that the focus of the government towards renewable electricity sort of puts-- there's not much room for solar heating support measures at the moment.
European markets are also in general down. They were hit by the low oil and gas prices. Additional challenges we're seeing in Spain, Italy, France because of bureaucratic processes associated with the national subsidies issues. We have generally low construction activities in several countries. And an increasing competition from other renewable heating technologies in the residential sector, mainly.
Brazil also not performing too well in 2015, whereas it was a booming market before, which is due to the national economic crisis in the country. And also the delay in the social housing program, which was a big driver in the past because of a lot of apartments are equipped with solar water heaters.
India's industry stagnated in 2015 also, after several years of growth, which is still a consolidation faith after the government stopped the incentives in August 2014, sorry. Government and industry are currently discussing new support strategies. And there's one interesting instrument to be discussed, which is [audio on video cuts out] because they have a very renewable purchase application in the electricity sector. So there is a draft of a law at the ministry and it's discussed currently.
Despite these negative trends in some countries, there were extremely well performing countries. We heard of Denmark 55% up, again, in 2015 due to the high demand of large scale solar district heating. Israel climbed up again 9%, which was actually cost by a strong hailstorm in 2015. Israel is a strong replacement market. And the hailstorm ruined so many glasses that there was a large replacement extra load in 2015. Turkey also up by 10%. At industry profits by its strong supply chain, 800 sales points points and around 3,000 specialized installers do a good job in promoting solar.
While we heard from Rana that adaption of solar heating and cooling policies is much slower than electricity fields, you've seen this chart. 21 countries worldwide had solar applications in place. None was followed up, and none was ended in 2015. So this is bad news.
This table shows you roughly the number of countries which had policy in place for solar heating and cooling, middle column and renewable electricity, the right column. And you see the big difference that much fewer number of countries have policies in place.
And this is in all categories, whether it's support policy, as well as targets. And these new ENDC targets, which were all submitted during Paris time. We could only identify three countries which have explicit solar heating and cooling targets in the submitted papers.
I would like to mention that these 45 countries are-- with all their precise solar heating and cooling targets are mentioned in the big table, in the solar status report on page 181.
Also, Rana already talked about the big role of municipalities, which is also profiting solar heating and cooling. She was mentioning the 100% campaign, which is followed by more and more countries and cities worldwide.
I would like to mention Amsterdam, which had a far reaching new objective in 2015. They committed themselves to decarbonize its district heating system and set an immediate goal for increasing connections to a total of 230,000 homes within the city by 2040.
Graz was already mentioned by Rana. A huge system of 350 megawatt solar district heating, where the local utility wants to sign a contract with an energy service company soon.
One very important trend we mentioned in the global status report this year is the transition from single family houses to commercial sector. This is evidence from the market figures that have analysts gather every year. You see here, the column on the left shows you the share of applications worldwide within the total installed water capacity, and on the right hand side within the newly installed added capacity, 2014. And you see that the residential sector, which was dominating solar with 64%, is reducing a lot if it comes to added power. And we have a very big shift towards multi-family houses, tourism, and public sector.
Some examples, China is probably the strongest country moving into this direction. If you believe the statistics we received from SunVision, they have already 61% of the newly added collector area in 2015 in this commercial sector multi-family houses, tourism, and public. This mood corresponds with 26 million square meters.
Poland is also a country where this shift is fairly evident. They have strong drivers in large projects in public buildings, hospitals, financed by international funds, and their residential sector is declining a lot because their national subsidy scheme is favoring a lot solar PV at the moment.
Linked to this trend towards commercial is this trend, which says Turnkey system suppliers develop new business models. Why is that? Commercial clients obviously are challenging. They do not want to invest money in activities that are not their core business. And they are not very keen in taking over high financial risk or even operating in maintenance responsibility.
So what happened? The heating and cooling companies more and more become offering energy performance contracting. So they become energy providers and they finance, install, operate, and maintain solar heating and cooling systems.
We have researched a lot in this domain on solarthermalworld.org. In this table, results of many stories that we did. These are all companies which offer solar contracts already, solar heat contracts already. You see they are not really covering only Europe, but they are worldwide. You have them in Chile, in Austria, India, Spain, France. So it's fairly mixed. And it's a growing number of companies, actually.
The links in this chart are linked to publications on solar panel growth. We have also a number of start ups which we're not really able to quantify yet in terms of installations, but which all announced to also get into this direction of ESCO. They are, again, in very different countries. We have even companies in Armenia, and, again, United States.
I think we have sort of trends towards closing this gap in offering professional turnkey financed systems to the industry to commercial clients. But what is the big step now is the financing. That means, while having funds, bankers, investment funds, which are specialized about this technology, which are open to finance it, to guarantee solar yields, and to facilitate this new emerging industry. This is really a big gap we are seeing there. And it needs big efforts to close that.
There is a new era of investment in solar process heat. Generally, solar process heat is, for the moment, only a fraction of the residential sector. Whereas the long term potential is seen as large as residential. So these are figures from the technology roadmap stressing that 8.9 exajules could be covered by solar by 2050 in the residential sector and 7.2 in the industrial segment. So they are almost equal, but process heat is very much behind.
So we have this 188 process heat identified project within the database ship-plants.info. And the reasons are manifold. You have the cheap oil and gas prices, you have still high system costs, often absence of guidelines, lack of business models, and lack of knowledge among potential customers.
But even so, you have an amazing situation that in some niche markets, as Rana already said, there is a high demand because solar can compete against gas and oil prices in this segment. This is mostly applications far away from gas grids, where fossils have to be transported to.
And somebody already asked for this Glass Point project. It's this one. It's a Gigawatt investment, which is a pure commercial project without subsidies by the Petroleum Development Oman. They ordered a $600 million US dollar investment, which will become a one 1 gigawatt steam producing plant in 2017. And the technology is seen here. It's parabolic collectors. Parabolic trap connectors. Light ones from aluminum. And they are put in glass houses to defend them against the sand and storms.
And this will cover this 1 gigawatt, which will be the biggest ever done on steam and even CSP, which is a British company called Glass Point to do the installation.
There is one other trend which is [video audio cuts out].
NIGEL COTTON: --one was aimed at Werner. Let me just unmute now. Are there key sectors for the industrial process heating identified in your study? And if so, which ones and why?
WERNER WEISS: The key sectors are the food and beverage industry because usually, of course, the industry is looking on very short pay big times. And you have to look on industries which are most probably not moving in a short time. So it's one of the reasons why a lot of breweries, for instance, installed solar thermal systems because they stay where they are. People will drink beer in the region in the next 100 years.
If you go-- there's another big potential in the textile industry. The textile industry is much more risky, so you never know if textile industry from Europe, for instance, disappears within the next two years to Asia. The main focus where you see the biggest potential is in the food and beverage industry.
But also, as you could see, in the mining sector, where you need a lot of low temperature heat, like in the copper mining industry, where the temperature range is in the range between 50 and 60 degrees centigrade. Which is, excellent, of course for solar thermal applications
on the other hand, we have now just started a new project. It's a cooperation between Germany and Austria with the car manufacturing industry. There is also a big financial theme. Also in the galvanic industry. So everywhere where you have low temperature heat demand, so that means up to 100 degrees. But if you go to concentrating systems, up to 250 degrees.
NIGEL COTTON: Thank you for that. We had a quick question from Nicholas to Rana. The 12% ...
OK. We've come to the end of our allotted time. And we've experience some technical difficulties, which I apologize profusely. And so I will take the opportunity to close the webinar. Thank you for attending today's webinar-seminar. We will, within 48 hours, have this presentation available on our web site solarthermalworld.org.
And on behalf of the guest speakers, Rana, Barbel, Werner, and myself, I would like to thank you for attending. I am Nigel Cotton. I hope this has been helpful. Thank you for your time, and have a great day.
RANA ADIB: Thank you very much.
12.4. Assignment
12.4. AssignmentThis assignment is linked directly to your course project, which you are working on right now. Markets for solar thermal systems are very diverse, and current trends differ at different locations. In this lesson we reviewed some energy agency reports that list promising applications and analyze how the industry will develop in the near future. Now you need to narrow this information down to your locality.
The Assignment
Prepare a Market Overview section for your Course Project Propsal. Include both global and local data, and discuss how the observed trends may affect the success of your project. The recommended length of the market review is <2 pages. The following sub-sections may be included:
- Brief history and current status of the STE industry and applications in your area and how it is related to the global and country-side trends
- Future promising areas of STE applications taking into account local businesses, policy, or politics
- Stake holders that will play role in project, competitors, and other players
- How your project fits in the targeted market situation
Deliverable
Please submit 2-page Market Overview document as a single PDF or MS Word file to the Lesson 12 Dropbox in Canvas by 11:55PM on Wednesday (Please see Canvas calendar for exact due dates). Please make sure to provide proper references to the market data you use. Graphical representation of data is beneficial, and original graphics and tables are preferred. If you use borrowed graphics, please provide proper credits.
This section can be further included in your final course proposal as is, but it will be graded separately in this lesson.
12.5 Summary and Final Tasks
12.5 Summary and Final TasksSummary
Markets for solar heat applications are very diverse, and experts predict significant promise for thermal systems in various areas of industry, utility, and residential energy sectors. Society and industry use a lot of heat, both low and high temperatures. As such, there is a lot of room for converting conventional heat systems over the NEW (yet surprisingly old and timeless) convention of solar thermal systems in hopes of increasing energy independence and overall sustainability of our society.
Reminder - Complete all of the Lesson 12 tasks!
You have reached the end of Lesson 12, which concludes the course content! Double-check the to-do list on the Lesson 12 Introduction page to make sure you have completed all of the activities listed there.
The remaining time of the semester will be spent on completing your course project proposal. Good luck!