Welcome to Alternative Fuels from Biomass Sources!
Welcome to Alternative Fuels from Biomass Sources!Course Overview
This course will examine the chemistry of technologies of bio-based sources for power generation and transportation fuels.
When you successfully complete this course, you will be prepared to:
- describe various biomasses that can be utilized for energy and fuel generation;
- explain the composition of various processes necessary for biomass processing;
- utilize the necessary chemistry, as well as mass and energy balances, that would be utilized in a biorefining facility;
- analyze how to utilize biofuels in current fuel infrastructure;
- illustrate what is required in a biorefinery.
Instructor Information

Dr. Hilal Ezgi Toraman leads an interdisciplinary research program at Penn State focused on sustainable reaction engineering and catalysis for the valorization of non-traditional carbon feedstocks. Her group integrates advanced pyrolysis experimentation, GC×GC-based analytics, and kinetic modeling to develop and optimize scalable chemical recycling technologies. She leads multi-institutional projects on mixed polymer pyrolysis and catalytic upgrading, where her group contributes intrinsic kinetic studies, GC×GC method development, and data management and analysis infrastructure to support process design and evaluation.
Toraman has secured over $5 million in research funding as a PI, published widely in high-impact journals, and received both national and international recognition, including the C&EN Talented 12, AIChE CRE Pioneers in Catalysis and Reaction Engineering, and ACS Energy & Fuels Rising Star awards. She has held leadership roles as Director of AIChE's Catalysis and Reaction Engineering Division and currently serves as president of the Pittsburgh-Cleveland Catalysis Society. Her honors include the Virginia S. and Philip L. Walker Jr. Faculty Fellowship and the Wilson Fellowship.
Before joining the Penn State faculty, Toraman was a postdoctoral researcher with the Department of Chemical and Biomolecular Engineering and Delaware Energy Institute at the University of Delaware. She received her B.S. and M.S. degrees in Chemical Engineering from Middle East Technical University, Türkiye (Turkey), and her Ph.D. degree in Chemical Engineering from Ghent University, Belgium.
Teaching Assistant

Praneetha Buddha
PhD Candidate
Department of Energy and Mineral Engineering
Pennsylvania State University, University Park, PA
Email: pjb5926@psu.edu
- Email: Please use the Canvas course email system to reach the assistant and me.
- Phone: 814-863-9261 (Office). The phone should be your last option. The best way to reach me is by email.
- Office Hours: Office hours are by appointment on Wednesdays, between 1:00 PM and 2:00 PM (Ms. Buddha and Dr. Toraman), on Mondays, between 11:00 AM and 12:00 PM, and on Thursdays, between 2:00 PM and 3:00 PM (Ms. Buddha). Please contact us before Sunday at 11:59 pm to schedule for the following Wednesday. I can be reached at hzt5148@psu.edu, and the Teaching Assistant, Praneetha Buddha, can be reached at pjb5926@psu.edu. When contacting us to schedule, please provide the question(s) that you plan to ask during the office hours.
- Syllabus: All students sign and return the Syllabus Acknowledgement Form to the Teaching Assistant via email, during the first week of the semester.
This course is offered as part of the Repository of Open and Affordable Materials at Penn State. You are welcome to use and reuse materials that appear on this site (other than those copyrighted by others) subject to the licensing agreement linked to the bottom of this and every page.
Want to join us? Students who register for this Penn State course gain access to assignments and instructor feedback and earn academic credit. Official course descriptions and curricular details can be reviewed in the University Bulletin.
Lesson 1: Why Alternative Fuels from Biomass?
Lesson 1: Why Alternative Fuels from Biomass?Overview
Not everyone likes the idea of using biomass for energy. From an industrial perspective, it competes with the coal and petroleum industries. There is a great deal of skepticism regarding the production of ethanol or bio-oil and how much energy is used to make them. Many people don't understand its value or how it can be incorporated into the current energy portfolio. This lesson will explain why using biomass as an energy source is smart and can alleviate the increasing energy demand. You will also read some excerpts from books that take a particular slant on bioenergy use. And you'll also see that some sources have a hidden agenda that may not be the best strategy for incorporating biofuels.
Lesson Objectives
By the end of this lesson, you should be able to:
- explain why biofuels are a necessary part of our energy portfolio.
Lesson 1 Road Map
This lesson will take us one week to complete. Please refer to the Course Syllabus for specific time frames and assignment due dates.
Questions?
If there is anything in the lesson materials that you would like to comment on or don't quite understand, please post your thoughts and/or questions to our Throughout the Course Questions and Comments discussion forum. The discussion forum will be checked regularly. While you are there, feel free to post responses to your classmates if you can help. Regular office hours will be held to provide help for EGEE 439 students.
1.1 Why Biofuels?
1.1 Why Biofuels?Part of the purpose of the course is to help you to understand why biofuels are needed and how to make them, at the current state-of-the-art.
Why biofuels? To look at the situation a little more broadly, the question then becomes: why alternative fuels?
As climate change becomes an issue of ever-stronger concern in the world, stronger efforts are being devoted to tackling this issue. The International Energy Agency (IEA) has recently proposed the 2°C scenario (2DS) as a way to handle the climate change issue. The 2DS has become a largely used quote by many policymakers and scientists. The 2DS scenario requires that carbon dioxide (CO2) emissions in 2060 should be reduced by 70% in comparison to the 2014 level. The transport sector plays an important role to achieve this goal, considering that the transportation sector is responsible for about 23% of total CO2 emissions. Although electricity has been considered a promising option for reducing CO2 emissions in transportation (Yabe, Shinoda, Seki, Tanaka, & Akisawa, 2012), transport biofuel is estimated to be the key alternative energy in the transport sector (Ahlgren, Börjesson Hagberg, & Grahn, 2017). The share of biofuels in total transportation-fuel consumption by 2060 is predicted to be 31%, followed by electricity at 27% based on the mobility model results of IEA for the 2DS. Biofuel production must be increased by a factor of 10 to achieve this goal (Oh, Hwang, Kim, Kim, & Lee, 2018). In addition to the need for climate change adaptation, the increasing concerns over energy security is another main driver for the policy-makers belonging to the Organisation for Economic Co-operation and Development (OECD) to promote the production of renewable energy (Ho, Ngo, & Guo, 2014). Last but not least, world energy demand will continue increasing. The world energy demand was 5.5 x 10²⁰ J in 2010. The studies predict an increase of a factor of 1.6 to reach a value of 8.6 x 10²⁰J in 2040. The bioenergy delivery potential of the world's total land area excluding cropland, infrastructure, wilderness, and denser forests is estimated at 190 x 1018 J yr-1, 35% of the current global energy demand (Guo, Song, & Buhain, 2015).

In short, there are three main reasons to develop biofuels:
- to meet the needs of increasing energy demand;
- to reduce greenhouse gas (GHG) emissions; and
- to improve energy security by reducing dependence on foreign fuel sources because it can be problematic, depending on US domestic fuel production.
We will explore each of these reasons in more depth in the following sections.
References
Ahlgren, E. O., Börjesson Hagberg, M., & Grahn, M. (2017). Transport biofuels in global energy–economy modeling–a review of comprehensive energy systems assessment approaches. Gcb Bioenergy, 9(7), 1168-1180.
Guo, M. X., Song, W. P., & Buhain, J. (2015). Bioenergy and biofuels: History, status, and perspective. Renewable & Sustainable Energy Reviews, 42, 712-725. doi:10.1016/j.rser.2014.10.013
Ho, D. P., Ngo, H. H., & Guo, W. (2014). A mini review on renewable sources for biofuel. Bioresource Technology, 169, 742-749. doi:10.1016/j.biortech.2014.07.022
Oh, Y. K., Hwang, K. R., Kim, C., Kim, J. R., & Lee, J. S. (2018). Recent developments and key barriers to advanced biofuels: A short review. Bioresource Technology, 257, 320-333. doi:10.1016/j.biortech.2018.02.089
Yabe, K., Shinoda, Y., Seki, T., Tanaka, H., & Akisawa, A. (2012). Market penetration speed and effects on CO2 reduction of electric vehicles and plug-in hybrid electric vehicles in Japan. Energy Policy, 45, 529-540.
1.2 Increasing Energy Demand
1.2 Increasing Energy DemandThe energy needs of most advanced economies in the Western world are increasing at a modest level. However, in some developing economies, where the economy is booming, energy demands are increasing dramatically, e.g., in India and several African countries. The figure below shows the latest gross domestic product (GDP) growth rate of the countries of the world in 2025. While advanced economies had a 1.7% annual percent change in real GDP growth, emerging and developing Asia had a 4.5% annual percent change in real GDP growth, with India having a 6.2% annual percent change in real GDP growth. Emerging and developing economies accounted for over 80% of global energy demand growth. According to the IEA's Global Energy Review 2025, global electricity consumption increased by approximately 1,100 terawatt-hours (TWh) in 2024, more than double the annual average increase over the past decade. Currently, global energy consumption is growing at around 1-2% per year. This rate is faster than the average rate over the past decade. If many third-world countries were to dramatically increase their standard of living, there are estimates that worldwide energy consumption would double. But where would that energy come from, particularly since there aren't huge stockpiles of crude oil sitting around? Petroleum cannot supply it all, and neither can natural gas or coal.

World Map of Real GDP Growth
The image is a world map visualization titled "IMF DataMapper", which displays Real GDP growth (Annual percent change) for the year 2024 across various countries. It uses a color-coded legend to represent different ranges of GDP growth rates:
- Dark green: Countries with 6% or more GDP growth.
- Medium green: Countries with 3% to 6% GDP growth.
- Light green: Countries with 0% to 3% GDP growth.
- Yellow: Countries with 0% to -3% GDP growth (i.e., slight economic contraction).
- Orange: Countries with less than -3% GDP growth (i.e., significant economic contraction).
- Grey: Countries with no available data.
6% or more (Dark Green)
These countries are projected to have robust growth:
Several countries in Sub-Saharan Africa
Parts of Southeast Asia and Central Asia
3% – 6% (Medium Green)
These countries are projected to have moderate to high growth:
- Most of North America and South America
- Large parts of Africa
- Eastern Europe
- Most of Asia, including India
0% – 3% (Light Green)
These countries are expected to see modest economic growth:
- United States
- Canada
- Western Europe
- Japan
- Australia
- Some parts of Latin America
- Some parts of the Middle East
0% – (-3%) (Yellow)
These countries are projected to experience a slight economic contraction:
- Mexico
- Venezuela
Less than -3% (Orange)
These countries are expected to face significant economic decline:
- Haiti
No Data (Grey)
No economic data available for:
• Greenland
1.3 Problematic Dependence on Foreign Fuel Sources
1.3 Problematic Dependence on Foreign Fuel SourcesThe US is highly dependent on crude oil to produce fuels for transportation. The figure below shows how the transportation sector is almost all oil-based, and the other sources barely make a dent in the hold petroleum has. Up until the last few years, the US has been highly dependent on foreign sources of oil. In 2023, petroleum accounted for approximately 89% of the primary energy consumption in the transportation sector, but it contributed less than 1% to the primary energy consumption in the electric power sector. The chart below illustrates the various types and quantities of primary energy sources used in the United States, the primary energy consumption by the electric power sector and end-use sectors, and the sales of electricity from the electric power sector to these end-use sectors. Growth across different parts of the global energy system varied widely in 2024, shaped by both short-term influences and longer-term structural shifts. Worldwide energy demand rose by 2.2%—well above the 1.3% annual average recorded from 2013 to 2023. Around 0.3 percentage points of this increase can be attributed to the effects of extreme weather. Even so, energy use expanded at a slower pace than the global economy, which grew by 3.2% in 2024, roughly in line with its long-term trend. Electricity demand grew faster than both overall energy use and GDP in 2024, rising by 4.3%. In absolute terms, this was the largest increase ever observed outside of post-recession rebounds. The surge was driven by structural factors, including wider use of electricity-intensive appliances such as air conditioning, shifts toward electricity-heavy manufacturing, growing needs from digitalisation, data centres, and AI, and the continued electrification of end uses. Altogether, the power sector accounted for around 60% of the global increase in energy demand.
On the supply side, renewables contributed the largest share of growth (38%), followed by natural gas (28%), coal (15%), oil (11%), and nuclear (8%). However, energy intensity improved by only 1%, extending the recent trend of slower efficiency gains. Energy-related CO₂ emissions rose by 0.8%—a deceleration compared with the 1.2% increase in 2023. (IEA, 2025).”
The US was the world's largest petroleum consumer (EIA, 2012), but was third in crude oil production. Over half of the material that was imported into the US comes from the Western hemisphere (North, South, and Central America, and the Caribbean), but we also imported 29% from Persian Gulf countries (Bahrain, Iraq, Kuwait, Saudi Arabia, and the United Arab Emirates).
The top 5 sources of net crude oil and petroleum imports included 1) Canada, 28%, 2) Saudi Arabia, 13%, 3) Mexico, 10%, 4) Venezuela, 9%, and 5) Russia, 5%. According to CNN Money, the US was behind Russia and Saudi Arabia in oil production for the first three months of 2016. See the World's Top Oil Producers for additional information. However, this situation recently changed, and the US became the world's largest oil producer in 2018 for the first time since 1973 and held the lead position through 2022. U.S. oil refineries obtain crude oil produced in the United States and other countries. Based on EIA, crude oil is extracted in 32 U.S. states as well as in coastal waters. In 2022, five states together made up roughly 72% of the total crude oil production in the United States. In 2022, 98 countries collectively produced around 80.75 million barrels of crude oil, with five of these nations contributing approximately 52% of the global total. The top five crude oil-producing countries and their respective shares of world crude oil production in 2022 were: The United States 14.7%, Saudi Arabia 13.2%, Russia 12.7%, Canada 5.6%, and Iraq, 5.5%. See the following link for further information see America is now the world's largest oil producer.

The image is a detailed chart titled "U.S. Energy Consumption by Source and Sector, 2023", showing how energy from various sources is distributed across different sectors of the U.S. economy. The total energy supplied by sources is 93.6 quadrillion British thermal units (Btu), while the total energy consumed by end-use sectors is 74.7 quadrillion Btu. The difference accounts for energy losses, primarily in electricity generation and transmission.
The energy sources are broken down as follows: Natural Gas accounts for 36% (33.6 quadrillion Btu), Petroleum for 35.4% (33.1 quadrillion Btu), Renewable Energy for 8.2% (7.7 quadrillion Btu), Coal for 8.1% (7.6 quadrillion Btu), and Nuclear Electric Power for 8.1% (7.6 quadrillion Btu).
The end-use sectors are Transportation at 28%, Industrial at 26%, Residential at 11.3%, and Commercial at 9.3%. These percentages represent the share of total energy consumption by each sector.
The Electric Power Sector uses 32.1 quadrillion Btu of energy. Of this, 13.2 quadrillion Btu (41%) is delivered as electricity sales to ultimate consumers, while 18.9 quadrillion Btu (59%) is lost in the electrical system due to generation and transmission inefficiencies.
The chart visually connects each energy source to the sectors it supplies, illustrating the flow of energy through the U.S. economy. For example, petroleum is primarily used in transportation, while natural gas, coal, renewables, and nuclear are major inputs for electricity generation. The chart is based on data from the U.S. Energy Information Administration’s Monthly Energy Review and includes notes on data rounding and definitions of primary energy consumption.
So, while oil is fairly available currently, there is extensive potentially explosive turmoil in many petroleum-producing regions of the world, and, in several places, the US's relationship with some oil-producing countries is strained. China and India are now aggressive and voracious players in world petroleum markets because of high economic growth (as pointed out in the previous section). Saudi Arabia's production is likely "maxed out," and domestic oil production peaked in 1970. While the US dependence on imported oil has declined after peaking in 2005, it is clear that if any one of the large producers decides to withhold oil, it could cause a shortage of fuel in the US and would cause the prices to skyrocket from an already high price (depending on the type of crude oil, the price of oil is currently $100-$106/bbl) (see U.S. Energy Information Administration). The figure below is a graphic showing the price level of oil from 1950 to the present. As you can see, there has been significant volatility in the price of oil in the last ~50 years. One of the first spikes came in 1974 when the Organization of the Petroleum Exporting Countries (OPEC) became more organized and withheld selling oil to the US. It was a true crisis at that point, with gasoline shortages causing long lines and fights at gas stations, with people filling up only on certain days depending on their license plates. It had a high spike in 1980, but a significant low in 1986. When the price of oil hit a significant low in 1998, the government took steps to lower the tax burden on oil companies. But when the prices went back up, the law remained in place, and currently, oil companies do not have to pay taxes on produced oil. When the reduced tax burden went into place in the late 90s, it made sense, but oil companies have continued to convince Congress with lobbyists that it should stay that way. What do you think?

As seen in the figure below, there were major fluctuations in gasoline prices in the last few years. As we will discuss in a later lesson, several aspects contribute to the price of gasoline, including but not limited to the recent COVID-19 Pandemic. This is a graphic that shows the price volatility for gasoline from 1990 - 2024 (the most recent data available), and the other figure below shows a breakdown of what goes into the price of gasoline.


The image presents a side-by-side comparison of the cost breakdown for a gallon of Regular Gasoline and Diesel in June 2024, based on data from the U.S. Energy Information Administration's Gasoline and Diesel Fuel Update.
For Regular Gasoline, the average retail price is $3.46 per gallon. The cost components are distributed as follows: 55% of the price comes from the cost of crude oil, 12% from refining, 18% from distribution and marketing, and 15% from taxes.
For Diesel, the average retail price is $3.72 per gallon. The breakdown is slightly different: 51% of the cost is attributed to crude oil, 13% to refining, 20% to distribution and marketing, and 16% to taxes.
The chart visually compares these percentages using proportional segments, highlighting the differences in how each fuel type's price is structured. Diesel has a slightly higher retail price and a greater share of costs allocated to distribution, marketing, and taxes, while gasoline has a higher proportion of its cost coming from crude oil.
In recent years, petroleum became less available and more expensive, and replacement-alternative fuels emerged because the economics were beginning to become more favorable. However, due to lower demand and high petroleum supply, prices drastically dropped, which may affect the development of alternative fuels. There is one factor that will most likely reverse this trend, and that is that energy demands will continue to increase worldwide. For future transportation fuel needs, most likely a liquid fuel will be necessary, and no one source will be able to replace petroleum. In the International Energy Outlook 2021 (IEO2021) Reference case, it is anticipated that, without major policy or technological advancements, global energy consumption will rise by nearly 50% over the next 30 years. While petroleum and other liquid fuels are expected to remain the world's primary energy source by 2050, renewable energy sources like solar and wind are projected to expand to almost the same level. It is important to note that Petroleum and other liquids include biofuels.

Note: Petroleum and other liquids include biofuels.
1.4 Reduction of Greenhouse Gas (GHG) Emission
1.4 Reduction of Greenhouse Gas (GHG) EmissionThere is a scientific consensus that greenhouse gas (GHG) production is increasing, which has led to climate change and several other environmental concerns. Despite efforts to make us believe otherwise, much of the severe weather occurring worldwide is indeed due to climate change. There is a significant amount of evidence to substantiate the existence of climate change and the overall warming of the earth. Climate change is due to the Greenhouse Effect; it is a natural effect, caused by CO2 and water vapor naturally present in the atmosphere. The focus of debate (scientific and political) has been on whether there is also an anthropogenic greenhouse effect, causing further climate change. Carbon dioxide (CO2) is not the only greenhouse gas (methane, CH4 is another potent GHG; this will be discussed further in upcoming sections), but most of the debate focuses on it. It is thought that the dramatic increase in CO2 in the atmosphere is due to the burning of fossil fuels.
The world is highly dependent on fossil fuels; the US is also highly dependent on fossil fuels. As we saw in the charts in Lesson 1.3, global energy consumption will continue to increase over the next 30 years. Fossil-based sources such as coal, natural gas, and petroleum are expected to be the dominant energy source in 2050.
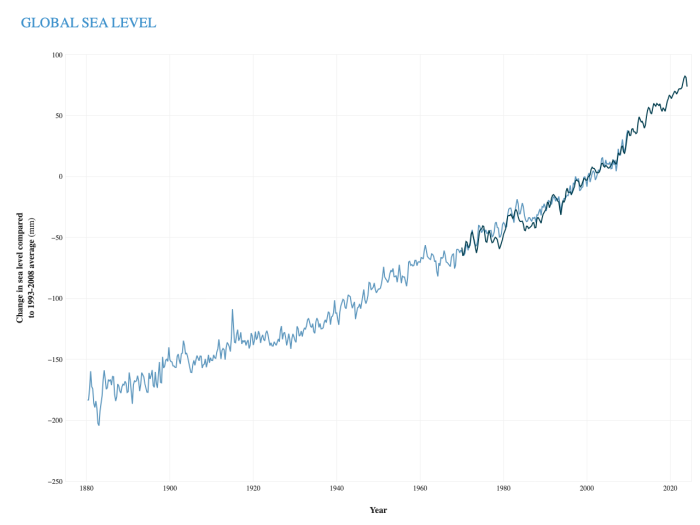
There is a mountain of evidence indicating that the planet is warming. The figure below shows global average surface temperature levels plotted from 1880-2020. The change has been most dramatic in the last 30 years. Yearly global temperatures from 1880 to 2023 relative to the 20th-century average show that Earth's surface temperature has increased by 0.14 degrees Fahrenheit per decade since 1880. The pace of warming has more than doubled since 1981.


The 2023 Global Climate Report from NOAA's National Centers for Environmental Information reveals that every month in 2023 was among the seven warmest on record for that particular month. Additionally, each month from June to December marked the hottest ever recorded for those months. In July, August, and September, global temperatures exceeded the long-term average by more than 1.0°C (1.8°F)—the first time any month in NOAA's records has surpassed this threshold.
The impacts of climate change on our planet can be observed from pole to pole. NOAA tracks global climate data, and here are some notable changes they've recorded, with more details available on the Global Climate Dashboard.
- Global temperatures have increased by about 1.8°F (1°C) from 1901 to 2020.
- Sea level rise has accelerated from 1.7 mm/year during most of the 20th century to 3.2 mm/year since 1993.
- Glaciers are retreating: the average thickness of 30 well-studied glaciers has reduced by over 60 feet since 1980.
- The summer sea ice coverage in the Arctic has diminished by approximately 40% since 1979.
- Atmospheric carbon dioxide levels have risen by 25% since 1958 and by about 40% since the Industrial Revolution.
- Snow is melting earlier than long-term averages indicate.
In the Arctic and Antarctic regions, the ice pack and glaciers are melting, and at an even faster rate than originally anticipated. Scientists have found that increasing atmospheric temperatures are not the only cause of this; the melting is causing water currents to shift and move warmer water around the poles, so melting is happening underneath the ice pack. The figure below shows that the total area of the Arctic Ocean with at least 15% ice coverage each September from 1979 to 2023 shows that, since 1980, the extent of ice surviving the summer has decreased by 13.1% per decade. The figure related to Sea Ice Concentration demonstrates that the sea ice concentration on September 19, 2023, compared to the 1981-2010 average extent for that date (indicated by the gold line), marked the sixth smallest summer minimum ever recorded. The sea levels have also risen by 8-9 inches since 1880, with the rate of increase accelerating during the satellite era.


Another problem could stem from the increased production of natural gas. Natural gas consists primarily of methane. Sources include petroleum and natural gas production systems, landfills, coal mining, animal manure, and fermentation of natural systems. Methane has 25 times the global warming potential of CO2. The figure below shows the total GHG percentages from various economic sectors. The transportation sector is the largest contributor of greenhouse gas emissions. Greenhouse gas emissions from transportation mainly result from burning fossil fuels in cars, trucks, ships, trains, and planes. Over 94% of transportation fuel is petroleum-based, including primarily gasoline and diesel, which leads to direct emissions. The transportation sector is the largest source of direct greenhouse gas emissions and ranks second when considering indirect emissions from electricity use across all sectors. Although transportation is an end-use sector for electricity, it currently accounts for a relatively small portion of total electricity consumption. Indirect emissions from electricity make up less than 1% of direct emissions in this sector. The next figure shows the emissions of various GHG emissions from 1990-2021. The EPA points out that overall emissions of CH4 have been reduced by 11% from 1990-2021. However, an article published in Nature (Yvon-Durocher, March 2014) suggests that there may be an unexpected consequence of warming temperatures; global warming can increase the amount of methane evolved from natural ecosystems. So, it remains to be seen what impacts can happen that have not been included in climate change models.

The image is a pie chart that illustrates the distribution of energy consumption across different sectors. The chart segments the total energy use into five main categories, each represented by a percentage of the whole.
The Transportation sector accounts for the largest share at 28%, indicating it is the most energy-intensive sector. This is followed by the Electric Power sector, which uses 25% of the total energy. The Industry sector comes next with 23%, reflecting significant energy use in manufacturing and production processes. The Residential & Commercial sector collectively consumes 13%, representing energy used in homes and businesses. Finally, the Agriculture sector accounts for 10% of total energy consumption.

There are several possible responses to abate CO2 and CH4: 1) do nothing; 2) reduce CO2 and CH4 prudently; 3) drastically reduce energy use; and 4) move to a carbon-free society. The easiest, but quite possibly the most damaging in the long run, is to do nothing - currently, some nations are pushing to at least increase conservation. The use of hybrids has decreased our use of gasoline, as the increase in Corporate Average Fuel Economy (CAFE) standards has had an impact. However, prudent measures to reduce GHG will most likely not be enough to make a huge impact. Therefore, the use of biofuels could have great potential for reducing the impact of CO2 and CH4, if done well. However, some actions in South America have shown that if switching to biofuel growth is not handled well, a greater problem can be created. Some rainforest areas were removed from South America to clear land for producing biofuels, but the rainforests that were removed were burned, putting an excessive amount of CO2 in the atmosphere. Rainforests have grown over long periods, so there was a lot of carbon stored in them - they were also places where exotic animals, plants, and insects lived, so the burning endangered the wildlife species in the rainforests. One thing to always keep in mind: whenever an action is taken in our atmosphere, there is the possibility of a negative consequence that one cannot foresee.
1.5 Assignments Overview
1.5 Assignments OverviewQuiz #1
Complete Quiz #1. It contains questions that pertain to the lesson material.
1.6 Summary and Final Tasks
1.6 Summary and Final TasksSummary
This lesson was about how using biofuels can benefit society. We looked at increasing energy demands around the world, how economically dependent we are on foreign sources of fuel, and how we don't have much control over what the prices of our fuels will be. We also explored how the growth in GHG emissions is a vital environmental concern and discussed how, without the use of biofuels, we cannot achieve significant reductions in GHG.
Lesson Objectives Review
By the end of this lesson, you should be able to:
- explain why biofuels are a necessary part of our energy portfolio.
References
"U.S. Energy Information Administration - EIA - Independent Statistics and Analysis. EIA's Energy in Brief: How Dependent Are We on Foreign Oil?
Greenhouse Gas Emissions: Greenhouse Gases Overview. EPA. Environmental Protection Agency.
Yvon-Durocher, G., Allen, A.P., Bastviken, D., Conrad, R., Gudasz, C., St-Pierre, A., Thanh-Duc, N., del Giorgio, P.A., "Methane fluxes show consistent temperature dependence across microbial to ecosystem scales," Nature, 507, 488-491.
Questions?
If there is anything in the lesson materials that you would like to comment on, or don't quite understand, please post your thoughts and/or questions to our Throughout the Course Questions Comments discussion forum and/or set up an appointment for office hour. The discussion forum is checked regularly (Monday through Friday). While you are there, feel free to post responses to your classmates if you are able to help.
Lesson 2: Existing Fossil Fuel Technologies for Transportation
Lesson 2: Existing Fossil Fuel Technologies for TransportationOverview
In the previous lesson, we learned that alternative fuels are a viable replacement for fossil fuels. But to make them viable, the fuels must fit into the current fuel structure and needs. This week's lesson focuses on transportation fuels - we will learn some chemistry about fuels (a short chemistry tutorial is first), how these fuels are currently made, and how these fuels are utilized. This provides a basis for understanding how alternative fuels must be chemically modified, so we do not have to make significant changes in utilization.
Lesson Objectives
By the end of this lesson, you should be able to:
- explain the chemistry of gasoline, diesel fuel, jet fuel, and fuel oil;
- describe the basics of how these fuels are made by converting from crude oil;
- discuss the utilization of these fuels in cars, trucks, aircraft, and various engine types;
- evaluate necessary fuel characteristics for various vehicle engines.
Lesson 2 Road Map
This lesson will take us one week to complete. Please refer to the Course Syllabus for specific time frames and assignment due dates.
Questions?
If there is anything in the lesson materials that you would like to comment on or don't quite understand, please post your thoughts and/or questions to our Throughout the Course Questions and Comments discussion forum. The discussion forum will be checked regularly. While you are there, feel free to post responses to your classmates if you are able to help. Regular office hours will be held to provide help for EGEE 439 students.
2.1 Chemistry Tutorial
2.1 Chemistry TutorialThe chemical compounds that are important for understanding most of the chemistry in this course are organic - that means that the compounds primarily contain carbon, hydrogen, and oxygen atoms (also sulfur and nitrogen). They can also be called hydrocarbons. The basic structures that we will be discussing in this course are called: 1) alkane (aka aliphatic), 2) branched alkane, 3) cycloalkane, 4) alkenes (double-bonds), 5) aromatic, 6) hydroaromatic, and 7) alcohols. First, I will show the atoms and how they are connected using the element abbreviation and lines as bonds, and then I will show abbreviated structural representations.
| Name | Atoms and Bonds | Stick Representation |
|---|---|---|
| Heptane (7 C atoms) |  | 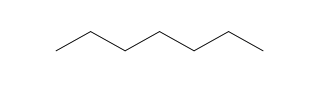 |
| Name | Atoms and Bonds | Stick Representation |
|---|---|---|
| Isobutane (4 C atoms) |  | 
|
| Isopentane (5 C atoms) |  |  |
| Name | Atoms and Bonds | Stick Representation |
|---|---|---|
| Cyclohexane (6 C atoms) |  |  |
| Name | Atoms and Bonds | Stick Representation |
|---|---|---|
| Pentene (5 C atoms) | 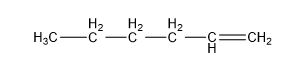 | 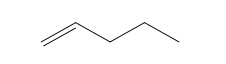 |
| Name | Atoms and Bonds | Stick Representation |
|---|---|---|
| Benzene (6 C atoms) | 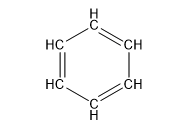 | 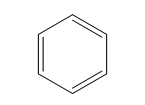 |
| Name | Atoms and Bonds | Stick Representation |
|---|---|---|
| 1,2,3,4-tetrahydronaphthalene, aka tetralin (10 C atoms) | 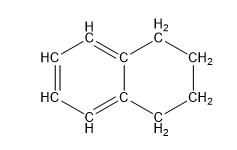 | 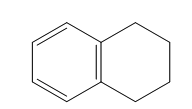 |
| Name | Atoms and Bonds | Stick Representation |
|---|---|---|
| Butanol (4 C atoms) |  |  |
| Ethanol (2 C atoms) |  |  |
The following table shows common hydrocarbons and their properties. It is important to know the properties of various hydrocarbons so that we can separate them and make chemical changes to them. This is a very brief overview - we will not yet be going into significant depth as to why the differences in chemicals affect the properties.
| Name | Number of C Atoms | Molecular Formula | bp (°C), 1 atm | mp (°C) | Density (g/mL) (@20°C) |
|---|---|---|---|---|---|
| Methane | 1 | CH4 | -161.5 | -182 | -- |
| Ethane | 2 | C2H6 | -88.6 | -183 | -- |
| Propane | 3 | C3H8 | -42.1 | -188 | -- |
| Butane | 4 | C4H10 | -0.5 | -138 | -- |
| Pentane | 5 | C5H12 | 36.1 | -130 | 0.626 |
| Hexane | 6 | C6H14 | 68.7 | -95 | 0.659 |
| Heptane | 7 | C7H16 | 98.4 | -91 | 0.684 |
| Octane | 8 | C8H18 | 125.7 | -57 | 0.703 |
| Nonane | 9 | C9H20 | 150.8 | -54 | 0.718 |
| Decane | 10 | C10H22 | 174.1 | -30 | 0.730 |
| Tetradecane | 14 | C14H30 | 253.5 | 6 | 0.763 |
| Hexadecane | 16 | C16H34 | 287 | 18 | 0.770 |
| Heptadecane | 17 | C17H36 | 303 | 22 | 0.778 |
| Eicosane | 20 | C20H42 | 343 | 36.8 | 0.789 |
| Cyclohexane | 6 | C6H12 | 81 | 6.5 | 0.779 |
| Cyclopentane | 5 | C5H10 | 49 | -94 | 0.751 |
| Ethanol | 2 | C2H6O | 78 | -114 | 0.789 |
| Butanol | 4 | C4H10O | 118 | -90 | 0.810 |
| Pentene | 5 | C5H10 | 30 | -165 | 0.640 |
| Hexene | 6 | C6H12 | 63 | -140 | 0.673 |
| Benzene | 6 | C6H6 | 80.1 | 5.5 | 0.877 |
| Naphthalene | 10 | C10H8 | 218 | 80 | 1.140 |
| 1,2,3,4-Tetrahydronaphthalene | 10 | C10H12 | 207 | -35.8 | 0.970 |
2.2 Refining of Petroleum into Fuels
2.2 Refining of Petroleum into FuelsMuch of the content in this particular section is based on information from Harold H. Schobert, Energy and Society: An Introduction, 2002, Taylor & Francis: New York, Chapters 19-24.
The following is a simplified flow diagram of a refinery. Since it looks relatively complicated, the diagram will be broken into pieces for better understanding.

Simple flow diagram of an oil refinery. Crude oil is the first process, and it breaks the products down into LPG, straight-run gasoline, naphtha/kerosene/diesel, fuel oil, and resid. LPG is used in the alkylation process to add carbons; straight-run gasoline is processed in a catalytic reformer to change to a branched-chain alkane; naphtha/kerosene/diesel is hydrotreated and dewaxed; fuel oil is catalytically cracked to make more gasoline, and resid is thermally cracked to make more gasoline.
Crude oil enters and goes to distillation. From distillation:
- LPG (gases) goes through alkylation to become O.N. 100 Motor Fuel Alkylate which can go on to become gasoline.
- Straight-run gasoline goes through catalytic reforming to become O.N. 95 Reformate which can go on to become gasoline.
- Naphtha, Kerosene, and Diesel all go through Hydrotreating and then dewaxing to become either treated Kerosene, Diesel (low sulfur), or lubricating oils.
- Fuel Oil goes through a catalytic cracker to become O/N 90-95 Gasoline.
- Resid goes through Thermal Cracking to become either Carbon, Asphalt, or O.N. 75 Gasoline.
Distillation
We will start with the first step in all refineries: distillation. Essentially, distillation is a process that heats crude oil and separates it into fractions. It is the most important process of a refinery. Crude oil is heated, vaporized, fed into a column that has plates in it, and the materials are separated based on the boiling point. It indicates that as the liquids are separated, the top-end materials are gases and lighter liquids, but as you go down the column, the products have a higher boiling point, the molecular size gets bigger, the flow of the materials gets thicker (i.e., increasing viscosity), and the sulfur (S) content typically stays with the heavier materials. Notice we are not using the chemical names, but the common mixture of chemicals. Gasoline represents the carbon range of ~ C5-C8, naphtha/kerosene (aka jet fuel) C8-C12, diesel C10-C15, etc. As we discuss the refinery, we will also discuss the important properties of each fuel.
The most important product in the refinery is gasoline. Consumer demand requires that 45-50 barrels per 100 barrels of crude oil processed are gasoline. The issues for consumers are, then: 1) quality suitability of gasoline and 2) quantity suitability. The engine that was developed to use gasoline is known as the Otto engine. It contains a four-stroke piston (and engines typically have 4-8 pistons). The first stroke is the intake stroke - a valve opens, allows a certain amount of gasoline and air, and the piston moves down. The second stroke is the compression stroke - the piston moves up and valves close so that the gasoline and air that came in the piston during the first stroke are compressed. The third stroke happens because the spark plug ignites the gasoline/air mixture, pushing the piston down. The fourth stroke is the exhaust stroke, where the exhaust valve opens and the piston moves back up. There is a good animation in How Stuff Works (Brain, Marshall. 'How Car Engines Work' 05 April 2000. HowStuffWorks.com).

Trends for products of the initial distillation
The image is a diagram of a distillation column used in the fractional distillation of crude oil, a key process in petroleum refining. The column is vertically oriented and segmented into several horizontal layers, each representing a different fraction collected during the distillation process. These fractions are separated based on their boiling points and other physical properties.
From Top to Bottom, the Fractions Are:
- Gases – The lightest and most volatile components, collected at the top.
- Gasoline – A light fuel used primarily in internal combustion engines.
- Naphtha – A volatile, flammable liquid used as a feedstock in petrochemical production.
- Kerosene – A heavier fuel used in jet engines and heating.
- Diesel – A mid-weight fuel used in diesel engines.
- Heating Oils – Heavier oils used for industrial heating and power generation.
- Resid – The heaviest fraction, often used for asphalt or further processing.
Accompanying Annotations:
To the right of the column, a vertical arrow points downward, indicating a gradient of physical properties as one moves down the column:
- Boiling Point (B.P) increases
- Molecular Size increases
- Viscosity increases
- Sulfur Content (S content) usually increases

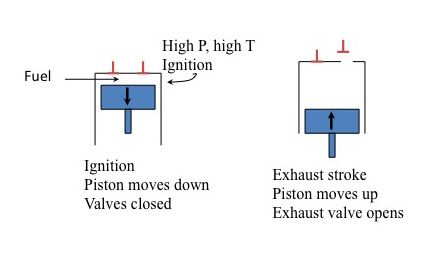
Four strokes of Otto gasoline engine
The diagram is divided into four vertical sections, each representing one of the four strokes in the engine cycle. Each section includes a labeled piston within a cylinder, directional arrows indicating piston movement, and annotations describing valve positions and actions.
Four strokes of Otto gasoline engine
- Intake stroke. The piston moves down. The intake valve opens.
- Compression stroke. The piston moves up. The valves close.
- Power stroke. The piston moves down. The valves closed.
- Exhaust stroke. The piston moves up. The exhaust valve opens.
You'll notice the x and the y on strokes 1 and 2. The ratio of x/y is known as the compression ratio (CR). This is a key design feature of an automobile engine. Typically, the higher the CR, the more powerful the engine is and the higher the top speed. The "action" is in the ignition or power stroke. The pressure in the cylinder is determined by 1) pressure at the moment of ignition (determined by CR) and 2) a further increase in pressure at the instant of ignition. At higher pressures with the CR, the more likely the pressure will cause autoignition (or spontaneous ignition), which can cause "knocking" in the engine - the higher the CR, the more likely the engine will knock. This is where fuel quality comes in.
For gasoline engines, the CR can be adjusted to the fuel rating to prevent knocking; this fuel quality is known as the "octane" number. Remember the straight-chain alkanes in the chemistry tutorial? The straight-chain alkanes are prone to knocking. The branched alkanes are not. The octane number is defined as 1) heptane - octane number equal to 0, and 2) 2,2,4-trimethylpentane - octane number equal to 100 (this is also known as "octane"). See the figure below for the chemical structures of heptane and octane for octane numbers. Modern car engines require an 87, 89, or 93-94 octane number. However, when processing crude oil, even high-quality crude oil, we can only produce from a distillation yield of 20% with an octane number of 50. This is why crude oil needs to be processed, to produce gasoline at 50% yield with an octane number of 87-94.

Other ways to improve the octane number:
- Add aromatics. Aromatics have an octane number (ON) greater than 100. They can be deliberately blended into gasoline to improve ON. However, many aromatic compounds are suspected carcinogens, so there are regulatory limits on the aromatic content in gasoline.
- Another approach to increasing ON is to add alcohol groups. Methanol and ethanol are typical alcohols that can be added to fuel. ON is ~110. They can be used as blends with racing cars (known as "alky").
But even with these compounds, distillation will not produce enough gasoline with a high enough ON. So other processes are needed.
"Cracking" Processes
Thermal cracking
One way to improve gasoline yield is to break the bigger molecules into smaller molecules - molecules that boil in the gasoline range. One way to do this is with "thermal cracking." Carbon Petroleum Dubbs was one of the inventors of a successful thermal cracking process. The process produces more gasoline, but the ON was still only ~70-73, so the quality was not adequate.
Catalytic cracking
Eugene Houdry developed another process; in the late 1930s, he discovered that thermal cracking performed in the presence of clay minerals would increase the reaction rate (i.e., make it faster) and produce molecules that had a higher ON, ~100. The clay does not become part of the gasoline - it just provides an active surface for cracking and changing the shape of molecules. The clay is known as a "catalyst," which is a substance that changes the course of a chemical reaction without being consumed. This process is called "catalytic cracking". The figure below shows the reactants and products for reducing the hexadecane molecule using both reactions. Catalytic cracking is the second most important process of a refinery, next to distillation. This process enables the production of ~45% gasoline with higher ON.

Below is the refining schematic with the additional processing added.

There are also tradeoffs when refineries make decisions as to the amount of each product they make. The quality of gasoline changes from summer to winter, as well as with gasoline demand. Prices that affect the quality of gasoline include 1) the price of crude oil, 2) the supply/demand of gasoline, 3) local, state, and federal taxes, and 4) the distribution of fuel (i.e., the cost of transporting fuel to various locations). Below is a schematic of how these contribute to the cost of gasoline and diesel.
Additional Processes
Alkylation
The alkylation process takes the small molecules produced during distillation and cracking and adds them to medium-sized molecules. They are typically added in a branched way in order to boost ON. An example of adding methane and ethane to butane is shown below.

Catalytic Reforming
A molecule may be of the correct number of carbon atoms but need a configuration that will either boost ON or make another product. The example below shows how reforming n-octane can produce 3,4-dimethyl hexane.
![]()
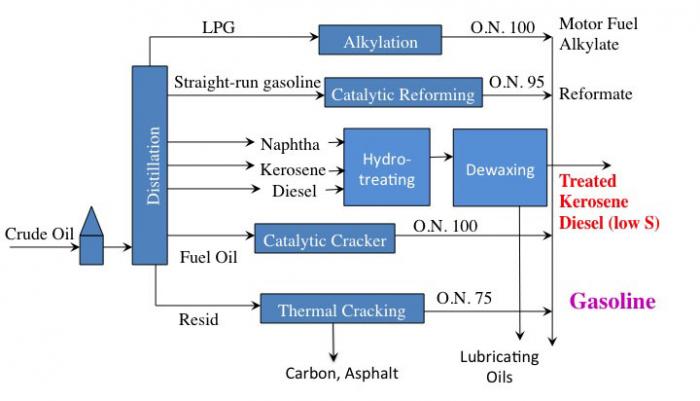
So, let's add these two new processes to our schematic in order to see how they fit into the refinery, and how this can change the ON of gasoline. The figure below shows the additions, as well as adding in the middle distillate fraction names. Typically, naphtha and kerosene, which can also be sold as these products, are the products that make up jet fuels. So, our next topic will cover how jet engines are different from gasoline engines and use different fuel.

Refining of crude oil into gasoline with additional processes of alkylation and catalytic reforming.
This is a simple flow diagram of a crude oil refinery.
Crude oil enters and goes to distillation. From distillation:
LPG (gases) goes through alkylation to become O.N. 100 Motor Fuel Alkylate which can go on to become gasoline
Straight-run gasoline goes through catalytic reforming to become O.N. 95 Reformate which can go on to become gasoline
Naphtha, Kerosene, and Diesel become jet fuels.
Fuel Oil goes through a catalytic cracker to become O.N 90-95 Gasoline
Resid goes through Thermal Cracking to O.N. 75 Gasoline.
2.3 Jet Engines
2.3 Jet EnginesThe first aircraft used engines similar to the Otto four-stroke cycle, reciprocating piston engines. The Wright Flyer was an aircraft with this type of engine. During WWII, powerful 16-cylinder, high-compression ratio reciprocating engines were developed. However, the military was interested in developing engines that would make airplanes go faster, higher, and farther - this was to reduce the length of flights and provide better international communication. In order to achieve high-speed flight, a dilemma ensued: 1) the atmosphere thins at high altitudes, offering less air resistance to a plane which could lead to higher speeds, but 2) in "thinner" air, it is more difficult to get combustion air into the conventional piston engine. The modern jet engine was developed as part of a term paper by Frank Whittle while at the British Royal Air Force College, covering the fundamental principles of jet propulsion aircraft.
The jet engine begins with a "burner can," where jet fuel is injected and combusted in high-pressure air. The combustion produces a stream of high-temperature, high-pressure gases, as shown in the first figure below. If more power is required, two to four-burner cans can be included, and the high-temperature, high-pressure combustion gases operate a turbine (more about turbines for electricity generation in the lesson on electricity). The second figure depicts these additions. In the third figure, a containment vessel is put around the burner cans; the gases that exit the turbine pass through a nozzle. The gases exiting the nozzle provide thrust for the airplane. The fourth figure shows the completed engine - the high-pressure air comes from the air compressor, which is operated by the turbine.


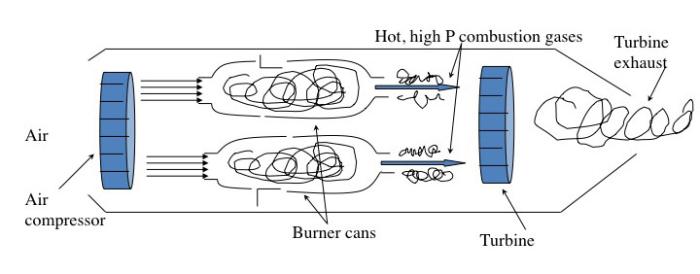
There are variations on a simplistic jet engine: 1) the fan jet (turbofan), 2) the prop jet (turboprop), and 3) the turboshaft. The fan jet has a large fan in front of the engine to help provide air to the air compressor. It is a little slower than a turbojet but more fuel-efficient. This is the type favored for civilian transport aircraft. The prop jet uses the mechanical work of the turbine to operate a propeller. These types of engines are typically used for commuter aircraft. The turboshaft is a gas turbine engine that uses all of the output of the turbine to turn the blades, without jet exhaust. Helicopters, tanks, and hovercrafts use these types of engines. So, what is the fuel for jets?
Jet Fuel
Conventional jet fuel is composed primarily of straight-run kerosene (straight-chain carbons and accompanying hydrogen, bigger molecules than gasoline). However, there are some purification steps that are needed to ensure that the fuel behaves in jet engines.
The first step is the removal of sulfur. When sulfur is burned, it forms sulfur oxide compounds, such as sulfur dioxide (SO2) and sulfur trioxide (SO3). Because there are multiple sulfur oxide compounds, they are abbreviated into one chemical formula of SOx. These compounds, when combined with water, form acid rain (more on this in the next lesson on coal for electricity generation). Sulfur compounds are corrosive to fuel systems and have noxious odors. Sulfur is removed by reacting it with hydrogen and a metal catalyst; the processes are known as hydrogen desulfurization processes (HDS) and produce H2S (hydrogen sulfide), which is then reacted to solid sulfur.
Another problem that can occur with jet fuel is if it contains too much aromatic compound content. A small amount is actually necessary to lubricate gaskets and O-rings. However, aromatics are suspected carcinogens, and in combustion, aromatics are precursors to smoke and soot. Too much aromatic content can cause problems such as 1) poor aesthetics, 2) carcinogens, and 3) tracking of military aircraft. The way to remove aromatic compounds is the same as for removing sulfur; the aromatic compound is reacted with hydrogen and a metal catalyst to add hydrogen to the aromatic ring. The resulting compounds are heteroaromatics and cycloalkanes.
Another problem that can occur in the middle distillate fractions can occur if the fuel contains waxes. Waxes are higher molecular weight alkane hydrocarbons that can be dissolved in kerosene. At very cold temperatures at high altitudes, wax can either separate as a solid phase or cause the fuel to freeze and cause plugging in the fuel lines. This can also cause a problem called low-temperature viscosity. Viscosity is a measurement of the flow of a fluid; the thicker the fluid gets (and flow is reduced), the higher the viscosity. While the fuel isn't frozen, it is flowing slower and could cause problems for the engine. Again, the reason for the increase in viscosity is similar to having waxes in the kerosene; high viscosity is caused by bigger molecules within the fuel. The way to improve jet fuel properties is to remove the larger molecules. This is called dewaxing.
The last problem we will discuss has to do with nitrogen. Jet fuels do not typically contain nitrogen, but when combusting fuel using air (which contains primarily nitrogen), nitrogen oxide compounds can form, shown as a formula NOx. Because jet engines burn fuels at high temperatures, thermal NOx is a problem. NOx will contribute to acid rain. If there is any nitrogen in the fuel, it would be removed during the removal of sulfur.
A refinery will make ~10% of its product as jet fuel. The Air Force uses 10% of that fuel, so about 1% of refinery output is for military jet fuel. The figure below shows the additional processes just discussed in our schematic.
Primary processes that are typical in a petroleum refinery.
This is a simple flow diagram of a crude oil refinery.
Crude oil enters and goes to distillation. From distillation:
LPG (gases) goes through alkylation to become O.N. 100 Motor Fuel Alkylate which can go on to become gasoline
Straight-run gasoline goes through catalytic reforming to become O.N. 95 Reformate which can go on to become gasoline
Naphtha, Kerosene, and Diesel all go through Hydrotreating and then dewaxing to become either treated Kerosene, Diesel (low sulfur) or lubricating oils.
Fuel Oil goes through a catalytic cracker to become O/N 90-95 Gasoline
Resid goes through Thermal Cracking to become either Carbon, Asphalt, or O.N. 75 Gasoline.
2.4 Diesel Engines
2.4 Diesel EnginesRudolf Diesel first developed Diesel engines in the 19th century. He did so because he wanted to develop an engine that was more efficient than an Otto engine and that could use poorer quality fuel than gasoline. The Diesel engine also operates on a four-stroke cycle, but there are some important differences. Diesel engines have a high compression ratio (CR)- a small Diesel engine has a CR of 13:1, while a high-performance Otto engine has a CR of 10:1. Upon the compression stroke (stroke 2), there is a high increase in temperature and pressure. In the third stroke, fuel is injected and it ignites because of the high temperature and pressure of the compressed air. You can see an animation of this at How Stuff Works (Brain, Marshall. 'How Diesel Engines Work' 01 April 2000. HowStuffWorks.com). Diesel engines use fuel more efficiently; and under comparable conditions, a Diesel engine will always get better fuel efficiency than a gasoline Otto engine. Essentially, Diesel engines operate by knocking. The continuous knocking has two consequences: 1) a Diesel engine must be more sturdily built than a gasoline engine, so it is heavier and has a longer life - 300,000-350,000 miles before major engine service, and 2) fuel standards are "backward" from that of gasoline; we want fuel to knock.
Diesel Fuel
Diesel fuel has a much higher boiling range than gasoline. The molecules are larger than gasoline, and the octane scale cannot be used as a guide. The scale that is used for diesel fuel is called the cetane number. The compound, cetane, or hexadecane, C16H34, is the standard where the cetane number is 100. For the cetane number 0 (the other end of the scale), the chemical compound used is methylnaphthalene, an aromatic compound that doesn't knock. Most diesel fuels will have cetane numbers of 40-55, with the value in Europe on the higher end and the value in the US at the lower end of that range. In a refinery, diesel fuels are processed in the same fashion as jet fuels, using hydrogenation reactions to remove sulfur and nitrogen and reacting aromatics to hydro aromatics and cycloalkanes. Dewaxing also must be done to improve viscosity and low-temperature problems, particularly in colder climates. Therefore, the primary processes that are typical in a petroleum refinery apply to diesel fuel as well as jet fuel. Except in airplanes, diesel engines dominate internal combustion engine applications. They are standard for large trucks; dominate railways in North America and other countries; are common in buses; and are adapted in small cars and trucks, particularly in Europe.
Similar to gasoline, prices that affect the quality of diesel include 1) the price of crude oil, 2) the supply/demand of diesel, 3) local, state, and federal taxes, and 4) the distribution of fuel (i.e., the cost of transporting fuel to various locations). Above is a schematic of how these contribute to the cost of diesel.

2.5 Assignments Overview
2.5 Assignments OverviewQuiz #2
Complete Quiz #2. It contains questions that pertain to the lesson material.
2.6 Summary and Final Tasks
2.6 Summary and Final TasksSummary
This lesson was a very brief overview - there are entire classes based on this one lecture. In this lesson, we discussed the different transportation engines for vehicles, the fuels used for these vehicles, and how the fuels are produced from a refinery. Gasoline is the lighter fuel used in typical automobile engines, while diesel fuel is used in Diesel engines. Diesel engines get better fuel mileage than gasoline engines - gasoline is lighter than diesel. Here in the US, the primary fuel produced is gasoline (~45-50%).
Lesson Objectives Review
By the end of this lesson, you should be able to:
- explain the chemistry of gasoline, diesel fuel, jet fuel, and fuel oil.
- describe the basics of how these fuels are made by converting from crude oil.
- discuss the utilization of these fuels in cars, trucks, aircraft, and various engine types.
- evaluate necessary fuel characteristics for various vehicle engines.
Questions?
If there is anything in the lesson materials that you would like to comment on, or don't quite understand, please post your thoughts and/or questions to our Throughout the Course Questions Comments discussion forum and/or set up an appointment during office hours. The discussion forum is checked regularly (Monday through Friday). While you are there, feel free to post responses to your classmates if you can help.
Lesson 3: Use of Biomass in Thermal Technologies
Lesson 3: Use of Biomass in Thermal TechnologiesOverview
In the last few lessons, we’ve learned about why current society is considering the use of biomass and the current methods of generating transportation fuels and electricity from fossil sources. With this lesson, we are moving into the use of biomass in various ways. This lesson focuses on thermal processes (both to generate electricity and liquid fuels), using biomass rather than coal, petroleum, or natural gas. Different fuels are produced from gasification and pyrolysis, so we will determine how each must be processed and utilized for fuel.
Lesson Objectives
By the end of this lesson, you should be able to:
- explain how wood was used historically to produce heat and electricity;
- evaluate the difference between combustion and gasification, and explain how design features differ depending on the process;
- evaluate how pyrolysis is different from gasification;
- describe the utilization of products from gasification versus pyrolysis, including how the processing of products differs.
Lesson 3 Road Map
This lesson will take us one week to complete. Please refer to the Course Syllabus for specific time frames and assignment due dates.
Questions?
If there is anything in the lesson materials that you would like to comment on or don't quite understand, please post your thoughts and/or questions to our Throughout the Course Questions and Comments discussion forum. The discussion forum will be checked regularly. While you are there, feel free to post responses to your classmates if you are able to help. Regular office hours will be held to provide help for EGEE 439 students.
3.1 Wood
3.1 WoodHistory of Burning Wood
Wood has been used as a source of energy for thousands of years (the first known use of fire was determined when archeologists made discoveries of humans living 400,000 years ago), and wood was the obvious source to make fire. In the Americas, in 1637, the people of Boston suffered from the scarcity of wood. It became America’s first energy crisis after less than one century of settlement. During the late 1700s, Benjamin Franklin invented a cast iron stove for indoor use. It held heat in the room after the fire burned out. However, it had a design flaw in that it had no way to pull in air, so fires went out quickly. So David R. Rittenhouse added a chimney and exhaust pipe to improve upon it.
Burning Wood
First, we will look at where energy is stored in materials, starting with the methane molecule. The combustion of methane is exothermic (releases heat as the reaction proceeds), but the reaction must be initiated before it will sustain itself with the continued availability of methane and oxygen. The formula below shows the reaction in a stoichiometric format:
The figure below shows the same reactants and products, but with the bonds before reaction and after the reaction, on a molecular/atomic level. The number of atoms in each molecule doesn't change, but how they are arranged and connected does. The only real change is how the atoms are linked - these are the chemical bonds. Since ENERGY comes out of a burning system, then it must mean that more energy is stored in 4 C-H bonds and 2 O-O bonds than in 4 H-O and two C-O bonds. The ENERGY released during chemical combustion comes from ENERGY stored in chemical bonds of fuel & oxygen.

The 1 Methane and 2 oxygen reaction shows bond connections before and after the combustion reaction.
Reactants: Methane will react with two oxygen molecules. All of the four hydrogens in methane are connected to a single carbon atom by 4 single bonds. The oxygen molecules are each two oxygen atoms connected by a double bond.
During combustion, the atoms rearrange and form new bonds.
Products: The carbon atom connects to 2 oxygen atoms with a double bond between the carbon and each oxygen to produce one carbon dioxide molecule. Additionally, each of the other remaining oxygen atoms forms 2 single bonds to 2 of the remaining hydrogen atoms to form a water molecule. The net products of the reaction are 1 CO2 molecule and 2H2O molecules.
We now know the reaction chemistry of methane combustion, but wood is a much more complex material than methane. Wood contains up to 50% water. Water in the wood will reduce the heating value of the wood, and if the wood is very wet, it will lead to a smoky fire. The main components of wood (we will cover this in more depth in a later lesson) are cellulose (what paper is made from) and lignin (the part of a tree that makes it have a sturdy structure). In order to start a fire, you typically must ignite a material that burns easily to begin heating the wood (this can be newspaper or a “fire starter”). The components begin to decompose from the heat (therefore we are not technically “burning” yet), which produces vapors and char. The vapors are called “volatiles” and the char is composed of carbon and ash. The volatiles are what actually begin to burn, producing a flame. The carbon-rich char produces glowing embers or “coals,” which are needed to keep the fire sustained. Wood does not typically contain sulfur, so no sulfur oxides (or SOx) are produced.
There can be problems with burning wood. The smoke comes from particulates that did not burn or only partially burned which can pollute the atmosphere, and typically come from resins in the trees. It isn’t an issue when one or two people are burning wood, but when thousands of people burn wood in fireplaces. In State College, Pennsylvania, in the winter, one can see smoke in the air from fireplaces. Wood fires in fireplaces can also deposit soot and creosote in the chimneys, which if not cleaned periodically, can ignite. Burning wood (or really most things) will produce an ash material (minerals in wood and coal that react with air under combustion conditions); the ash must be disposed of. Wood smoke also contains a variety of chemicals that can be carcinogenic.
Now let’s begin discussing different biomass sources, how we measure different properties of different biomasses, and how to determine the atomic composition of biomass.
3.2 Biomass
3.2 BiomassThere are four types of biomass resources that can be utilized:
- agricultural residues
- energy crops
- forestry residues
- processing wastes
Examples of different sources are listed below:
Agricultural Residues:
- Corn stover
- Wheat straw
- Rice straw
- Soybean stalk
Energy Crops:
- Switchgrass
- Sweet sorghum
- Sugar canes
- Algae
- Cattail
- Duckweed
Forestry Residues:
- Saw dust
- Woody chips
Processing wastes:
- Food processing wastes
- Animal wastes
- Municipal solid wastes
As already mentioned, most biomass is at least partially composed of three components: cellulose, hemicellulose, and lignin. The figures below show a diagram of lignocellulose and the biomass broken down into three parts. There will be significantly more discussion on biomass composition in future lessons. Cellulose is a crystalline polymer of ring molecules (6 carbons) with OH and COOH groups (in the first figure below, cellulose is the straight green lines; in the second figure it is the green molecule). Hemicellulose is similar, but has ring molecules with 5 and 6 carbons, and is amorphous in structures, as depicted in the first figure below by the black squiggly line; The second figure shows how it is around the cellulose and more detail of the molecular structure. Lignin is the material that holds it all together and is the light blue line in the first figure below and it is in red in the second figure.

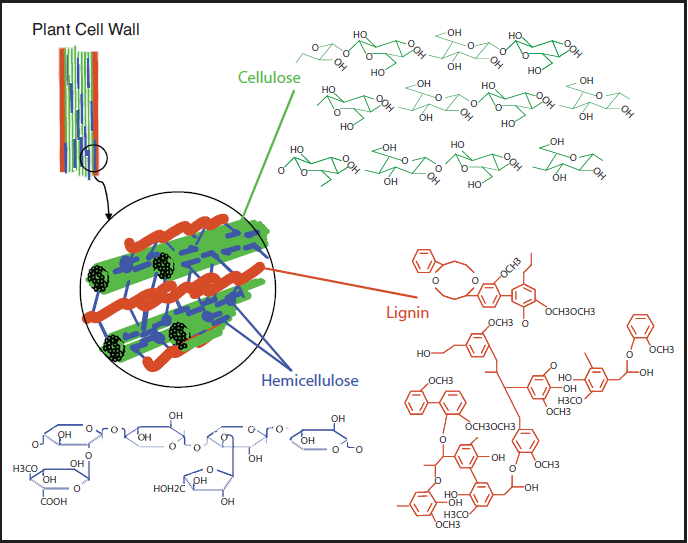
The image is a detailed scientific diagram illustrating the biomass and its three primary components: cellulose, hemicellulose, and lignin. On the left side, the plant cell wall is shown in a magnified view, revealing how these components are arranged within the wall's matrix.
Cellulose is represented in green and is shown as long, linear chains that form microfibrils, providing structural strength. Its chemical structure is displayed in the top right corner of the image.
Hemicellulose is depicted in blue and appears as shorter, branched polysaccharides that interact with cellulose fibers, helping to cross-link the cell wall components. Its chemical structure is shown in the bottom left corner.
Lignin is illustrated in red and is shown filling the spaces between cellulose and hemicellulose, adding rigidity and resistance to degradation. Its complex, aromatic chemical structure is displayed in the bottom right corner.
How To Determine Properties of Biomass
There are four common ways to measure the properties of any carbon product, which will also be used for biomass: 1) proximate analysis, 2) ultimate analysis, 3) heat of combustion, and 4) ash analysis.
Proximate analysis
Proximate analysis is a broad measurement to determine the moisture content (M), volatile matter content (VM), fixed carbon content (FC), and ash content. These are all done on a mass basis, typically, and are done in what is called a proximate analyzer – the analyzer just measures the mass loss at certain temperatures. Moisture is driven off at ~105-110°C (just above the boiling point of water); it represents physically bound water only. Volatile matter is driven off in an inert atmosphere at 950°C, using a slow heating rate. The ash content is determined by taking the remaining material (after VM loss) and burning it at above 700°C in oxygen. The fixed carbon is then determined by the difference: FC = 1 – M – Ash – VM.
The following is an example of proximate analysis of lignin, which is part of wood and/or grasses, primarily:
- Moisture (wt%): 5.34
- Ash (wt%): 14.05
- Volatile Matter (wt%): 60.86
Sometimes the moisture content will be removed from the VM and ash contents, on a dry basis:
Ultimate analysis
The ultimate analysis is more specific in that it analyzes the elemental composition of the organic portion of materials. The compositions of carbon (C), hydrogen (H), nitrogen (N), sulfur (S), and oxygen (O) are determined on a mass percent basis and can be converted to an atomic basis. In some cases, chlorine (Cl) will also be analyzed. There are instruments that are designed to measure only the C H N mass percent and then another to measure the S percent; the instrument combusts the material and measures the products of combustion. The following is an example problem for determining the molecular atomic composition of biomass when being provided with an ultimate analysis. Oxygen is usually determined by difference. Water can skew the hydrogen results and must be accounted for.
Your Turn
Problem 1:
The ultimate analysis shows that the C, H, O, N, and S contents of a biomass material are 51.9%, 5.5%, 41.5%, 0.8%, and 0.3% on a dry basis. What is the chemical formula of this biomass? How many kilograms of air are required to completely combust 1 kg of this biomass? The results are shown below.
The following examples are of the calculation of Problem 1, the chemical formula of biomass, when given mass percent on a dry basis. If you know the elemental mass percent of the sample, you can divide it by the molecular weight to determine the atomic value of each element. The values in the table are then divided by the atomic number of carbon to normalize the molecule. So, for every carbon, you have 1.26 atoms of hydrogen, 0.6 atoms of oxygen, etc.
| Values | |
|---|---|
Heat of combustion
The heat of combustion can be measured directly using a bomb calorimeter. This instrument is used to measure the calorific value per mass (calorie/gram or Btu/lb). It can also be estimated using different formulas that calculate it based on either ultimate or proximate analysis. A common type of calorimeter is the isoperibol calorimeter, which will contain the heat inside the jacket but will accommodate the change in temperature of the water in the bucket; see the schematic below. A sample is placed in a crucible that is put inside of a reactor with high-pressure oxygen. The sample is connected to a fuse and electrical leads that will ignite the sample, all contained within the reactor (sometimes called a bomb calorimeter). The water temperature in the bucket is measured before and after ignition, and with all the other parts calibrated, the specific heat of the water and the change in temperature are used to determine the heat of combustion.
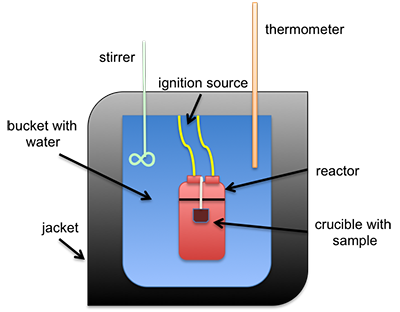
Schematic of isoperibol calorimeter.
This is a schematic of an isoperibol calorimeter. There is a crucible containing a sample. Both sit inside a reactor. The reactor itself is in a bucket with water that has an insulating jacket on the outside, including the top. Sticking into the water are a stirrer and a thermometer. The reaction is started by an ignition source connected to the reactor.
The heating value is determined in a bomb calorimeter. Heating values are reported on both wet and dry fuel bases. For the high heating value (HHV), the value can be determined by normalizing out the moisture in a liquid form. For the low heating value (LHV), a portion of the heat of combustion is used to evaporate the moisture.
Ash Analysis
The minerals in the material, once combusted, turn to ash. The ash can be analyzed for specific compounds that will contain oxygen, such as CaO, K2O, Na2O, MgO, SiO2, Fe2O3, P2O5, SO3, and Cl. The original minerals can also be measured. Once the mineral or ash is isolated, it often must be dissolved in various acids and then analyzed. There is other instrumentation available, but the analysis is quite complicated and not often done.
Bulk density is also determined for biomass as a property. It is typically determined by measuring the weight of material per unit volume. It is usually determined on a dry weight basis (moisture-free) or on an as-received basis with moisture content available. For biomass, the low values (grain straws and shavings) are 150-200 kg/m3 (0.15-0.20 g/cm3), and the high values (solid wood) are 600-900 kg/m3 (0.60-0.90 g/cm3). The heating value and bulk density are used to determine the energy density. The figure below shows a comparison of various biomass sources to fossil fuel sources on an energy density mass basis.

Many of the fuel characteristics we have been discussing need to be known for the proper use of biomass in combustion, gasification, and other reaction chemistry.
3.3 Gasification
3.3 GasificationNow, we will go into gasification and compare it to combustion. Gasification is a process that produces syngas, a gaseous mixture of CO, CO2, H2, and CH4, from carbonaceous materials at high temperatures (750 – 1100°C). Gasification is a partial oxidation process; the reaction takes place with a limited amount of oxygen. The overall process is endothermic (requires heat to keep the reaction going), so it requires either the simultaneous burning of part of the fuel or the delivery of an external source of heat to drive the process.
Historically, gasification was used in the early 1800s to produce lighting, in London, England (1807) and Baltimore, Maryland (1816). It was manufactured from the gasification of coal. Gasification of coal, combined with Fischer-Tropsch synthesis was one method that was used during WWII to produce liquid fuel for Germany because they did not have access to oil for fuel. It has also been used to convert coal and heavy oil into hydrogen for the production of ammonia and urea-based fertilizers. As a process, it continues to be used in South Africa as a source of liquid fuels (gasification followed by Fischer-Tropsch synthesis).
Gasification typically takes place at temperatures from 750-1100°C. It will break apart biomass (or any carbon material), and usually, an oxidizing agent is added in insufficient quantities. The products are typically gas under these conditions, and the product slate will vary depending on the oxidizing agent. The products are typically hydrogen, carbon monoxide, carbon dioxide, and methane. There may also be some liquid products depending on the conditions used. Gasification and combustion have some similarities; the figure below shows the variation in products between gasification and combustion. The table shows a comparison of the conditions.

| Specification | Combustion | Gasification |
|---|---|---|
| Oxygen Use | Uses excess | Uses limited amounts |
| Process Type | Exothermic | Endothermic |
| Product | Heat | Combustible Synthesis |
Zones of Gasification
There are several zones that the carbon material passes through as it proceeds through the gasifier:
- drying
- pyrolysis
- combustion
- reduction
The schematic below shows the zones and the products that typically occur during that part of the process. First, we will discuss what happens in each zone. We will also be looking at different gasifier designs to show these zones change depending on the design, and each design has advantages and disadvantages.
The drying process is essential to remove surface water, and the “product” is water. Water can be removed by filtration, evaporation, or a combination of both. Typically, waste heat is used to do the evaporation.

General schematic of different regions in a gasifier.
Diagram showing different regions and products in a gasifier. Heat is applied to the entire system, oxidizing agents such as air, O2, H2O, and CO2 enter from the bottom and biomass enters from the top.
The biomass first goes through drying which removes water. It then goes through pyrolysis which produces char, tar, and methane. From pyrolysis, the biomass can go to reduction or combustion which produces carbon dioxide and water. If the biomass goes through combustion it also then goes to reduction which produces hydrogen gas and carbon monoxide.
Pyrolysis is typically the next zone. If you look at it as a reaction:
where x is the mass fraction of tars in the volatiles. Volatile gases are released from the dry biomass at temperatures ranging up to about 700oC. These gases are non-condensable vapors such as CH4, CO, CO2, and H2 and condensable vapor of tar at the ambient temperature. The solid residues are char and ash. A typical method to test how well a biomass material will pyrolyze is thermogravimetric analysis; it is similar to the proximate analysis. However, the heating rate and oxidizing agent can be varied, and the instrument can be used to determine the optimum temperature of pyrolysis.
Gasification Process and Chemistry: Combustion and Reduction
A limited amount of oxidizing agent is used during gasification to partially oxidize the pyrolysis products of char (C), tar, and gas to form a gaseous mixture of syngas mainly containing CO, H2, CH4, and CO2. Common gasifying agents are air, O2, H2O, and CO2. If air or oxygen is used as a gasifying agent, partial combustion of biomass can supply heat for the endothermic reactions.
Combustion of gases:
The equivalence ratio (ER) is the ratio of O2 required for gasification, to O2 required for full combustion of biomass. The value of ER is usually 0.2 - 0.4. At too high ER values, excess air causes unnecessary combustion of biomass and dilutes the syngas. At too low ER values, the partial combustion of biomass does not provide enough oxygen and heat for gasification.
There are several reactions that can take place in the reduction zone. There are three possible types of reactions: 1) solid-gas reactions, 2) tar-gas reactions, and 3) gas-gas reactions. Essentially, H2O and CO2 are used as gasifying agents to increase the H2 and CO yields. The double-sided arrow represents that these reactions are reversible depending on the conditions used.
Solid-gas reactions include:
Tar-gas reactions include:
Gas-gas reactions include:
The reactions can be affected by reaction equilibrium and kinetics. For a long reaction time: 1) chemical equilibrium is attained, 2) products are limited to CO, CO2, H2, and CH4, and 3) low temperatures and high pressures favor the formation of CH4, whereas high temperatures and low pressures favor the formation of H2 and CO. For a short reaction time: 1) chemical equilibrium is not attained, 2) products contain light hydrocarbons as well as up to 10 wt% heavy hydrocarbons (tar), and 3) steam injection and catalysts can shift the products toward lower molecular weight compounds.
Gasifier Designs
There are several types of gasifier designs:
- updraft
- downdraft
- cross downdraft
- fluidized bed
- plasma
The first type of gasifier is the updraft design. The advantages include that it is a simple design and is not sensitive to fuel selection. However, disadvantages include a long start-up time, production of high concentrations of tar, and a general lack of suitability for modern heat and power systems.
The downdraft gasifier is similar, but the air enters in the middle of the unit and gases flow down and out. The oxidation and reduction zones change places. Advantages of this design include low tar production, low power requirements, a quicker response time, and a short start-up time. However, it has a more complex design, fuel can be fouled with slag, and it cannot be scaled up beyond 400 kg/h.

Updraft design gasifier.
Schematic of an Updraft Gasifier. The diagram looks like a cylinder with oxidizing gas entering at the bottom and flowing up and out at the top. There are 5 layered zones in the gasifier. Starting at the bottom there is the ash zone, the oxidation zone, the reduction zone, the pyrolysis zone, and the drying zone.

Downdraft design gasifier.
Schematic of a downdraft gasifier. The diagram again looks like a cylinder and again has 5 layered zones. From the bottom up they are the ash pit, the reduction zone, the oxidation zone, the pyrolysis zone, and the drying zone. The air enters in the middle of the gasifier at the oxidation zone and the air flows down and comes out the bottom as product gas.
The crossdraft design gasifier is similar to the downdraft, it has a quicker response time and a short start-up time; it is also complex in design, cannot use high mineral-containing fuels, and fuel can be contaminated with slag from ash.
With a fluidized bed design gasifier, the action of this gasifier is similar to how water might boil, except the air (or other gas) flows through the fines (the sample and sand) at temperature, creating a bubbling effect similar to boiling. Because of this action, it has the advantages of greater fuel flexibility, better control, and a quick response to changes. But because of these advantages, these types of gasifiers have a higher capital cost, and a higher power requirement, and must be operated on high particulate loading.

Crossdraft design gasifier.
Schematic of a crossdraft gasifier. This gasifier again looks like a cylinder and has all 5 of the zones the previous 2 did. However, instead of layers, the zones look more like a bullseye. Air enters halfway up the cylinder in the very center which is the oxidation zone. Around the oxidation zone is the reduction zone and outside that is the pyrolysis zone. The drying zone is around them all. The ash pit is still a layer at the very bottom. Product gas comes out at the same level the air initially came in.

Fluidized bed design gasifier.
Schematic of a fluidized bed design gasifier. This gasifier looks like a cylindrical capsule where air, oxygen or steam enters from the bottom. Near the bottom, there is a distributor plate. The fluidized bed with the fuel sits on top of the plate and at the bottom of the fluidized bed, there is an exit for the ash. There is a mechanism to recirculate the fines near the top of the fluidized bed. To exit, the gas flows through a cyclone and out the top of the gasifier.
One of the new design gasifiers is a plasma gasifier design. Plasma gasification uses extremely high temperatures in an oxygen-starved environment to decompose waste material into small molecules and atoms so that the compounds formed are very simple and form syngas with H2, CO, and H2O. This type of unit functions very differently, as electricity is fed to a torch that has two electrodes – when functioning, the electrodes create an arc. Inert gas is passed through the arc, and, as this occurs, the gas heats to temperatures as high as 3,000 °C (Credit: Westinghouse Plasma Corporation). The advantages of such units include:
- process versatility
- superior emission characteristics
- no secondary treatment of byproducts
- valuable byproducts
- enhanced process control
- volume reduction of material fed
- small plant size
Units such as these are more expensive and scaling up is still in the research stage. These types of units are most commonly used for municipal waste sludge.

Plasma Design Gasifier.
Schematic of a plasma design gasifier. This looks like a funnel with a lid. About halfway up there is a waste inlet. Below that there is an inlet for air or oxygen and near the bottom there are plasma torches. The syngas exits from an outlet at the top and slag and recovered metals are collected from an outlet at the bottom.
General information on gasification
So what products are made, what advantages are there to using various oxidizing sources, how are the byproducts removed, and how is efficiency improved? Besides syngas, other products are made depending on the design. As stated previously, the syngas is composed of H2, CO, CO2, H2O, and CH4. Depending on the design, differing amounts of tar and char can also be made. For example, for steam fluidized gasification of wood sawdust at atmospheric pressure and 775°C, 80% of the carbon will be made into syngas, 4% of the carbon will produce tar, and 16% will produce char (Herguido J, Corella J, Gonzalez-Saiz J. Ind Eng Chem Res 1992; 31: 1274-82.)
There are multiple uses for syngas, for making hydrocarbon fuels, for producing particular chemicals, and for burning as a fuel; therefore, syngas has a heating value. The heating value can be calculated by the volumetric fraction and the higher heating values (HHV) of gas components, which is shown in this equation:
where:
A problem based on this equation and HHVs will be included in the homework.
Other factors are determined for optimal gasification. Thermal efficiency is the conversion of the chemical energy of solid fuels into chemical energy and sensible heat of gaseous products. For high-temperature/high-pressure gasifiers, the efficiency is high, ~90%. For typical biomass gasifiers, the efficiency is reduced to 70-80% efficiency. Cold gas efficiency is the conversion of the chemical energy of solid fuel to the chemical energy of gaseous products; for typical biomass gasifiers, the efficiency is 50-60%.
There are several processing factors that can affect different aspects of gasification. The following table shows the main advantages and technical challenges of different gasifying agents. Steam and carbon dioxide as oxidizing agents are advantageous in making high-heating value syngas with more hydrogen and carbon monoxide than other gases but also require external heating sources and catalytic tar reformation.
| Gasifying Agent | Main Advantages | Main Technical Challenges |
|---|---|---|
| Air | Partial combustion for heat supply of gasification. Moderate char and tar content. | Low heating value (3-6 MJ/Nm3) Large amount of N2 in syngas (i.e., >50% by volume) Difficult determination of equivalence ratio (ER) |
| Steam | High heating value syngas (10-15 MJ/Nm3) H2-rich syngas (i.e., >50% by volume) | Requires indirect or external heat supply for gasification High tar content in syngas Tar requires catalytic reforming to syngas unless used to make chemicals |
| Carbon dioxide | High heating value syngas High H2/CO and low CO2 in syngas | Requires indirect or external heat supply Tar requires catalytic reforming to syngas unless used to make chemicals |
Basic design features can also affect the performance of a gasifier. The table below shows the effect of a fixed bed versus a fluidized bed and the differences in temperature, pressure, and equivalence ratio. Fixed/moving beds are simpler in design and favorable on a small scale economically, but fluidized bed reactors have higher productivity and low byproduct generation. The rest of the table shows how increased temperature can also favor carbon conversion and the HHV of the syngas, while increased pressure helps with producing high-pressure syngas without compression to higher pressures downstream.
| Bed Design | Main Advantages | Main Technical Challenges |
|---|---|---|
| Fixed/moving bed | Simple and reliable design Favorable economics on a small scale | Long residence time Non-uniform temperature distribution in gasifiers High char and/or tar contents Low cold gas efficiency Low productivity (i.e., ~5 GJ/m2h) |
| Fluidized bed | Short residence time High productivity (i.e., 20-30 GJ/m2h) Uniform temperature distribution in gasifiers Low char and/or tar contents High cold gas efficiency Reduced ash-related problems | High particulate dust in syngas Favorable economics on a medium to large scale |
| Increase of temperature | Decreased tar and char content Decreased methane in syngas Increased carbon conversion Increased heating value of syngas | Decreased energy efficiency Increased ash-related problems |
| Increase of pressure | Low tar and char content No costly syngas compression is required for downstream utilization of syngas | Limited design and operational experience Higher cost of gasifier at small scale |
| Increase of ER (Equivalence Ratio) | Low tar and char content | Decreased heating value of syngas |
Product Cleaning
The main thing that has to be done to clean the syngas is to remove char and tar. The char is typically in particulate form, so the particulates can be removed in a way similar to what was described in the power plant facility. Typically for gasifiers, the method of particulate filtration includes gas cyclones (removal of particulate matter larger than 5 μm). Additional filtration can be done using ceramic candle filters or moving bed granular filters.
Tars are typically heavy liquids. In some cases, the tars are removed by scrubbing the gas stream with a fine mist of water or oil; this method is inexpensive but also inefficient. Tars can also be converted to low molecular weight compounds by “cracking” into CO and H2 (these are typically the desired gases for syngas). This is done at high temperature (1000°C) or with the use of a catalyst at 600-800°C. Tars can also be “reformed” to CO and H2, which can be converted into alcohols, alkanes, and other useful products. This is done with steam and is called steam reforming of tar; the reaction conditions are at a temperature of ~250°C and pressure of 30-55 atm. The reaction is shown below and is the same reaction as that shown in reaction 11:
Tar steam reforming reaction:
Steam reforming has advantages. It is generally a safer operation since there isn’t any oxygen in the feed gases, and it produces a higher H2/CO ratio syngas product than most alternatives. The main disadvantage is a lower thermal efficiency, as heat must be added indirectly because the reaction is endothermic.
Syngas Utilization
As stated earlier, syngas has multiple uses. Syngas can be used to generate heat and power, and can even be used to turn a turbine in some engineering designs. Syngas can also be used as the synthesis gas for Fischer-Tropsch fuel production, synthesis of methanol and dimethyl ether (DME), fermentation for the production of biobased products, and production of hydrogen.
So, how is syngas utilized in heat and power generation? Syngas can be used in pulverized coal combustion systems; it help the coal to ignite and to prevent the plugging of the coal feeding system. Biomass gasification can ease ash-related problems. This is because the gasification temperature is lower than in combustion, and once gasified, can supply clean syngas to the combustor. Adding a gasifier to a combustion system helps in the utilization of a variety of biomass sources with large variations in properties. Once the syngas has been cleaned, it can be fed to gas engines, fuel cells, or gas turbines for power generation.
Syngas may also be used to produce hydrogen. When biomass is gasified, a mixture of H2, CO, CH4, and CO2 is produced. Further reaction to hydrogen can be done using water reforming and water-gas shift reactions:
Water reforming reaction for CH4 to H2:
Water-gas shift reaction for CO to H2 (as shown earlier):
Carbon dioxide may also be removed, as it is typically an undesirable component. One method to keep it from going into the atmosphere is to do chemical adsorption:
Syngas can also be utilized for the Fischer-Tropsch synthesis of hydrocarbon fuels. Variable chain-length hydrocarbons can be produced via a gas mixture of CO and H2 using the Fischer-Tropsch method. The reaction for this is:
In order for the reaction to take place, the ratio should be close to 2:1, so gases generated via gasification may have to be adjusted to fit this ratio. Inert gases also need to be reduced, such as CO2, and contaminants such as H2S, as the contaminants may lower catalyst activity.
Methanol and dimethyl ether can also be produced from syngas. The reactions are:
Dimethyl ether (DME) can be made from methanol:
Syngas can also be fermented to produce bio-based products. This will be discussed in detail in a later lesson.
3.4 Assignments Overview
3.4 Assignments OverviewHomework #1
Download and complete Homework #1. It contains questions that pertain to this lesson's course material. Convert to pdf format. Be sure to show your work! When you are finished, upload your completed assignment to Homework#1 Dropbox in Canvas. Use the following naming convention for your assignment: your user ID_HW1 (i.e., ceb7_HW1).
3.5 Summary and Final Tasks
3.5 Summary and Final TasksSummary
There are several potential crops that can be utilized for combustion and gasification. These include energy crops, crop residues, forest residues, and process wastes. These can be utilized in both combustion processes and gasification processes. For gasification, we looked at several factors:
- gasification process and chemistry
- gasifier design and operation
- syngas cleaning
- syngas utilization to make a variety of products
Biobased energy and chemical products discussed in the lesson include:
- heat and power
- hydrogen
- F-T hydrocarbon fuels
- alcohols
- biochemical and biopolymers.
Lesson Objectives Review
By the end of this lesson, you should be able to:
- explain how wood was used historically to produce heat and electricity;
- evaluate the difference between combustion and gasification, and explain how design features differ depending on the process;
- evaluate how pyrolysis is different from gasification;
- describe the utilization of products from gasification versus pyrolysis, including how the processing of products differs.
References
Schobert, H.H., Energy and Society: An Introduction, 2002, Taylor & Francis: New York, Ch. 4-6.
Wang, L., Biological Engineering, North Carolina A&T University, BEEMS Module C1, Biomass Gasification, sponsored by USDA Higher Education Challenger Program, 2009-38411-19761, PI on project Li, Yebo.
Questions?
If there is anything in the lesson materials that you would like to comment on, or don't quite understand, please post your thoughts and/or questions to our Throughout the Course Questions Comments discussion forum and/or set up an appointment for office hour. The discussion forum is checked regularly (Monday through Friday). While you are there, feel free to post responses to your classmates if you are able to help.
Lesson 4: Biomass Pyrolysis and Pretreatment
Lesson 4: Biomass Pyrolysis and PretreatmentLesson 4: Biomass Pyrolysis and Pretreatment Overview
This week’s lesson continues with thermal processes for biomass conversion, this time concentrating on pyrolysis; pyrolysis is heating material in an inert environment. In addition to providing an in-depth explanation of this process, this lesson will also discuss the various chemical structures found in biomass (essentially in lignocellulosic biomass) and pretreatments that are done to make the materials more amenable for fuel production.
Lesson Objectives
By the end of this lesson, you should be able to:
- explain how pyrolysis is different from gasification and combustion;
- explain how the products are made and used as fuels and chemicals;
- determine which thermal process is best to use depending on biomass source and product utilization;
- describe the basic chemical structures of biomass, namely lignocellulosic biomass;
- evaluate pretreatment options for lignocellulosic options and explain why they are necessary.
Lesson 4 Road Map
This lesson will take us one week to complete. Please refer to the Course Syllabus for specific time frames and assignment due dates.
Questions?
If there is anything in the lesson materials that you would like to comment on or don't quite understand, please post your thoughts and/or questions to our Throughout the Course Questions and Comments discussion forum. The discussion forum will be checked regularly. While you are there, feel free to post responses to your classmates if you are able to help. Regular office hours will be held to provide help for EGEE 439 students.
4.1 Biomass Pyrolysis
4.1 Biomass PyrolysisdifferencesThe figure below shows a graphic of the four methods of thermochemical conversion of biomass, with pyrolysis highlighted. We just went over combustion and gasification, and we’ll cover direct liquefaction later on in the semester.
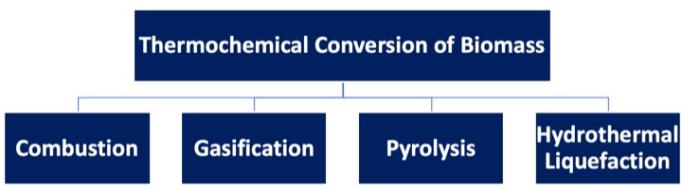
There are differences in each of the thermal processes. For combustion, the material is in an oxygen-rich atmosphere, at a very high operating temperature, with heat as the targeted output. Gasification takes place in an oxygen-lean atmosphere, with a high operating temperature and gaseous products being the main target (syngas production in most cases). Direct liquefaction (particularly hydrothermal processing) occurs in a non-oxidative atmosphere, where biomass is fed into a unit as an aqueous slurry at lower temperatures, and bio-crude in liquid form is the product.
So, what is pyrolysis? There are several definitions depending on the source, but essentially, it is a thermochemical process, conducted at 400-600°C in the absence of oxygen. The process produces gases, bio-oil, and a char, and as noted in Lesson 4, is one of the first steps in gasification or combustion. The composition of the primary products made will depend on the temperature, pressure, and heating rate of the process.
There are advantages, both economic and environmental, to doing pyrolysis. They are:
- utilization of renewable resources through a carbon-neutral differences route – environmental potential;
- utilization of waste materials such as lumber processing waste (barks, sawdust, forest thinnings, etc.), agricultural residues (straws, manure, etc.) – economic potential;
- self-sustaining energy – economic potential;
- conversion of low energy in biomass into high energy density liquid fuels – environmental & economic potentials;
- potential to produce chemicals from bio-based resources – environmental & economic potentials.
Pyrolysis was initially utilized to produce charcoal. In indigenous cultures in South America, the material was ignited and then covered with soil to reduce the oxygen available to the material – it left a high carbon material that could stabilize and enrich the soil to add nutrients ([Discussion of applications of pyrolysis], (n.d.), Retrieved from MagnumGroup.org). It has also been used as a lighter and less volatile source of heat for cooking (i.e., “charcoal” grills) in countries where electricity is not widely available and people use fuel such as this to cook with or heat their homes (Schobert, H.H., Energy, and Society: An Introduction, 2002, Taylor & Francis: New York). Not only is there a solid product, such as charcoal, but liquid products can also be produced depending on the starting material and conditions used. Historically, methanol was produced from the pyrolysis of wood.
This process for pyrolysis can also be called torrefaction. Torrefaction is typically done at relatively low pyrolysis temperatures (200-300°C) in the absence of oxygen. The feed material is heated up slowly, at less than 50°C/min, and is done over a period of hours to days – this way the volatiles are released and carbon maintains a rigid structure. In the first stage, water, which is a component that can inhibit the calorific value of a fuel, is lost. This is followed by a loss of CO, CO2, H2, and CH4 in low quantities. By doing this, approximately 70% of the mass is retained with 90% of the energy content. The solid material is hydrophobic (with little attraction to water) and can be stored for a long period of time.
Classification of pyrolysis methods
There are three types of pyrolysis: 1) conventional/slow pyrolysis, 2) fast pyrolysis, and 3) ultra-fast/flash pyrolysis. The table and figure below summarize how each method differs in temperature, residence time, heating rate, and products made.
As mentioned earlier, slow pyrolysis is typically used to modify the solid material, minimizing the oil produced. Fast pyrolysis and ultra-fast (flash) pyrolysis maximize the gases and oil produced.
Fast pyrolysis is a rapid thermal decomposition of carbonaceous materials in the absence of oxygen at moderate to high heating rates. It is the most common of the methods, both in research and in practical use. The major product is bio-oil. Pyrolysis is an endothermic process. Along with the information listed in the table, the feedstock must be dry; of smaller particles (< 3 mm); and typically done at atmospheric temperature with rapid quenching of the products. The yields of the products are: liquid condensates – 30-60%; gases (CO, H2, CH4, CO2, and light hydrocarbons) – 15-35%; and char – 10-15%.
Ultra-fast, or flash, pyrolysis is an extremely rapid thermal decomposition, with a high heating rate. The main products are gases and bio-oil. Heating rates can vary from 100 to 10,000° C/s, and residence times are short in duration. The yields of the products are: liquid condensate ~10 - 20%; gases – 60 - 80%; and char – 10 - 15%.

Accessible version of Classification of pyrolysis methods with differences in temperature, residence time, heating rate, and major products.
| Method | Temperature (°C) | Residence Time | Heating rate (°C/s) | Major products |
|---|---|---|---|---|
| Conventional/slow pyrolysis | Med-high 400-500 | Long 5-30 min | Low 10 | Gases Char Bio-oil (tar) |
| Fast pyrolysis | Med-high 400-650 | Short 0.5-2 s | High 100 | Bio-oil (thinner) Gases Char |
| Ultra-fast/flash pyrolysis | High 700-1000 | Very short < 0.5 s | Very high >500 | Gases Bio-oil |

Figure summarizing different pyrolysis conditions and the effect on product distribution.
| Heating rate | Time | Temperature (ºC) | Char | Liquid | Gas |
|---|---|---|---|---|---|
| Slow (<103 W/m2) | 1000s | ~500ºC | 25% | 35% | 40% |
| Medium (>104 W/m2) | 100s | ~500ºC | 17% | 58% | 35% |
| Fast (>105 W/m2) | 1s | ~500ºC | 15% | 65% | 20% |
| Flash (>106 W/m2) | 0.01s | ~500ºC | 10% | 70% | 20% |
| Slow (<103 W/m2) | 1000s | ~1000ºC | 40% | 35% | 25% |
| Medium (>104 W/m2) | 100s | ~1000ºC | 20% | 37% | 43% |
| Fast (>105 W/m2) | 1s | ~1000ºC | 15% | 20% | 65% |
| Flash (>106 W/m2) | 0.01s | ~1000ºC | 0% | 15% | 95% |
Bio-oil Product Properties
Crude bio-oils are different from petroleum crude oils. Both can be dark and tarry with an odor, but crude bio-oils are not miscible with petro-oils. Bio-oils have high water content (20-30%); their density is heavier than water (1.10-1.25 g/mL); their heating value is ~5600-7700 Btu/lb (13-18 MJ/kg). Bio-oils have high oxygen content (35-50%), which causes high acidity (pH as low as ~2). Bio-oils are also viscous (20-1000 cp @ 40°C) and have high solid residues (up to 40%). These oils are also oxidatively unstable, so the oils can polymerize, agglomerate, or have oxidative reactions occurring in situ which lead to increased viscosity and volatility. The values in the table below compare the properties of bio-oil to petroleum-based heavy fuel oil.
| Physical Property | Bio-oil | Heavy fuel oil |
|---|---|---|
| Moisture Content | 15-30 | 0.1 |
| pH | 2.5 | -- |
| Specific gravity | 1.2 | 0.94 |
| Elemental composition (wt%) | - | - |
| C | 54-58 | 85 |
| H | 5.5-7.0 | 11 |
| O | 35-40 | 1.0 |
| N | 0-0.2 | 0.3 |
| Ash | 0-0.2 | 0.1 |
| HHV, MJ/kg | 16-19 | 40 |
| Viscosity (cp, @50°C) | 40-100 | 180 |
| Solids (wt %) | 0.2-1 | 1 |
| Distillation residue (wt%) | Up to 50 | 1 |
Process Considerations
Several components are necessary for any pyrolysis unit, outside of the pyrolyzer itself. The units and how they are connected are shown in the figure below.

The goal of the process is to produce bio-oil from the pyrolyzer. The bio-oil that’s generated has potential as a transportation fuel after upgrading and fractionation. Some can be used for making specialty chemicals as well, especially ring-structure compounds that could be used for adhesives. The gases that are produced contain combustible components, so the gases are used to generate heat. A biochar is produced as well. Biochar can be used as a soil amendment that improves the quality of the soil, sequesters carbon, or can even be used as a carbon material as a catalyst support or activated carbon. There will also be a mineral-based material called ash once it’s been processed. Typically, the ash must be contained.
The next units to be considered are separation units. Char is solid, so it is typically separated using a cyclone or baghouse. It can be used as a catalyst for further decomposition into gases because the mineral inherent in the char as well as the carbon can catalyze the gasification reactions. The liquids and gases must also be separated. Usually, the liquids and gases must be cooled in order to separate the condensable liquids from the non-condensable gases. The liquids are then fractionated and will most likely be treated further to improve the stability of the liquids. At times, the liquid portion may plug due to heavier components. The non-condensable gases need to be cleaned of any trace amounts of liquids and can be reused if needed.
The next consideration is the heat sources for the unit. Hot flue gas is used to dry the feed. As the flue gas contains combustible gases, they can be partially combusted to provide heat. Any char that is left over is burned as a major supply of heat. And, biomass can be partially burned as another major source of heat.
Another important process to consider is the means of heat transfer. Much of it is indirect, through metal walls and tube and shell units. Direct heat transfer has to do with char and biomass burning. In the fluidized bed unit, the carrier (most often sand) brings in the heat, as the carrier is heated externally and recycled to provide heat to the pyrolyzer.
Types of Pyrolyzers
So, what types of pyrolyzers are used? The more common types are fluidized-bed pyrolyzers. The figures below show schematics of two different types. The advantages of using fluid beds are uniform temperature and good heat transfer; high bio-oil yield of up to 75%; a medium level of complexity in construction and operation; and ease of scaling up. The disadvantages of fluid beds are the requirement for small particle sizes; a large quantity of inert gases; and high operating costs. The circulating fluid bed pyrolyzer, (CFB), shown below, has similar advantages, although medium-sized particle sizes for feed are used. Disadvantages include a large quantity of heat carriers (i.e., sand); more complex operation, and high operating costs.
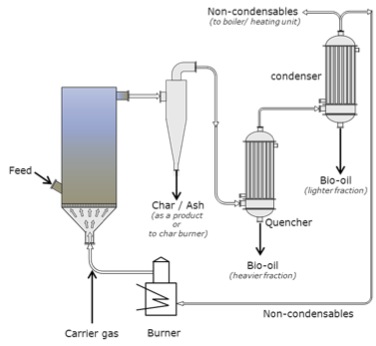
Fluid-bed with electrostatic precipitator.
Schematic of a fluid bed with electrostatic precipitator. The carrier gas enters the fluid bed that has an intake feed. The gas then goes through a cyclone and the char and ash are removed as a product or taken to the char burner. The gas then passes through the quencher and the heavier fraction is removed as bio-oil, it then passes to the condenser where the lighter fraction is condensed as bio-oil and the non-condensable are taken to the boiler or the burner. Any gases created at the burner are used as carrier gas.
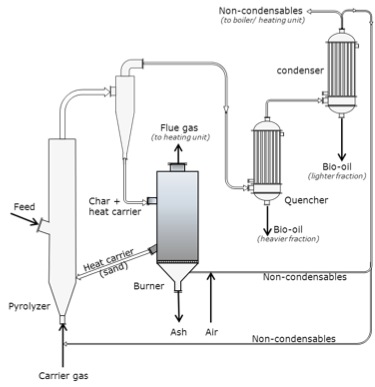
Fluidized bed with circulating heat carrier (circulating fluid-bed (CFB) pyrolyzers).
Schematic of a fluid-bed with circulating heat carrier (circulating fluid-bed (CFB) pyrolyzers. The carrier gas enters the bottom of the fluid bed through a pyrolyzer. The fluid bed also has an intake feed halfway up. The gas then goes through a cyclone and the char and heat carriers are removed and taken to a burner. The heat carriers (sand) are returned to the fluid bed/pyrolyzer. The ash is removed and flue gas is taken to the heating unit. The gases that come out of the cyclone then pass through the quencher and the heavier fraction is removed as bio-oil, it is then passed to the condenser where the lighter fraction is condensed as bio-oil, and the non-condensable is taken to the boiler or the burner. Any gases created at the burner are used as carrier gas.
Two other types of pyrolyzers are the Rotating Cone and the Auger pyrolyzers. The rotating cone creates a swirling movement of particles through a g-force. This type of pyrolyzer is compact, has a relatively simple construction and operation, and has a low heat carrier/sand requirement. However, it has a limited capacity, requires feed to be fine particles, and is difficult to scale up. Auger pyrolyzers are also compact, simple in construction, and easy to operate; they function at a lower process temperature as well (400 °C). The disadvantages of Auger pyrolyzers include long residence times, lower bio-oil yields, high char yield, and limits in scaling up due to heat transfer limits.

Rotating cone pyrolyzer.
Schematic of a rotating cone pyrolyzer. The cone has feed at the bottom and heat is applied to the outside walls of the cone. A motor spins the cone and the gas/condensables come out the top as does the char/ash.
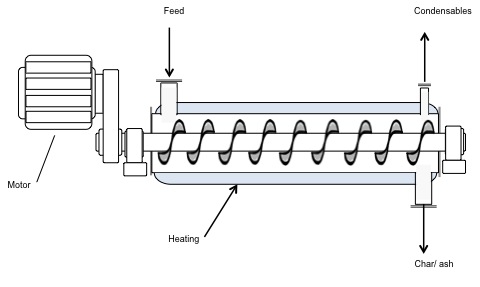
Auger pyrolyzer.
Schematic of an Auger pyrolyzer. The diagram looks like a cylinder with a corkscrew inside. A motor is attached to the rotating corkscrew. The walls of the cylinder are heated and at one end there is a feed. On the other end, there are outtake ports for condensables to come out the tops and char/ash to come out the bottom.
Bio-Oil Upgrading
As noted earlier, bio-oil has issues and must be upgraded, which means essentially processed to remove the problems. These problems include high acid content (which is corrosive), high water content, and high instability both oxidatively and thermally (which can cause unwanted solids formation).
The oils must be treated physically and chemically. Physical treatments include the removal of char via filtration and emulsification of hydrocarbons for stability. Bio-oils are also fractionated, but not before chemical treatments are done. The chemical treatments include esterification (a reaction with alcohol to form esters – this will be covered in detail when discussing biodiesel production); catalytic de-oxygenation/hydrogenation to remove oxygen and double bonds; thermal cracking for more volatile components; physical extraction; and syngas production/gasification.
Catalytic de-oxygenation/hydrogenation takes place. A catalyst is used along with hydrogen gas; specialty catalysts are used, such as sulfides and oxides of nickel, cobalt, and molybdenum. Hydrogenation is commonly used in petroleum refining for the removal of sulfur and nitrogen from crude oil and to hydrogenate the products where double bonds may have formed in processing. Catalytic processes are separate processes and use specific equipment to perform the upgrading. One problem can be that there may be components of bio-oil that may be toxic to catalysts.
Esterification reacts to the corrosive acids in bio-oils with alcohol to form esters. An ester is shown below. A discussion of the esterification reaction will be discussed in the biodiesel lesson.
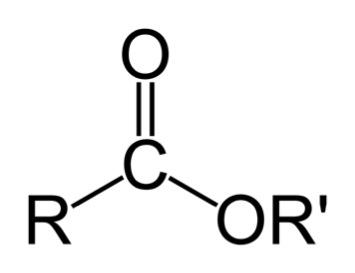
Bio-oil can also be thermally cracked and/or made into syngas through gasification. Please refer to Lesson 2 for the thermal cracking discussion and Lesson 4 for the gasification discussion. One other process that can be utilized is physical extraction, although extraction takes place due to the affinity of some of the compounds to a particular fluid. One example is the extraction of phenols. Phenols can be extracted using a sodium solution such as sodium hydroxide in water; the phenolic compounds are attracted to the sodium solution, while the less oxygenated compounds will stay in the organic solution. Again, this will be discussed in more detail in later lessons. The figure below shows a schematic of a typical processing unit to upgrade bio-oil.
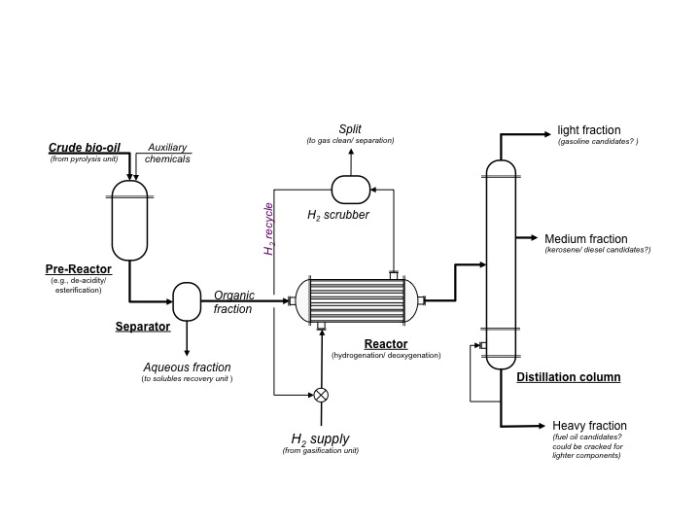
Schematic of a typical processing unit to upgrade bio-oil.
Schematic of a typical processing unit to upgrade bio-oil. Crude bio-oil and auxiliary chemicals ender the pre-reactor which does things such as de-acidify or esterify. From the pre-reactor, the crude bio-oil goes to the separator. The aqueous fraction is removed and goes to the solubles recovery unit. The organic fraction goes to the reactor where hydrogen gas is pumped in to do hydrogenation and deoxygenation. The gases are removed to a hydrogen scrubber which cleans and separates the gases. The hydrogen gas is recycled. The bio-oil then goes to a distillation column. The heavy fraction is a fuel oil candidate and could be cracked for lighter components. The medium fraction can become kerosene or a diesel candidate. The lightest fraction can become a gasoline candidate.
Biomass Pretreatment
Current methods of generating biofuels are primarily from starch or grain, and starch hydrolysis is fairly straightforward. However, because the starch feedstocks are typically food-based, the goal is to develop technologies to produce ethanol from cellulose; cellulose is obtained from lignocellulosic biomass sources and must be pretreated before breaking down into ethanol. Below is a schematic of the differences in processing for starch (current) and cellulose (emerging). Before we go any further, we will have a short tutorial on the various components of lignocellulosic biomass.
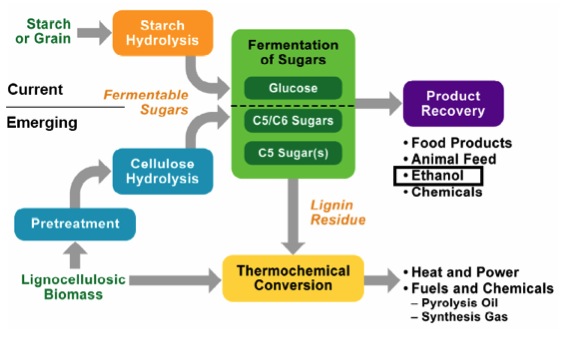
Schematic of processing differences for cellulose and starch.
Schematic of processing differences for cellulose and starch. For starch or grain, it goes through starch hydrolysis and then the fermentation of glucose to recover the final product. The final products are food products, animal feed, ethanol, and chemicals.
For cellulose (lignocellulosic biomass) it must go through a pretreatment before entering cellulose hydrolysis and then the fermentation of carbon 5 and 6 sugars to recover the final products. The final products are food products, animal feed, ethanol, and chemicals. Any lignin residue goes through thermochemical conversion to become heat and power, and fuels and chemicals: pyrolysis oil and synthesis gas.
4.2 Biomass Carbohydrate Tutorial
4.2 Biomass Carbohydrate TutorialWhen the word carbohydrate is used, I typically think of the carbohydrates in food. Carbohydrates are the sugars and complex units composed of sugars. This section will describe each.
Sugars are also called saccharides. Monomer units are single units of sugars called monosaccharides. Dimer units are double units of sugars called disaccharides. Polymers contain multiple units of monomers and dimers and are called polysaccharides.
So, what are typical monosaccharides? They are made up of a molecule that is in a ring structure with carbons and oxygen. The first figure below shows the structure of glucose; it is made up of C6H12O6. Glucose is distinguished by its structure: five carbons in the ring with one oxygen; CH2OH attached to a carbon; and OH and H groups attached to the other carbons. This sugar is known as blood sugar and is an immediate source of energy for cellular respiration. The second figure shows galactose next to glucose, and we can see that galactose is almost like glucose, except on the No. 4 carbon the OH and H are an isomer and just slightly different (highlighted in red on the galactose molecule). Galactose is a sugar monomer in milk and yogurt. The third figure shows fructose; while it still has a similar chemical formula as glucose (C6H12O5), it is a five-membered ring with carbons and oxygens, but two CH2OH groups. This is a sugar found in honey and fruits.

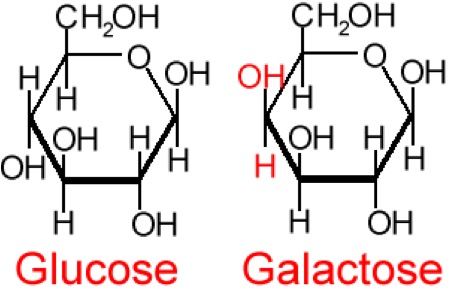

We also have disaccharides as sugars in food. Disaccharides are dimers of the monomers we just discussed and are shown below. One of the most common disaccharides is sucrose, which is a common table sugar and is shown in the figure below. It is a dimer of glucose and fructose. Another common sugar dimer is lactose. It is the major sugar in milk and a dimer of galactose and glucose. Maltose is also a sugar dimer but is a product of starch digestion. It is a dimer made up of glucose and glucose. In the next section, we will discuss what starch and cellulose are composed of in order to see why maltose is a product of starch digestion.

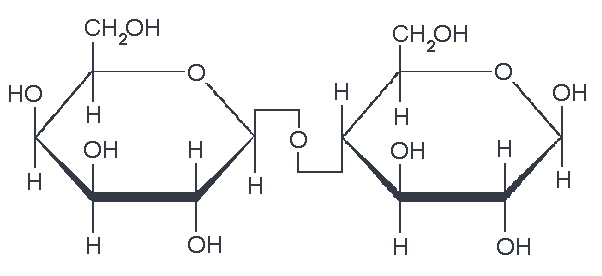

Carbohydrate structure
All carbohydrate polymers are monomers that connect with what is called a glycosidic bond. For example, sucrose is a dimer of glucose and fructose. In order for the bond to form, there is a loss of H and OH. So, another way to show this is:
C12H22O11 = 2 C6H12O6 − H2O
And as dimers can form, polymers will form and are called polysaccharides. Typical polysaccharides include 1) glycogen, 2) starch, and 3) cellulose. Glycogen is a molecule in which animals store glucose by polymerizing glucose, as shown below.

Starches are similar to glycogen, with a slightly different structure. Starch is composed of two polymeric molecules, amylose and amylopectin. The structures of both are shown below.

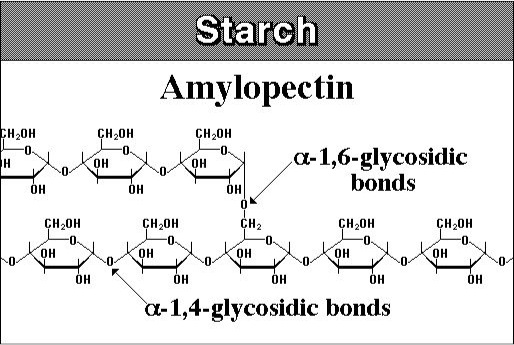
About 20% of starch is made up of amylose and is a straight chain that forms into a helical shape with α-1,4 glycosidic bonds and the rest of the starch is amylopectin, which is branched with α-1,4, and α-1,6 glycosidic bonds. The figure below shows the structure of cellulose. Cellulose is a major molecule in the plant world; it is also the single most abundant molecule in the biosphere. It is a polymer of glucose and has connectors of the glucose molecule that are different from starch; the linkages are β-1,4 glycosidic bonds. The polymer of cellulose is such that it can form tight hydrogen bonds with oxygen, so it is more rigid and crystalline than starch molecules. The rigidity makes it difficult to break down.
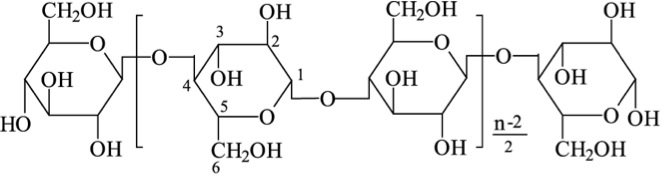
4.3 Pretreatment of Lignocellulosic Biomass
4.3 Pretreatment of Lignocellulosic BiomassWhen the word carbohydrate is used, I typically think of the carbohydrates in food. Carbohydrates are the sugars and complex units composed of sugars. This section will describe each.
Sugars are also called saccharides. Monomer units are single units of sugars called monosaccharides. Dimer units are double units of sugars called disaccharides. Polymers contain multiple units of monomers and dimers and are called polysaccharides.
So, what are typical monosaccharides? They are made up of a molecule that is in a ring structure with carbons and oxygen. The first figure below shows the structure of glucose; it is made up of C6H12O6. Glucose is distinguished by its structure: five carbons in the ring with one oxygen; CH2OH attached to a carbon; and OH and H groups attached to the other carbons. This sugar is known as blood sugar and is an immediate source of energy for cellular respiration. The second figure shows galactose next to glucose, and we can see that galactose is almost like glucose, except on the No. 4 carbon the OH and H are an isomer and just slightly different (highlighted in red on the galactose molecule). Galactose is a sugar monomer in milk and yogurt. The third figure shows fructose; while it still has a similar chemical formula as glucose (C6H12O5), it is a five-membered ring with carbons and oxygens, but two CH2OH groups. This is a sugar found in honey and fruits.
We also have disaccharides as sugars in food. Disaccharides are dimers of the monomers we just discussed and are shown below. One of the most common disaccharides is sucrose, which is a common table sugar. It is a dimer of glucose and fructose. Another common sugar dimer is lactose. It is the major sugar in milk and a dimer of galactose and glucose. Maltose is also a sugar dimer, but is a product of starch digestion. It is a dimer made up of glucose and glucose. In the next section, we will discuss what starch and cellulose are composed of in order to see why maltose is a product of starch digestion.
Carbohydrate structure
All carbohydrate polymers are monomers that connect with what is called a glycosidic bond. For example, sucrose is a dimer of glucose and fructose. In order for the bond to form, there is a loss of H and OH. So, another way to show this is:
There is a wide variety of sources for lignocellulosic biomass, which includes agricultural waste (i.e., corn stover), forest waste from furniture and home construction, municipal solid waste, and energy crops. They all look very different, but all are composed of cellulose, hemicellulose, lignin, and other minor compounds. The figure below shows switchgrass (with parts magnified to emphasize different parts of the plant structure). Once you get down to the microfibril structure, you can see the components of the microfibril, which include lignin on the outside layer, hemicellulose on the next layer, and finally, cellulose. Because of the structure, the lignocellulose is difficult to break down, which is known as recalcitrance. In order to get to the cellulose, the cell wall has to be opened up, the lignin has to be removed or separated from the hemicellulose and cellulose, and then the cellulose, crystalline in nature, has to be broken down. All these steps are resistant to microbial attack, so pretreatment methods are used to break it apart. In other words, biomass recalcitrance requires pretreatment.

The image is a scientific diagram illustrating the structure and composition of cellulose in plant cells. It begins with a depiction of plant cells, highlighting the cell wall, which is the primary location of cellulose.
A magnified section of the cell wall reveals a layered mesh of microfibrils, which are bundles of cellulose chains. These microfibrils are shown in greater detail, illustrating how they are composed of tightly packed cellulose molecules.
The diagram further breaks down the cellulose molecule into its basic building blocks, showing repeating units of glucose and cellobiose. It also includes a representation of crystalline cellulose, where the cellulose chains are aligned in a highly ordered structure, contributing to the strength and rigidity of the plant cell wall.
Overall, the image provides a clear and detailed view of how cellulose is organized from the molecular level up to its role in the plant cell wall, emphasizing its structural importance in plant biology.
Another Perspective
You can access the following online journal article to see another illustration of lignocellulose but with the lignin component included (Figure 1):
Pretreatment is the most costly step; however, the only process step more expensive than pretreatment is no pretreatment. Without pretreatment, yields are low and drive up all other costs, more than the amount saved without pretreatment. Increased yields with pretreatment reduces all other unit costs. Below is a schematic of the role pretreatment plays. Pretreatment, depending on the method, will separate the lignin, the hemicellulose, and the cellulose. The schematic shows how these break apart. Part of the lignin and the hemicellulose are dissolved in liquid during hydrolysis, and part of the lignin and the cellulose are left as a solid residue. There is a partial breakdown of the polymeric molecules, and the cellulose is now more accessible to microbial attack.

Pretreatment is costly and affects both upstream and downstream processes. On the upstream side, it can affect how the biomass is collected or harvested, as well as the comminution of the biomass. Downstream of pretreatment, the enzyme production can be affected, which in turn will affect the enzymatic hydrolysis and sugar fermentation. Pretreatment can also affect hydrolyzate conditioning and hydrolyzate fermentation. The products made and the eventual final processing also will be affected by pretreatment. However, it is more costly to not do pretreatment.
There are two different types of pretreatment. Physical effects disrupt the higher-order structure and increase surface area and chemical/enzyme penetration into plant cell walls, including mechanical size reduction and fiber liberation. Chemical effects include solubilization, depolymerization, and breaking of crosslinks between macromolecules. The individual components can “swell," depending on the organic solvent or acid used. Lignin can be “redistributed” into a solution, and lignin and carbohydrates can be depolymerized or modified chemically.
The following pretreatment technologies will be discussed in more depth: 1) size reduction, 2) low pH method, 3) neutral pH method, 4) high pH method, 5) organic solvent separation, 6) ionic liquid separation, and 7) biological treatments.
4.3a Size Reduction
4.3a Size ReductionSize reduction is also known as comminution. Decreasing particle size of biomass improves accessibility to plant cell wall carbohydrates for chemical and biochemical depolymerization. It can also increase the bulk density for storage and transportation. There is a cost of energy when using mechanical size reduction. For example, 20-40 kWh/metric tons are needed to reduce the size of hardwood chips to coarse particles of 0.6-2.0 mm in size, and kWhs typically have a cost of anywhere from $0.04-0.10 per kWh. To reduce the size of particles to a fine size (0.15-0.30 mm), 100-200 kWh/ton is required.
There are multiple methods used to reduce the size of particles, and the method used will depend on whether the sample is dry or wet. There are hammer mills (a repetitive hammering of the sample), knife mills (a rotating knife slices the sample), and ball mills (the sample is put into a container with metal balls and rolled). Sometimes the sample has to be shredded and dried before using some of these techniques.
Samples can also be “densified.” Samples can be mixed with some sort of binder (to keep the materials together, like glue) and pushed into shape, or pelletized. This increases the bulk density (i.e., from 80-150 kg/m3 for straw or 200 kg/m3 for sawdust to 600-700 kg/m3 after densification). This can lower transportation costs, reduce the storage volume, and make handling easier. After densification, the materials usually have lower moisture content.

4.3b Low pH Methods
4.3b Low pH MethodsThe mechanism for low pH treatments is the hydrolysis of hemicellulose. Hydrolysis is a reaction with water, where acid is added to the water to accelerate the reaction time. Several acids can be used, including dilute sulfuric acid (H2SO4), gaseous sulfur dioxide (SO2), hydrochloric acid (HCl), phosphoric acid (H3PO4), and oxalic acid (C2H2O4). Because it is a reaction, the key parameters affecting it include temperature, time, acid concentration, and moisture content of the biomass. The following reactions can take place: hemicellulose can be solubilized, lignin can be separated, acetyl groups are removed, and the surface of the biomass becomes more accessible. As an example, the α-1,4 bond is broken by the water and acid to yield two glucose units. An enzyme, amylase, can also promote the reaction. The addition of acid and elevated temperature increases the rate of reaction.

Not only is acid used to facilitate hydrolysis, but acid-catalyzed dehydration of sugars can form furans, which can break down into organic acids such as formic acid and levulinic acid. These compounds can be toxic to the enzymes that are used in sugar fermentation. So after the reaction, the residual acid must be neutralized, and inhibitors formed or released during pretreatment must be reduced. Two methods are to use calcium oxide (also known as overliming) or ammonium hydroxide.
Calcium oxide is cheap, forms gypsum during the process, and has a loss of sugar of ~10%, with the necessity of by-product removal and disposal. The reaction is shown below in Reaction 1.
The advantage of using ammonium hydroxide is that less sugar is lost and less waste is generated, but the cost is higher. The reaction is shown below in Reaction 2.
The figures below show process diagrams of typical configurations and reaction conditions for sulfuric acid and SO2.

Schematic of sulfuric acid pretreatment process.*
Schematic of sulfuric acid pretreatment process. Biomass is added to dilute sulfuric acid, called acid impregnation (0.5 – 5.0% H2SO4) it then goes to dilute acid pretreatment around (140-200 C). This pretreatment can take seconds to hours. It then becomes a slurry which goes into neutralization conditioning. The solids go to enzymatic hydrolysis where hexose sugars and solid residue (lignin) are separated. The liquids from the neutralization condition go to acid post-hydrolysis. The slurry can also go to solid/liquid separation. The solid products of this separation go to neutralization condition and the liquids go to acid post-hydrolysis. Acid post-hydrolysis yields pentose sugars.

Schematic of sulfur dioxide pretreatment process.*
Schematic of sulfur dioxide pretreatment process. Biomass with water undergoes biomass humidification (50%-70% M.C.) and then it undergoes SO2 impregnation (1-5%) and finally a steam explosion (180-210 C). This pretreatment can take seconds to minutes. It then becomes a slurry which goes into neutralization conditioning. The solids go to enzymatic hydrolysis where hexose sugars and solid residue are separated. The liquids from the neutralization conditioning go-to acid post-hydrolysis. The slurry can also go to solid/liquid separation. The solid products of this separation go to neutralization conditioning and the liquids go to acid post-hydrolysis. Acid post-hydrolysis yields pentose sugars.
4.3c Neutral pH Pretreatment
4.3c Neutral pH PretreatmentPretreatment can also take place in neutral pH water. There are two pathways that can occur. One is when acidic compounds are released from acetylated hemicellulose, mainly acetic acid. This is also called autohydrolysis. Water can also dissociate as the temperature and pressure increase to near the supercritical point (approximately 374°C, 3200 psi), into H+ and OH−, and as this happens, the water behaves like an acid/base system. It is done in water without added chemicals, either in liquid hot water, steam explosion, or water near the supercritical point. The key parameters are time, temperature, and moisture content, and the effects are similar to low pH methods. A schematic for liquid hot water processing is shown in the figure below.
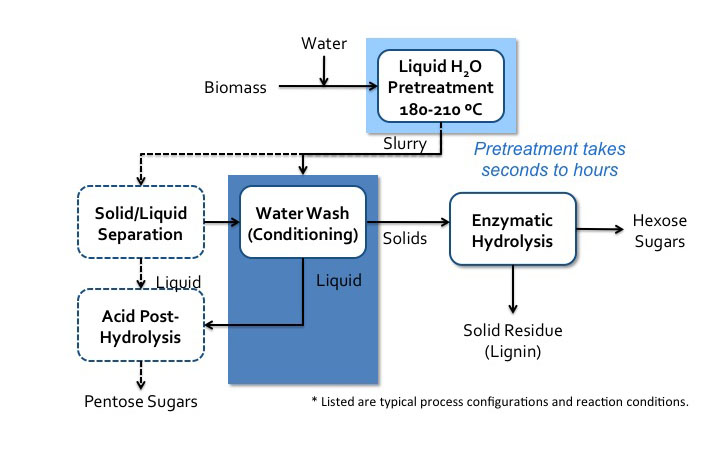
Liquid hot water process flow diagram*.
Schematic of liquid hot water processes flow diagram. Biomass is added to water and sent to liquid H2O pretreatment (180-210 C). Pretreatment can take seconds to hours. It then becomes a slurry which goes into water wash conditioning. The solids go to enzymatic hydrolysis where hexose sugars and solid residue (lignin) is separated. The liquids from the water wash conditioning go to acid post-hydrolysis. The slurry can also go to solid/liquid separation. The solid products of this separation go to water wash conditioning and the liquids go to acid post-hydrolysis. Acid post-hydrolysis yields pentose sugars.
One process, developed by Inbicon, is a counter-current multi-stage hot water pretreatment process. There is a pilot-scale unit at Skærbæk, Denmark. It is a three-stage process using hot water (hydrothermal) at 80°C, 160-200 °C, and 190-230°C. After the first stage, a liquid composed of C5 molasses (sugar) is taken out of the process, which is used for animal feed. After the third stage, the fiber fraction contains cellulose and lignin. Bioethanol and solid fuel for heat and power are produced when using enzymes, yeast, and fermentation. The figure below shows the before and after pretreatment of wheat straw (the raw wheat straw and the cellulosic-lignin portion).

The next pretreatment processes to discuss are at high pH. The high pH removes the lignin portion of biomass through the breaking of ether linkages (R-O-R’) that hold aromatic phenolic compounds together; ring opening can also take place. It is a depolymerization process. There are several processes and bases used, including lime, calcium carbonate, potassium hydroxide, sodium hydroxide, and aqueous ammonia. Key parameters include temperature, reaction time, concentration of base, moisture of the feed material, as well as oxidizing agents. The effects include the removal of most of the lignin, some removal of hemicellulose, and the removal of acetyl links between lignin and hemicellulose.
Lignin is most prominent in grasses and woody biomass. It composes 6-35% of lignocellulosic biomass, depending on the type of grass or wood. Lignin is comprised of crosslinked, branched, monoaromatic units with methoxy and propyl alcohol functional groups. These are shown in the first figure below. The second figure below shows a model of a lignin molecule and how the aromatic monomers are linked together.


4.3d High pH (Alkaline) Pretreatment
4.3d High pH (Alkaline) PretreatmentThere are two possible outcomes for the chemistry behind the high pH treatment: 1) one is essentially a degradation reaction that liberates lignin fragments and leads to lignin dissolution, and 2) the other is condensation reactions that increase the molecular size of lignin fragments and result in lignin precipitation. As you can see, lignin is a complicated molecule, with a variety of linkages, so reactions are complicated due to lignin complexity. The addition of oxidizing agents greatly improves delignification.
There are multiple processes that have been developed for this type of treatment. The first figure below shows the lime pretreatment process flow diagram. The pretreatment can be done under various conditions, such as oxidative and non-oxidative conditions, short-term high temperature (100-200°C, 1-6 h), and long-term low temperature (25-65°C, 1-8 weeks). The second figure below shows the soaking in aqueous ammonia (SAA) process flow diagram.
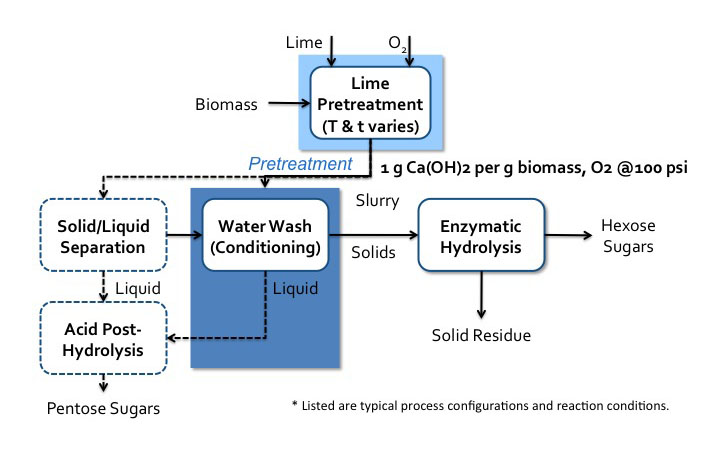
Lime pretreatment process flow diagram*.
Biomass enters a lime pretreatment with lime and oxygen gas. The temperatures and time of this process vary. The is about 1g of Ca(OH)2 per 1g of biomass the oxygen gas is at 100psi. After pretreatment, the biomass becomes a slurry that goes into water wash conditioning. The solids go to enzymatic hydrolysis where hexose sugars and solid residue (lignin) are separated. The liquids from the water wash conditioning go-to acid post-hydrolysis. The slurry can also go to solid/liquid separation. The solid products of this separation go to water wash conditioning and the liquids go to acid post-hydrolysis. Acid post-hydrolysis yields pentose sugars.

Soaking in aqueous ammonia (SAA) process flow diagram*.
Biomass is soaked in aqueous ammonia at 120-180 C. This pretreatment can take minutes to hours. The biomass then goes to post-washing with water and counter-current leaching. The solids go to enzymatic hydrolysis where hexose sugars and the solid residue are separated. The liquids go-to acid post-hydrolysis which removes the pentose sugars and lignin. This also removes the dilute. NH3 which is recycled.
One of the more developed high-pH processes is the ammonia fiber expansion (AFEX) process. Lignocellulosic biomass is soaked in liquid ammonia (causing swelling) followed by the rapid release of pressure (causing expansion). Anhydrous liquid ammonia is used, and key parameters include temperature, residence time, ammonia concentration, and moisture content of the biomass. During this process, there is virtually no compositional change, but lignin is relocated, cellulose is decrystallized, and hemicellulose is depolymerized. This method increases the size and number of micropores in the cell wall to allow for greater accessibility of chemicals for the following stages of processing. A process schematic is shown below.

AFEX process flow diagram*.
Biomass is added with ammonia to AFEX pretreatment (60-160 C). Pretreatment can take minutes to hours. The ammonia is recycled and the solids go to enzymatic hydrolysis where sugars and the solid residue are separated. Before enzymatic hydrolysis, there is an option post-washing step. The solids go into a water wash conditioning and then solid/liquid separation. The solids go into enzymatic hydrolysis and the liquids go to acid post-hydrolysis which yields pentose sugars.
4.3e Organic Solvation Processes
4.3e Organic Solvation ProcessesThe next process type is using an organic solvent, such as the Organosolv (OS) process or the Cellulose solvent- and Organic Solvent-based LIgnocellulose Fractionation (COSLIF) process. For OS pretreatment, the main mechanism involves the dissolution of lignin by organic solvent and then re-precipitation by adding an antisolvent, such as acidified water. This method was first introduced as a pulping method for papermaking. The organic solvents commonly used are acetone, ethanol, methanol, etc., in an aqueous solution of 20-60% water. Key parameters include temperature, residence time, chemical addition, and water concentration. The effect is to: separate lignin from lignocellulosic biomass; solubilize hemicellulose; and increase pore size and surface area in the cell wall. Below is a schematic of a process diagram for OS pretreatment.

Organosolv (OS) process flow diagram*.
Biomass, water, 60% ethanol, and 1.25% H2SO4 undergo Organosolv pretreatment at 180 C for 60 minutes. After pretreatment, it goes to filtration, and the solids go to washing with water/ethanol to remove the pulp (cellulose). The liquids head to lignin precipitation which separates the lignin and the water soluble sugars. Any remaining ethanol is recycled.
Another organic solvent-based process is cellulose-solvent and organic-solvent lignocellulose fractionation (COSLIF). For this process, an organic solvent is introduced to dissolve cellulose prior to Organosolv processing. Below is a schematic of COSLIF processing.

Cellulose-solvent and organic-solvent lignocellulose fractionation (COSLIF) diagram and resulting effects.
The raw material enters the digester with H3PO4 at 50 C. It then goes to the precipitation tank where it is treated with acetone. The material then enters washer 1 where it is treated with acetone where the black liquor is removed and goes to the distiller. The remaining material enters washer 2 where it is treated with water and the light liquor is removed and goes to the flash tank. All remaining material goes to the hydrolysis tank (50 C) and glucose is removed.
Black liquor: In the distiller acetone, acetic acid, and H3PO4 are removed and low MW lignin is extracted.
Light Liquor: In the flash tank, CaCO3 is added and acetone and H3PO4 are removed. Hemicellulose is extracted.

4.3f Ionic Liquids
4.3f Ionic LiquidsOne of the more usual methods of pretreatment of biomass uses ionic liquids. Ionic liquids (ILs) are organic salts that usually melt below 100°C and are strong solvation agents. A common salt that we are all familiar with is table salt, sodium chloride, NaCl. If dissolved in water, it separates into the ions of Na+ and Cl-, but it is not an organic salt like ILs. It has interesting properties, including the fact that, depending on the IL, it can solubilize whole cellulosic biomass or selectively dissolve components, e.g., lignin and cellulose. It is relatively easy to separate the dissolvent component from the organic salt by using an anti-solvent such as water, methanol, or ethanol. When cellulose has been dissolved in organic liquid and then re-precipitated by an anti-solvent, cellulose is less crystalline and easier to break down. Unfortunately, this is still a costly method of pretreatment, as there is difficulty in recycling ILs, and the ILs can be toxic to the enzymes and microbes used in processing cellulose to ethanol. One such IL is known as EmimAc (1-ethyl-3-methylimidazolium acetate), and is able to completely solubilize both cellulose and lignin in switchgrass. The first figure below shows the chemical structure of EmimAc and the change in cellulose after reprecipitation using an antisolvent (T = 120°C). The second figure below shows a schematic of the process diagram.

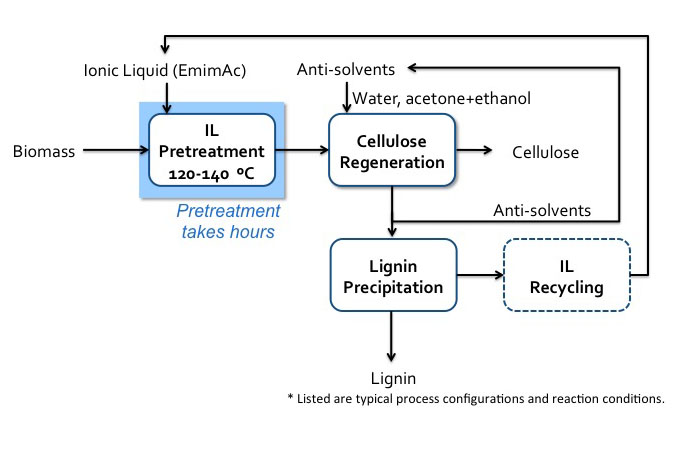
Schematic of IL (EmimAc) pretreatment flow diagram.
Biomass enters IL pretreatment (120-140 C) with EmimAC. This pretreatment takes hours. After pretreatment the products head to cellulose regeneration which washes the products with anti-solvents (water, acetone+ethanol). The cellulose is extracted, and the remaining products go into lignin precipitation which precipitates the lignin and recycles the anti-solvents and IL.
4.3g Biological Pretreatment
4.3g Biological PretreatmentThe last technology we will look at is biological pretreatment. Lignin is removed from lignocellulosic biomass through lignin-degrading microorganisms. Key parameters are temperature, cultivation time, nutrient addition, and selectivity on lignin. Some of the lignin-degrading enzymes include lignin peroxidase, manganese peroxidase, laccase, and xylanase. Advantages to using a system such as this include: no chemicals, mild conditions (ambient temperature and pressure), low energy and low capital outlay, and less enzyme use later on. However, pretreatments take days to weeks, loss of cellulose and hemicellulose, contaminants, and additional pretreatment for higher sugar yield.
4.3h Summary
4.3h SummaryOf the methods we’ve discussed, there are pretreatment options that lead the others (some under commercialization). The current leading pretreatment options include dilute acid, AFEX, liquid hot water, lime, and aqueous ammonia, with dilute acid and water, AFEX, and lime under commercialization. The figure below shows switchgrass before pretreatment and after several pretreatment options, i.e., AFEX, dilute acid, liquid hot water, lime, and soaking in aqueous ammonia (SAA).

The Resulting Switchgrass Solids after Different Pretreatment Technologies.
The image displays six samples of switchgrass, each subjected to a different pretreatment method, arranged side by side for visual comparison. The samples are labeled from A to F, with each label corresponding to a specific treatment:
- A. Control – Untreated switchgrass, serving as the baseline for comparison.
- B. AFEX – Treated with Ammonia Fiber Expansion, a method used to enhance biomass digestibility.
- C. Dil. Acid – Treated with dilute acid, commonly used to break down hemicellulose and improve enzymatic access.
- D. LHW – Treated with Liquid Hot Water, a hydrothermal method that disrupts plant cell wall structure.
- E. Lime – Treated with calcium hydroxide (lime), which helps in delignification and cellulose exposure.
- F. SAA – Treated with Sulfite-Assisted Alkaline pretreatment, aimed at removing lignin and enhancing cellulose accessibility.
A scale bar in the bottom right corner indicates 5 mm, providing a reference for the size and physical changes in the switchgrass samples due to each treatment. The image highlights the visual differences in texture, color, and structure among the treated and untreated samples, which are important for evaluating the effectiveness of each pretreatment method in biofuel or biochemical production processes.
To summarize the methods of pretreatment, the table below shows some of these pretreatment methods and the major and minor effects on lignocellulosic biomass. All methods (AFEX, dilute acid, lime, liquid hot water, soaking aqueous ammonia, and treatment with SO2) affect increasing surface area, removing hemicellulose, and altering lignin structure. Only AFEX, lime, and SAA pretreatments remove lignin, and AFEX and SAA decrystallize cellulose.
| Pretreatment | Increases Accessible Surface Area | Decrystallizes Cellulose | Removes Hemicellulose | Removes Lignin | Alters Lignin Structure |
|---|---|---|---|---|---|
| AFEX | Major Effect | Major Effect | Minor Effect | Major Effect | Major Effect |
| Dilute Acid | Major Effect | - | Major Effect | - | Major Effect |
| Lime | Major Effect | Not Determined | Minor Effect | Major Effect | Major Effect |
| Liquid H2O | Major Effect | Not Determined | Major Effect | - | Minor Effect |
| SAA | Major Effect | Major Effect | Minor Effect | Major Effect | Major Effect |
| SO2 | Major Effect | - | Major Effect | - | Minor Effect |
This table shows the conditions for ideal pretreatment of lignocellulosic biomass for dilute acid, steam explosion, AFEX, and liquid hot water.
| Pretreatment Process | Dilute Acid | Steam Explosion | AFEX | Liquid Hot Water |
|---|---|---|---|---|
| Reactive Fiber | Yes | Yes | Yes | Yes |
| Particle Size Reduction Required | Yes | No | Nob | No |
| Hydrolyzate Inhibitory | Yes | Yes | No | Slightly |
| Pentose Recovery | Moderate | Low | High | High |
| Low-Cost Materials of Construction | No | Yes | Yes | Yes |
| Production of Process Residues | Yes | No | No | No |
| Potential for Process Simplicity | Moderate | High | Moderate | High |
| Effectiveness at Low Moisture Contents | Moderate | High | Very High | Not Known |
a Modified from (86); AFEX ratings from Bruce Dale (personal communication).
b For grasses, data for wood not available.
Credit: Lynd, 1996. Annual Rev. Energy Environ., 21: 403-465
4.4 Assignments Overview
4.4 Assignments OverviewExam #1
You will complete Exam #1.
4.5 Summary and Final Tasks
4.5 Summary and Final TasksSummary
Lesson 5 covered biomass pyrolysis and biomass pretreatment. Pyrolysis is a thermal treatment in the absence of oxygen and at lower temperature than gasification. The main products of interest are chars that are often used in combustion (with some of the undesirable components removed), and liquids that need to be processed further to remove oxygen functionality and add hydrogen.
The goal of pretreatment is to overcome biomass recalcitrance and improve conversion efficiency/economics. Mechanical size reduction is generally required. Several pretreatment technologies have been developed based on the use of different chemicals. They do the following:
- Low pH pretreatment: hemicellulose removal, acetyl removal, lignin solubilization and re-precipitation, increased surface area
- High pH pretreatment: lignin removal, acetyl removal, hemicellulose solubilization, increased surface area
- AFEX pretreatment: no compositional changes, lignin alternation, cellulose decrystallization, increased surface area
- Organosolv and IL: fractionation of lignin from cellulose and hemicellulose, increased surface area
Lesson Objectives Review
By the end of this lesson, you should be able to:
- explain how pyrolysis is different from gasification and combustion;
- explain how the products are made and used as fuels and chemicals;
- determine which thermal process is best to use depending on biomass source and product utilization;
- describe the basic chemical structures of biomass, namely lignocellulosic biomass;
- evaluate pretreatment options for lignocellulosic options and explain why they are necessary.
- References
Schobert, H.H., Energy and Society: An Introduction, 2002, Taylor & Francis: New York, Ch. 4-6.
He, Brian, Department of Biological and Agricultural Engineering, University of Idaho, BEEMS Module C2, Biomass Pyrolysis, sponsored by USDA Higher Education Challenger Program, 2009-38411-19761, PI on project Li, Yebo.
Shi, Jian, Hodge, D.B., Pryor, S.W., Li, Yebo, Department of Food, Agricultural, and Biological Engineering, The Ohio State University, BEEMS Module B1, Pretreatment of Lignocellulosic Biomass, sponsored by USDA Higher Education Challenger Program, 2009-38411-19761, PI on project Li, Yebo.
Reminder - Complete all of the Lesson tasks!
You have reached the end of the Lesson. Double-check the Road Map on the Lesson Overview page to make sure you have completed the activity listed there before you begin the next Lesson.
Questions?
If there is anything in the lesson materials that you would like to comment on, or don't quite understand, please post your thoughts and/or questions to our Throughout the Course Questions & Comments discussion forum. The discussion forum will be checked regularly (Monday through Friday). While you are there, feel free to post responses to your classmates if you can help.
Lesson 5: General Ethanol Production
Lesson 5: General Ethanol ProductionOverview
This lesson will cover how ethanol is produced, from both starch and cellulose. In order to understand ethanol production, we will first learn about enzymes and their role in breaking down cellulose and starch into glucose so that fermentation can take place. The enzymes are the first stage, but there are several stages to producing ethanol. Most of you will not have any biochemistry background, so that’s where we’ll start. We will also cover a little about enzymes for hemicellulose and lignin degradation.
Before covering the technical aspects of the lesson, we will begin Lesson 6 with expectations for your final project.
Lesson Objectives
By the end of this lesson, you should be able to:
- explain the requirements for the final report;
- recall the biochemistry of starch and lignocellulosic biomass, as well as go into greater depth on each of these components;
- discuss the basic biochemistry of enzymes;
- evaluate how the enzymes work and on certain biomass parts particular enzymes are used and products that are made.
Lesson 5 Road Map
This lesson will take us one week to complete. Please refer to the Course Syllabus for specific time frames and assignment due dates.
Questions?
If there is anything in the lesson materials that you would like to comment on or don't quite understand, please post your thoughts and/or questions to our Throughout the Course Questions and Comments discussion forum. The discussion forum will be checked regularly. While you are there, feel free to post responses to your classmates if you are able to help. Regular office hours will be held to provide help for EGEE 439 students.
5.1 Final Project (Biorefinery Project)
5.1 Final Project (Biorefinery Project)The final project will be due at the end of the semester. Toward the end of the semester, the homework will be less, so you’ll have ample opportunity to work on this. However, I am including the expectations now, so that you can begin to work on them.
Biomass Choice
You will be choosing a particular biomass to focus your report on. For the biomass you choose, you will need to do a literature review on the biomass and how and where it grows. Your requirements for location include 1) where it grows, 2) climate, 3) land area requirement, and 4) product markets near location. However, you are not to make a choice that already exists in the marketplace. This includes 1) sugarcane for ethanol production in Brazil and 2) corn for ethanol production in the Midwest of the USA. You need to put thought into what biomass you are interested in converting to fuels and chemicals, as well as where you want to locate your small facility. Most of all, choose biomass and location based on your particular interests, so as to make it interesting to you.
The literature review should consist of a list of at least ten resources that you have consulted from journals and websites of agencies such as IEA. If available, five of these sources should be from the last five years. Please use APA style for your references.
Location Choice and Method of Production
Once you have determined a biomass, choose a location based on previous information. Discuss your reasons for the choice of biomass, location, and desired products for production. Include a map of the area where you want to grow and market your product. You need to be aware of whether or not the biomass you choose can grow in the climate of the area you choose.
You will be choosing a method with which to convert your biomass into fuels. You are expected to include a schematic of the process units and a description of each process that will be necessary to do the biomass conversion; you should include what each process does and a little about the chemistry of each. Show the major chemical reactions that will take place in the process. The figures below show a process diagram and a chemical reaction, so you have an idea of what I expect.

Schematic of the sulfuric acid pretreatment process. This is a typical process schematic or diagram.

Market
The next section has to do with marketing your product. If you don’t have somewhere to sell your product, it will sit in a warehouse, maybe degrade (spoil is a more common term), and you won’t be making money on it. In the location you have chosen, is there a market for the product? If not, is there a location nearby where you can sell it? Discuss how you might market your products in the areas where you want to use biomass and sell products. How might you make the product you are selling appeal to the public? Due to the deregulation of electricity markets in various states, the prices of electricity will vary. Some companies charge more for renewable-based electricity, so they have to appeal to a particular market of people who are willing to spend more on renewable electricity.
Economics
We are going to assume that your process is going to be economic. However, any economic evidence that you can include that supports your process or indicates it would be a highly economical process will be beneficial to your paper. I would also like you to include any research and development that must occur for the process to become viable and economic (i.e., what is the current research on this process?).
Other Factors
Discuss other factors that could affect the outcome of implementing a bio-refining facility. What laws, such as environmental laws, might be in place? What is the political climate of the community you have chosen? What is the national political climate related to the biomass processing you have chosen? Are there any tax incentives that would encourage your process to be implemented or the product to be sold? An example would be something like this: all airlines in the US are expected to include a certain percentage of renewables in the jet fuel they use. So, would your process make jet fuel, and how would you market it to airlines? Include other factors that could “make or break” the facility.
Format
The report should be 8-12 pages in length. This includes figures and tables. It should be in 12-point font with 1” margins. You can use line spacing from 1-2. It is to be clearly communicated in English, with proper grammar, and as free from typographical errors as possible. You will lose points if your English writing is poor.
The following format should be followed:
- Cover Page – Title, Name, Course Info
- Introduction
- Body of Paper (see sections described above)
- Summary and Conclusions
- APA citation style for citations and references.
Grading Rubric:
- Outline: 10 points
- Rough Draft: 30 points
- Final Draft: 30 points
- Presentations (will be uploaded as videos): 30 points
- TOTAL: 100 points
Rubrics specific to each section of the final project are available in the submission dropboxes.
When submitting, please upload your final project to the Final Project Submission Dropbox. Save it as a PDF according to the following naming convention: userID_FinalProject (i.e., ceb7_FinalProject).
Attention:
Please remember that by submitting your paper in Canvas, you affirm that the work submitted is yours and yours alone and that it has been completed in compliance with University policies governing Academic Integrity, which, as a Penn State student, is your responsibility to understand and follow. Your projects will be reviewed closely for unattributed material and may be uploaded to the plagiarism detection service Turnitin.com to ensure originality. Academic dishonesty and lazy citation practices are not tolerated, and should you submit a paper that violates the Academic Integrity policies of the College and the University, be advised that the strictest penalties allowable by the University will be sought by your instructor. Please ask for help if you are concerned about proper citation.
Questions
If you have questions:
If there is anything in the lesson materials that you would like to comment on, or don't quite understand, please post your thoughts and/or questions to our Throughout the Course Questions Comments discussion forum and/or set up an appointment during office hours. The discussion forum is checked regularly (Monday through Friday). While you are there, feel free to post responses to your classmates if you can help.
5.2 Biochemical Structural Aspects of Lignocellulosic Biomass
5.2 Biochemical Structural Aspects of Lignocellulosic BiomassFor Review
To begin this part of Lesson 5, review the Biomass Carbohydrate Tutorial from the previous lesson. It will be important to remember all of the terminology for carbohydrates.
So, at this point, we’ve talked a bit about what lignocellulosic biomass is composed of, what various carbohydrates are chemically, and how to pretreat various biomass sources. Now, we will discuss the use of enzymes in biomass conversion, particularly in cellulose conversion. I’ll first introduce you to cellulases, and then we'll look at a model of enzymatic hydrolysis of cellulose and enzymes for hemicellulose and lignin.
For cellulases, we’ll discuss what they are, provide a brief history, look at glycosyl hydrolases, and, finally, cellulases.
The processing of cellulose in lignocellulosic biomass requires several steps. We’ve discussed pretreatment, where cellulose, lignin, and hemicellulose are separated. Hemicellulose is broken down into xylose and other sugars, which can then be fermented to ethanol. Lignin is separated out and can be further processed or burned depending on the best economic outcome. The first step of processing is then on the cellulose.

Preview of the process of producing ethanol from lignocellulosic biomass.
Producing Ethanol from lignocellulosic biomass:
Cellulose is pretreated so that hemicellulose is broken down to xylose, and other sugars are fermented to ethanol. Lignin is separated and burned: energy exceeds processing requirements.
Cellulose goes through enzymatic hydrolysis to produce glucose, which then goes through fermentation to produce 5% ethanol, which is distilled to produce 100% ethanol.
Pretreatment helps to decrystallize cellulose. However, it must be further processed to break it down into glucose, as it is glucose (a sugar) that can be fermented to make ethanol, and the liquid product must be further processed to make concentrated ethanol. So, we are focusing this lesson on the enzymatic hydrolysis of starch and cellulose.
5.2a Starch
5.2a StarchWe briefly addressed what starch is in Lesson 5. Now, we’ll go into a little more depth. In plants, starch has two components: amylose and amylopectin. Amylose is a straight-chain sugar polymer. Normal corn has 25% amylose, high amylose corn has 50-70% amylose and waxy corn (maize) have less than 2%. The rest of the starch is composed of amylopectin. Its structure is branched and is most commonly the major part of starch. Animals contain something similar to amylopectin, called glycogen. The glycogen resides in the liver and muscles as granules.
You can visit howstuffworks.com to see a schematic of what amylopectin looks like in a granule (see 'How Play-Doh Works') and then strands of the compound. The figure below shows some micrographs of starch as it begins to interact with water. When cooking with starch, you can make a gel from the polysaccharide. (A) This part of the figure shows polysaccharides (lines) packed into larger structures called starch granules; upon adding water, the starch granules swell and polysaccharides begin to diffuse out of the granules. Heating these hydrated starch granules helps polysaccharide molecules diffuse out of the granules and form a tangled network. (B) This is an electron micrograph of intact potato starch granules. (C) This is an electron micrograph of a cooked flaxseed gum network.

Now, let’s look at the starch components on a chemical structure basis. Amylose is a linear molecule with the α-1,4-glucosidic bond linkage. Upon viewing the molecule on a little larger scale, one can see it is helical. It becomes a colloidal dispersion in hot water. The average molecular weight of the molecule is 10,000-50,000 amu, and it averages 60-300 glucose units per molecule. Figure 6.5 depicts the chemical structure of amylose.
Amylopectin is branched, not linear, and is shown in the figure below. It has α-1,4-glycosidic bonds and α-1,6-glycosidic bonds. The α-1,6-glycosidic branches occur for about 24-30 glucose units. It is insoluble compared to amylose. The average molecular weight is 300,000 amu, and it averages 1800 glucose units per molecule. Amylopectin is about 10 times the size of amylose.
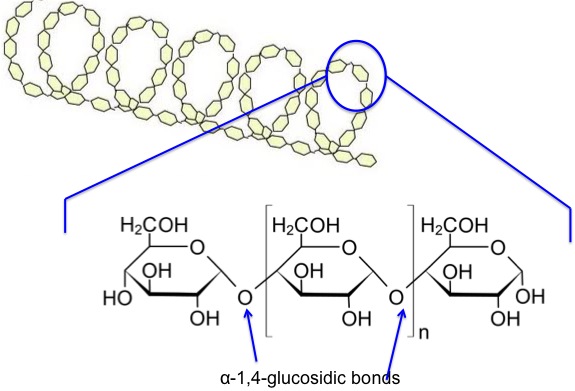
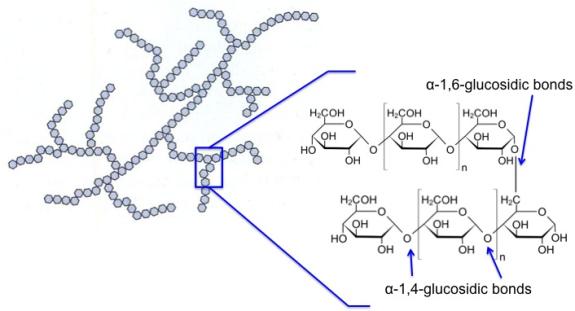
5.2b Cellulose
5.2b CelluloseCellulose is the most abundant polysaccharide, and it is also the most abundant biomass on earth. The linkages are slightly different from starch, called β-1,4-glycosidic linkages, as the bond is in a slightly different configuration or shape. This bond causes the strands of cellulose to be straighter (not helical). The hydrogen on one polymer strand can interact with the OH on another strand; this interaction is known as a hydrogen bond (H-bond), although it isn't an actual bond, just a strong interaction. This is what contributes to the crystallinity of the molecule. [Definition: the H-bond is not a bond like the C-H or C-O bonds are, i.e., they are not covalent bonds. However, there can be a strong interaction between hydrogen and oxygen, nitrogen, or other electronegative atoms. It is one of the reasons that water has a higher boiling point than expected.] The strands of cellulose form long fibers that are part of the plant structure. The average molecular weight is between 50,000 and 500,000, and the average number of glucose units is 300-2500.
5.2c Hemicellulose
5.2c HemicelluloseAs seen in previous lessons, lignocellulosic biomass contains another component, hemicellulose. Rather than being a typical polymer where units repeat over and over again, hemicellulose is a heteropolymer. It has a random, amorphous structure with little strength. It has multiple sugar units rather than the one glucose unit we’ve seen for starch and cellulose, and the average number of sugar units is 500-3000 (glucose units with the starch and cellulose). The monomer units include xylose, mannose, galactose, rhamnose, and arabinose units. The various polymers of hemicellulose include xylan, glucuronoxylan, arabinoxylan, glucomannan, and xyloglucan.


5.2d Lignin
5.2d LigninSo, we’ve identified the chemical structures of starch, cellulose, and hemicellulose. Now we’re going to look at what lignin is, chemically.
Vascular land plants make lignin to solve problems due to terrestrial lifestyles. Lignin helps to keep water from permeating the cell wall, which helps water conduction in the plant. Lignin adds support – it may help to “weld” cells together and provides stiffness for resistance against forces that cause bending, such as wind. Lignin also acts to prevent pathogens and is recalcitrant to degradation; it protects against fungal and bacterial pathogens (there is a discussion in Lesson 5 about recalcitrance). Lignin is comprised of crosslinked, branched aromatic monomers: p-coumaryl alcohol, coniferyl alcohol, and sinapyl alcohol; their structures are shown in the figures below and show how these building blocks fit into the lignin structure. p-Coumaryl alcohol is a minor component of grass and forage-type lignins. Coniferyl alcohol is the predominant lignin monomer found in softwoods (hence the name). Both coniferyl and sinapyl alcohols are the building blocks of hardwood lignin. The table below shows the differing amounts of lignin building blocks in the three types of lignocellulosic biomass sources.
| Lignin Sources | Grasses | Softwood | Hardwood |
|---|---|---|---|
| p-coumaryl alcohol | 10-25% | 0.5-3.5% | Trace |
| coniferyl alcohol | 25-50% | 90-95% | 25-50% |
| sinapyl alcohol | 25-50% | 0-1% | 50-75% |


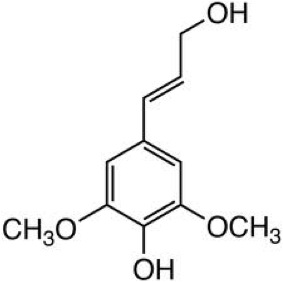


Several different materials can be made from lignin, but most are not on a commercial scale. The table below shows the class of compounds that can be made from lignin and the types of products that come from that class of compounds. If an economic method can be developed for lignin depolymerization and chemical production, it would benefit the biorefining of lignocellulosic biomass.
| Class of Compound | Product Examples |
|---|---|
| Simple aromatics | Biphenyls, Benzene, Xylenes |
| Hydroxylated aromatics | Phenol, Catechol, Propylphenol, etc. |
| Aromatic Aldehydes | Vanillin, Syringaldehyde |
| Aromatic Acids and Diacids | Vanillic Acid |
| Aliphatic Acids | Polyesters |
| Alkanes | Cyclohexane |
There are also high molecular weight compounds. These include carbon fibers, thermoplastic polymers, fillers for polymers, polyelectrolytes, and resins, which can be made into wood adhesives and wood preservatives.
5.3 Enzymatic Biochemistry and Processing
5.3 Enzymatic Biochemistry and ProcessingStarches are broken down by enzymes known as amylases; our saliva contains amylase, so this is how starches begin to be broken down in our body. Amylases have also been isolated and used to depolymerize starch for making alcohol, i.e., yeast for bread making and for alcohol manufacturing. Chemically, the amylase breaks the carbon-oxygen linkage on the chains (α-1,4-glucosidic bond and the α-1,6-glucosidic bond), which is known as hydrolysis. Once the glucose is formed, then fermentation can take place to break the glucose down into alcohols and CO2. The amylases were isolated and the hydrolysis of glucose began to be understood in the 1800s.
However, recall that cellulose linkages are β-1.4-glucosidic bonds. These bonds are much more difficult to break, and due to cellulose crystallinity, breaking cellulose down into glucose is even more difficult. It was only during WWII that enzymatic hydrolysis of cellulose was discovered. Instead of enzymes called amylases, the enzymes that degrade cellulose are called cellulases.
Cellulases are not a single enzyme. There are two main approaches to biological cellulose depolymerization: complexed and non-complexed systems. Each cellulase enzyme is composed of three main parts, and there are multiple synergies between enzymes.
5.3a The Reaction of Cellulose: Cellulolysis
5.3a The Reaction of Cellulose: CellulolysisCellulolysis is essentially the hydrolysis of cellulose. In low and high pH conditions, hydrolysis is a reaction that takes place with water, with the acid or base providing H+ or OH- to precipitate the reaction. Hydrolysis will break the β-1,4-glucosidic bonds, with water and enzymes to catalyze the reaction. Before discussing the reaction in more detail, let’s look at the types of intermediate units that are made from cellulose. The main monomer that composes cellulose is glucose. When two glucose molecules are connected, it is known as cellobiose – one example of a cellobiose is maltose. When three glucose units are connected, it is called cellotriose – one example is β -D pyranose form. And four glucose units connected together are called cellotetraose. Each of these is shown below.


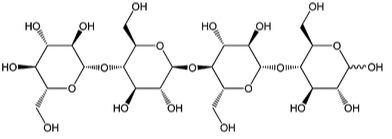
We’ve seen the types of intermediates, so now let’s see the reaction types that are catalyzed by cellulose enzymes. The steps are shown below.
- Breaking of the noncovalent interactions present in the structure of the cellulose, breaking down the crystallinity in the cellulose to an amorphous strand. These types of enzymes are called endocellulases.
- The next step is hydrolysis of the chain ends to break the polymer into smaller sugars. These types of enzymes are called exocellulases, and the products are typically cellobiose and cellotetraose.
- Finally, the disaccharides and tetrasaccharides (cellobiose and cellotetraose) are hydrolyzed to form glucose, which are known as β-glucosidases.

Okay, now we have an idea of how the reaction proceeds. However, there are two types of cellulase systems: noncomplexed and complexed. A noncomplexed cellulase system is the aerobic degradation of cellulose (in oxygen). It is a mixture of extracellular cooperative enzymes. A complexed cellulase system is an anaerobic degradation (without oxygen) using a “cellulosome.” The enzyme is a multiprotein complex anchored on the surface of the bacterium by non-catalytic proteins that serve to function like individual noncomplexed cellulases but are in one unit. The figure below shows how the two different systems act. However, before going into more detail, we are now going to discuss what the enzymes themselves are composed of. The reading by Lynd provides some explanation of how the noncomplexed versus the complexed systems work.

This image is a comparative illustration of two distinct mechanisms for cellulose degradation, presented in two labeled panels: A and B. Panel A focuses on the free enzyme system, where individual enzymes act independently to break down cellulose. At the top, the structure of cellulose is shown, highlighting both crystalline and amorphous regions. Below, various enzymes—including endoglucanase, exoglucanase (CBHI and CBHII), and β-glucosidase—are illustrated interacting with the cellulose fibers. These enzymes work in concert to hydrolyze the cellulose into simpler sugars such as glucose, cellobiose, and cello-oligosaccharides.
Panel B illustrates the cellulosome-mediated degradation pathway, a more structured and synergistic approach. At the top, bacterial cell walls are shown with scaffoldin proteins anchored to them. These scaffoldins contain cohesin moieties that specifically bind to dockerin-containing enzymes like endoglucanase (CelF/CelS) and exoglucanase (CelE). The bottom part of this panel shows these enzymes forming a multi-enzyme complex, working together to efficiently degrade both crystalline and amorphous cellulose into simpler sugars.
A legend at the bottom of the image provides symbolic representations for the various components involved, including different enzymes, sugar products, and structural modules like carbohydrate-binding modules (CBMs) and phosphorylases. Overall, the image serves as a detailed visual comparison of the free enzyme system versus the cellulosome system in the biochemical breakdown of cellulose.
5.3b Composition of Enzymes
5.3b Composition of EnzymesThe first place to start is to describe the structure of a cellulase using typical terms in biochemistry. A modular cellobiohydrolase (CBH) has a few aspects in common; the common features include 1) a binder region of the protein, 2) a catalytic region of the protein, and 3) a linker region that connects the binder and catalytic regions. the first figure below shows a general diagram of the common features of a cellulase. The CBH acts on the terminal end of a crystalline cellulosic substrate, where the cellulose binding domain (CBD) is embedded in the cellulose chain, and the strand of cellulose is digested by the enzyme catalyst domain to produce cellobiose. This type of enzyme is typical of exocellulases. The second figure shows a more realistic model, where the linker is attached to the surface of the cellulose.
One of the main differences between glycosyl hydrolases (a type of cellulase) and the other enzymes is how the catalytic domain functions. There are three types: 1) pocket, 2) cleft, and 3) tunnel. Pocket or crater topology is optimal for the recognition of a saccharide non-reducing extremity and is encountered in monosaccharidases. Exopolysaccharidases are adapted to substrates having a large number of available chain ends, such as starch. On the other hand, these enzymes are not very efficient for fibrous substrates such as cellulose, which has almost no free chain ends. Cleft or groove cellulase catalytic domains are “open” structures, which allow a random binding of several sugar units in polymeric substrates and are commonly found in endo-acting polysaccharidases such as endocellulases. Tunnel topology arises from the previous one when the protein evolves long loops that cover part of the cleft. Found so far only in CBH, the resulting tunnel enables a polysaccharide chain to be threaded through it. The red portions on each catalytic domain are supposed to be the carbohydrates being processed, although it is difficult to see in this picture.

This image presents a detailed schematic of the molecular interaction between crystalline cellulose and a cellulolytic enzyme, emphasizing the structural and functional components involved in cellulose degradation. On the left side, the crystalline cellulose is depicted, with annotations highlighting the hydrogen bonds and Van der Waals interactions that contribute to its tightly packed, rigid structure. These interactions are crucial in maintaining the stability and resistance of cellulose to enzymatic attack.
At the interface between the cellulose and the enzyme, a glycosylation site is marked, indicating a point of biochemical interaction where the enzyme may be modified or anchored to enhance its activity or stability. The enzyme itself is divided into three distinct regions: the Cellulose Binder, which facilitates attachment to the cellulose surface; the Linker Region, which provides flexibility and spatial orientation; and the Catalytic Domain, where the actual hydrolysis of cellulose occurs.
On the right side of the image, cellobiose is shown as the primary product of this enzymatic reaction, representing a disaccharide unit released from the cellulose chain. This diagram effectively illustrates the complex interplay between enzyme structure and cellulose architecture, offering insight into the biochemical mechanisms underlying cellulose degradation.
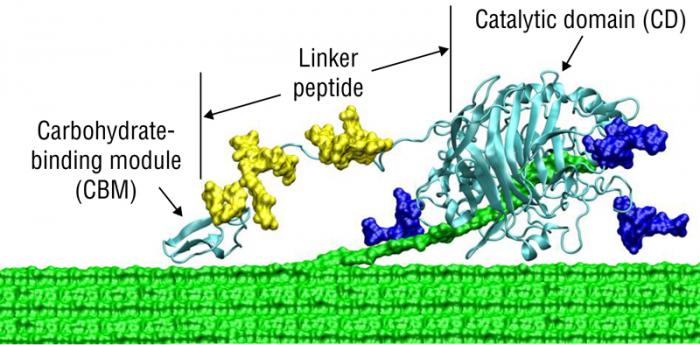

Catalytic Domains of Glycosyl Hydrolases – A) pocket, B) cleft, and C) tunnel.
Catalytic Domains of Glycosyl Hydrolases:
Pocket-glucoamylase from A. awamori, Hydrolysis of amorphous polymers or dimers (e.g. starch and cellobiose)
Cleft - Endoglucanase (Cel6A) from T. fusca Hydrolysis of crystalline polymers (e.g. cellulose endoglucanases)
Tunnel - exoglucanase CHBII (Cel6A) from T. reesei, processive hydrolysis of crystalline polymers (e.g. exoglucanases)
The other main feature of these enzymes is the cellulose binding domain or module (CBD or CBM). Different CBDs target different sites on the surface of the cellulose; this part of the enzyme will recognize specific sites, help to bring the catalytic domain close to the cellulose and pull the strand of cellulose molecule out of the sheet so the glycosidic bond is accessible.
So now, let’s go back to noncomplexed versus complexed cellulase systems. The first figure below is another comparison of noncomplexed versus complexed cellulase systems, but this time, it focuses on the enzymes. Notice in Figure A below, the little PacMan look-alike figures for enzymes. The enzymes are separate but work in concert to break down the cellulose strands into cellobiose and glucose. Recall that this process is aerobic (in oxygen).
Now look at Figure B and the complexed system. The enzymes are attached to subunits that are attached to the bacterium cell wall. The products are the same, but recall that this system is anaerobic (without oxygen), and these enzymes all work together to produce cellobiose and glucose.

Patthra Pason, Chakrit Tachaapaikoon, Khin Lay Kyu,
Kazuo Sakka, Akihiko Kosugi and Yutaka Mori (2013). Paenibacillus curdlanolyticus Strain B-6 Multienzyme Complex: A Novel System for Biomass Utilization, Biomass Now - Cultivation and Utilization, Dr. Miodrag Darko Matovic (Ed.), ISBN: 978-953-51-1106-1, InTech, DOI: 10.5772/51820.
So, what are those subunits that are essentially the connectors in the enzyme? The figure below shows a schematic of the types. The cellulosome is designed for the efficient degradation of cellulose. A scaffoldin subunit has at least one cohesin module that is connected to other types of functional modules. The CBM shown is a cellulose-binding module that helps the unit anchor to the cellulose. The cohesin modules are major building blocks within the scaffoldin; cohesins are responsible for organizing the cellulolytic subunits into the multi-enzyme complex. Dockerin modules anchor catalytic enzymes to the scaffoldin. The catalytic subunits contain dockerin modules; these serve to incorporate catalytic modules into the cellulosome complex. This is the architecture of the C. thermocellum cellulosome system. (Alber et al., CAZpedia, 2010). Within each cellulosome, there can be many different types of these building blocks. The last figure shows a block diagram of two different structures of T. neapolitana LamA and Caldicellulosiruptor strain Rt8B.4 ManA in a block diagram form. Due to the level of this class, we will not be going into any greater depth about these enzymes.


This image presents a structured table summarizing information about specific enzymes, their corresponding recombinant peptides, modular structures or primer binding positions, and the organisms from which they are derived. The table is divided into two main enzyme categories: LamA and ManA.
For the LamA enzyme, two recombinant peptides are listed: LamAm1 and LamAm3. These peptides are associated with modular structures or primer binding positions labeled as TNEALAMF (M1) TNEALAMR for LamAm1 and TNEALAMF3 (M3) TNEALAMR3 for LamAm3. The source organism for LamA is Thermotoga neapolitana, a thermophilic bacterium known for its ability to degrade complex carbohydrates at high temperatures.
For the ManA enzyme, three recombinant peptides are identified: ManAm12, ManAm1, and ManAm2. Their corresponding primer binding positions are RTMANAF (M1) RTMANAR1 for ManAm1, and RTMANAF2 (M2) RTMANAR2 for ManAm2. The organism of origin for ManA is Caldicellulosiruptor strain Rt8B.4, another thermophilic microorganism recognized for its cellulolytic and hemicellulolytic capabilities.
5.3c Hemicellulases and Lignin-degrading Enzymes
5.3c Hemicellulases and Lignin-degrading EnzymesHemicellulases work on the hemicellulose polymer backbone and are similar to endoglucanases. Because of the side chain, “accessory enzymes” are included for side-chain activities. An example of hemicellulase activity on arabinoxylan and the places where bonds are broken by enzymes are shown (blue) in the first figure below. The second figure shows another example of how hemicellulose breaks down hemicellulose, a complex mixture of enzymes, to degrade hemicellulose. The example depicted is cross-linked glucurono arabinoxylan.
The complex composition and structure of hemicellulose require multiple enzymes to break down the polymer into sugar monomers—primarily xylose, but other pentose and hexose sugars also are present in hemicelluloses. A variety of debranching enzymes (red) act on diverse side chains hanging off the xylan backbone (blue). These debranching enzymes include arabinofuranosidase, feruloyl esterase, acetylxylan esterase, and alpha-glucuronidase [The table below shows enzyme families for degrading the hemicellulose]...As the side chains are released, the xylan backbone is exposed and made more accessible to cleavage by xylanase. Beta-xylosidase cleaves xylobiose into two xylose monomers; this enzyme also can release xylose from the end of the xylan backbone or a xylo-oligosaccharide. (U.S. DOE, 2006)


| Enzyme | Enzyme Families |
|---|---|
| Endoxylanase | GH5, 8, 10, 11, 43 |
| Beta-xylosidase | GH3, 39, 43, 52, 54 |
| Alpha-L-arabinofuranosidase | GH3, 43, 51, 54, 62 |
| Alpha-glucurondiase | GH4, 67 |
| Alpha-galatosidase | GH4, 36 |
| Acetylxylan esterase | CE1, 2, 3, 4, 5, 6, 7 |
| Feruloyl esterase | CE1 |
Lignin-degrading enzymes are different from hemicellulases and cellulases. They are known, as a group, as oxidoreductases. Lignin degradation is an enzyme-mediated oxidation, involving the initial transfer of single electrons to the intact lignin (this would be a type of redox reaction or reduction-oxidation reaction). Electrons are transferred to other parts of the molecule in uncontrolled chain reactions, leading to the breakdown of the polymer. It is different from carbohydrate hydrolysis because it is an oxidation reaction, and it requires oxidizing power (e.g., hydrogen peroxide, H2O2) to break the lignin down. In general, it is a significantly slower reaction than the hydrolysis of carbohydrates.
Examples of lignin-degrading enzymes include lignin peroxidase (aka ligninase), manganese peroxidase, and laccase, which contain metal ions involved in electron transfer. Lignin peroxidase (previously known as ligninase) is an iron-containing enzyme, that accepts two electrons from hydrogen peroxide (H2O2), and then passes them as single electrons to the lignin molecule. Manganese peroxidase acts similarly to lignin peroxidase but oxidizes manganese (from H2O2) as an intermediate in the transfer of electrons to lignin. Laccase is a phenol oxidase, which directly oxidizes the lignin molecule (contains copper). There are also several hydrogen-peroxide-generating enzymes (e.g., glucose oxidase), which generate H2O2 from glucose. (Microbial World, The University of Edinburgh).
If you are interested in learning about the mechanisms of these enzymes, then visit the Department of Chemistry, University of Maine. Several pages discuss how each of the different types of enzymes works mechanistically.
Lesson 6 will discuss the process of ethanol production after the use of cellulases on cellulose.
5.4 Assignments Overview
5.4 Assignments OverviewTo Read
Please read Lynd, L. R., P. J. Weimer, W. H. Van Zyl, and I. S. Pretorius. "Microbial Cellulose Utilization: Fundamentals and Biotechnology." Microbiology and Molecular Biology Reviews 66.3 (2002): 511-15. You can find a link to this reading in the Readings section of Lesson 5.
Quiz #3
You will be asked to complete Quiz #3. It contains questions that pertain to the lesson material.
5.5 Summary and Final Tasks
5.5 Summary and Final TasksSummary
In Lesson 5.1, we went over the requirements for the final project. In a future lesson, you will be expected to choose your biomass and outline your project.
Lesson 5.2 provided an overview of lignocellulosic biomass structure in greater depth than the previous lesson did. The greater depth is needed in order to understand how the enzymes work. You are expected to understand what lignocellulosic biomass is and how the components can break apart (i.e., what the fragments are chemically).
Lesson 5.3 discussed the basic composition of enzymes, how cellulosic enzymes (cellulases) work, and how hemicellulosic and lignitic enzymes work. The homework provided a background of what you need to know about enzymes.
Lesson Objectives
By the end of this lesson, you should be able to:
- explain the requirements for the final report;
- recall the biochemistry of starch and lignocellulosic biomass, as well as go into greater depth on each of these components;
- discuss the basic biochemistry of enzymes;
- evaluate how the enzymes work, and on certain biomass parts, particular enzymes are used, and products that are made.
References
M. Bembenic and C.E.B. Clifford, “Subcritical water reactions of model compounds for a hardwood-derived Organosolv lignin with nitrogen, hydrogen, carbon monoxide and carbon dioxide gases,” Energy Fuels, 27 (11), 6681-6694, 2013.
David Hodge, Wei Liao, Scott Pryor, Yebo Li, Enzymatic Conversion of Lignocellulosic Materials: BEEMS Module B2, sponsored by USDA Higher Education Challenger Program 2009-38411-19761.
Lee Lynd, P.J. Weimer, W.H. van Zyl, I.S. Pretorius, “Microbial cellulose utilization: Fundamentals and biotechnology,” Microbiology and Molecular Biology Reviews, 66 (3), 506-577, 2002.
Gideon Davies and Bernard Henrissat, “Structures and mechanisms of glycosyl hydrolases,” Structure, 3, 853-859, 1995.
Alber, O., Dassa, B., and Bayer, E., “Cellulosome” within the CAZpedia website, 2010, accessed June 5, 2014.
Summa, A., Gibbs, M.D., and Bergquist, P.L., “Identification of novel β-mannan- and β-glucan-binding modules: evidence for a superfamily of carbohydrate-binding modules,” Biochem. J., 356, 791-798, 2001.
U.S. DOE, Breaking the Biological Barriers to Cellulosic Ethanol: A Joint Research Agenda. DOE/SC-0095, U.S. Department of Energy Office of Science and Office of Energy Efficiency and Renewable Energy, 2006.
Reminder - Complete all of the Lesson tasks!
You have reached the end of the Lesson. Double-check the Road Map on the Lesson Overview page to make sure you have completed the activity listed there before you begin the next Lesson.
Questions?
If there is anything in the lesson materials that you would like to comment on, or don't quite understand, please post your thoughts and/or questions to our Throughout the Course Questions & Comments discussion forum and/or set up an appointment during office hours. While you are there, feel free to post responses to your classmates if you can help.
Lesson 6: Processing to Produce Ethanol and Butanol from Carbohydrates and Enzymes
Lesson 6: Processing to Produce Ethanol and Butanol from Carbohydrates and EnzymesOverview
The previous lesson covered the final project, the composition of various carbohydrates, and the enzymes necessary for the conversion of cellulose (to glucose), hemicellulose, and lignin. That’s just the initial step for the conversion of lignocellulosic biomass. This lesson will cover the process necessary to convert starch into smaller units (like glucose) as well as the entire processing required to produce ethanol. Once glucose is produced, the production of ethanol is the same, whether beginning with starch or cellulose. In a separate section, we will also discuss the production of butanol (a four-carbon chain alcohol) rather than ethanol (a two-carbon chain alcohol); this will include why we might want to convert to butanol.
Lesson Objectives
By the end of this lesson, you should be able to:
- explain similarities and differences between sugar-based and starch-based ethanol production as well as butanol production;
- describe the differences between wet and dry milling of corn;
- explain process steps in dry milling ethanol and butanol production;
- identify important co-products from corn ethanol and butanol production;
- evaluate the largest factors that affect the economics of ethanol and butanol production.
Road Map
This lesson will take us one week to complete. Please refer to the Course Syllabus for specific time frames and assignment due dates.
Questions?
If there is anything in the lesson materials that you would like to comment on or don't quite understand, please post your thoughts and/or questions to our Throughout the Course Questions and Comments discussion forum. The discussion forum will be checked regularly. While you are there, feel free to post responses to your classmates if you are able to help. Regular office hours will be held to provide help for EGEE 439 students.
6.1 Ethanol Production - General Information
6.1 Ethanol Production - General InformationBack in Lesson 2, I included a chemistry tutorial on some of the basic constituents of fuels. In this lesson, we will be discussing the production of ethanol (CH3-CH2-OH) and butanol (CH3-CH2-CH2-CH2-OH) from starch and sugar. Ethanol, or ethyl alcohol, is a chemical that is volatile, colorless, and flammable. It can be produced from petroleum via the chemical transformation of ethylene, but it can also be produced by fermentation of glucose, using yeast or other microorganisms; current fuel ethanol plants make ethanol via fermentation.
The basic formula for making ethanol from sugar glucose is as follows:
For fermentation, yeast is needed (other enzymes are used but yeast is most common), a sugar such as glucose is the carbon source, and anaerobic conditions (without oxygen) must be present. If you have aerobic (with oxygen) conditions, the sugar will be completely converted into CO2 with little ethanol produced. Other nutrients include water, a nitrogen source, and micronutrients.
Here in the US, the current common method of ethanol fuel production comes from starches, such as corn, wheat, and potatoes. The starch is hydrolyzed into glucose before proceeding with the rest of the process. In Brazil, sucrose, or sugar in sugarcane is the most common feedstock. And in Europe, the most common feed is sugar beets. Cellulose is being used in developing methods, which include wood, grasses, and crop residues. It is considered developing because converting the cellulose into glucose is more challenging than in starches and sugars.
The International Energy Agency (IEA) predicts that ethanol will constitute two-thirds of the global growth in conventional biofuels with biodiesel and hydrotreated vegetable oil accounting for the remaining part (2018-2023). Global ethanol production is estimated to increase by 14% from about 120 bln L in 2017 to approximately 131 bln L by 2027. Brazil will accommodate fifty percent of this increase and will be used to fill in the domestic demand (OECD/FAO (2018), “OECD-FAO Agricultural Outlook”).

Development of the world ethanol market.
| Year | World Ethanol Trade in Billions of Liters | World Ethanol Production in Billions of Liters |
|---|---|---|
| 2010 | 6 | 104 |
| 2011 | 10 | 103 |
| 2012 | 9 | 101 |
| 2013 | 8 | 109 |
| 2014 | 7 | 115 |
| 2015 | 7 | 119 |
| 2016 | 9 | 118 |
| 2017 | 10 | 120 |
| 2018 | 9 | 123 |
| 2019 | 9 | 124 |
| 2020 | 9 | 125 |
| 2021 | 9 | 126 |
| 2022 | 9 | 127 |
| 2023 | 9 | 128 |
| 2024 | 9 | 129 |
| 2025 | 9 | 130 |
| 2026 | 9 | 130 |
| 2027 | 9 | 131 |
World production of ethanol-based by country is shown below. The US produces the most ethanol worldwide (~57%), primarily from corn. Brazil is the next largest producer with 27%, primarily from sugarcane. Other countries, including Australia, Columbia, India, Peru, Cuba, Ethiopia, Vietnam, and Zimbabwe, are also beginning to produce ethanol from sugarcane.

World ethanol production by country, in percent.
| Country | Percent (%) |
|---|---|
| US | 57% |
| Brazil | 27% |
| Europe | 6% |
| China | 3% |
| India | 2% |
| Canada | 2% |
| Rest of the World | 3% |
The figure below shows the growth of sugarcane in the world, in tropical or temperate regions. Sugar beet production in Europe is the other source of sugar for ethanol. It is grown in more northern regions than sugarcane, primarily in Europe and a small amount in the US. The next figure shows the growth of sugar beets in the world.


6.2 Sugarcane Ethanol Production
6.2 Sugarcane Ethanol ProductionProduction of ethanol from corn will be discussed in the next section; this section will focus on sugarcane ethanol production. So, what needs to be done to get the sugar from sugarcane?
- The first step is sugarcane harvesting. Much of the harvesting is done with manual labor, particularly in many tropical regions. Some harvesting is done mechanically. The material is then quickly transported by truck to reduce losses.
- The cane is then cut and milled with water. This produces a juice with 10-15% solids, from which the sucrose is extracted. The juice contains undesired organic compounds that could cause what is called sugar inversion (hydrolysis of sugar into fructose and glucose). This leads to the clarification step to prevent sugar inversion.
- In the clarification step, the juice is heated to 115°C and treated with lime and sulfuric acid, which precipitates unwanted inorganics.
- The next step for ethanol production is the fermentation step, where juice and molasses are mixed so that a 10-20% sucrose solution is obtained. The fermentation is exothermic; therefore, cooling is needed to keep the reaction under fermentation conditions. Yeast is added along with nutrients (nitrogen and trace elements) to keep yeast growing. Fermentation can take place in both batch and continuous reactors, though Brazil primarily uses continuous reactors.
The figure below shows a schematic of one process for ethanol production, along with the option to produce refined sugar as well. Sugarcane contains the following: water (73-76%), soluble solids (10-16%), and dry fiber or bagasse (11-16%). It takes a series of physical and chemical processes that occur in 7 steps to make the two main products, ethanol and sugar.

Schematic of the process of sugarcane to produce ethanol and sugar.
Here is a list of the seven stages of the sugar cane process, followed by a step-by-step explanation of the seven stages:
- Stage 1: Extraction
- Stage 2: Juice Treatment (leading to sugar)
- Stage 3: Juice Treatment (leading to ethanol)
- Stage 4: Multi Effect Evaporator
- Stage 5: Crystallization, Drying
- Stage 6: Fermentor
- Stage 7: Ethanol Distillation
Explanation of the seven stages, beginning with Sugar Cane:
- Stage 1 (Extraction) results in juice [also produces bagasse]. Juice is sent on to two possible stages: Stage 2 (eventually leading to sugar) or Stage 3 (eventually leading to ethanol).
- Stage 2 produces Treated Juice [also produces cake].
- Stage 3 produces Treated Juice. Treated Juice from Stage 3 is sent on to Stage 6 (Fermentor), while Treated Juice from Stage 2 is sent on to Stage 4 (Multi Effect Evaporator).
- The result of Stage 4 (Multi Effect Evaporator) is syrup [this stage also produces vapor]. This syrup is sent on in several possible directions.
- Option 1. The syrup finishes at Stage 5 (Crystallization, Drying), where the syrup becomes sugar [or sub-products].
- Option 2. The syrup passes through Stage 5 (Crystallization, Drying), where the syrup becomes molasses, and then goes on to Stage 6 (Fermentor).
- Option 3. The syrup goes directly to Stage 6 (Fermentor).
- The result of Stage 6 (Fermentor) is wine. The wine is sent on to Stage 7.
- The result of Stage 7 (Ethanol Distillation) is ethanol [this stage also produces sub-products].
So, why produce both sugar and ethanol? Both are commodity products, so the price and market of the product may dictate how much of each product to make. This is how Brazilian ethanol plants are configured. To have an economic process, all of the products, even the by-products, are utilized in some fashion.
As noted previously, one of the major by-products is the dry fiber of processing, also known as bagasse. Bagasse is also a by-product of sorghum stalk processing. Most commonly, bagasse is combusted to generate heat and power for processing. The advantage of burning the bagasse is lowering the need for external energy, which in turn also lowers the net carbon footprint and improves the net energy balance of the process. In corn processing, a co-product is made that can be used for animal feed, called distiller grains, but this material could also be burned to provide process heat and energy. The figure below shows a bagasse combustion facility. The main drawback to burning bagasse is its high water content; high water content reduces the energy output and is an issue for most biomass sources when compared to fossil fuels, which have a higher energy density and lower water content.
Bagasse can have other uses. The composition of bagasse is: 1) cellulose, 45-55%, 2) hemicellulose, 20-25%, 3) lignin, 18-24%, 4) minerals, 1-4%, and 5) waxes, < 1%. With the cellulose content, it can be used to produce paper and biodegradable paper products. It is typically carted on small trucks that look like they have “hair” growing out of them.


Another crop that has some similarities to sugarcane is sorghum. Sorghum is a species of grass, with one type that is raised for grain and many other types that are used as fodder plants (animal feed). The plants are cultivated in warmer climates and are native to tropical and subtropical regions. Sorghum bicolor is a world crop that is used for food (as grain and in sorghum syrup or molasses), animal feed, the production of alcoholic beverages, and biofuels. Most varieties of sorghum are drought- and heat-tolerant, even in arid regions, and are used as a food staple for poor and rural communities. The figure below shows a picture of a sorghum field.

The US could use several alternative sugar sources to produce ethanol; it turns out corn is the least expensive and, therefore, the most profitable feed and method to produce ethanol. The table below shows a comparison of various feedstocks that could be used to make ethanol, comparing feedstock costs, production costs, and total costs. When you look at using sugar to make ethanol (from various sources), you can see processing costs are low, but feedstock prices are high. However, in Brazil, sugarcane feed costs are significantly lower than in other countries. Notice the data is from 2006.
| Cost Item | Feedstock Costsb | Processing Costs | Total Costs |
|---|---|---|---|
| UC Corn wet milling | 0.40 | 0.63 | 1.03 |
| UC Corn dry milling | 0.53 | 0.52 | 1.05 |
| US Sugarcane | 1.48 | 0.92 | 2.40 |
| US Sugar beets | 1.58 | 0.77 | 2.35 |
| US Molassesc | 0.91 | 0.36 | 1.27 |
| US Raw Sugarc | 3.12 | 0.36 | 3.48 |
| US Refined Sugarc | 3.61 | 0.36 | 3.97 |
| Brazil Sugarcaned | 0.30 | 0.51 | 0.81 |
| EU Sugar beetsd | 0.97 | 1.92 | 2.89 |
- Excludes capital costs
- Feedstock costs for US corn wet and dry milling are net feedstock costs; feedstock for US sugarcane and sugar beets are gross feedstock costs
- Excludes transportation costs
- Average of published estimates
6.3 Ethanol Production from Corn
6.3 Ethanol Production from CornThe following pages will describe the process of ethanol production from corn.
6.3a Composition of Corn and Yield of Ethanol from Corn
6.3a Composition of Corn and Yield of Ethanol from CornAs established in the previous section, corn has the least expensive total cost for ethanol production. So what part of the corn is used for ethanol? Primarily the corn kernel is used for ethanol production. The figure below shows the general composition of corn. It is a picture of yellow dent corn, which is commonly used for ethanol production. The endosperm is mostly composed of starch, the corn’s energy storage, and protein for germination. It is the starch that is used for making fuel. The pericarp is the outer covering that protects the kernel and preserves the nutrients inside. The pericarp resists water and water vapor and protects against insects and microorganisms. The living organism in the kernel is the germ. It contains genetic information, enzymes, vitamins, and minerals, which help the kernels grow into a corn plant. About 25% of the germ is corn oil and is a valuable part of the kernel. The tip cap is where the kernel is attached to the cob, and water and nutrients flow through the tip cap. This part of the kernel is not covered by the pericarp.

Starch is a polymer. It is made up of D-glucose units. Therefore, glucose components directly impact ethanol yields. The components of yellow dent corn are the following. It is primarily composed of starch, at 62%. The corn kernel is also composed of protein and fiber (19%), water (15%), and oil (4%). It can also contain traces of other constituents, but these are small relative to the main components. If you’ll recall from Lesson 6, starch is composed of two different polymeric molecules: amylose and amylopectin. If you factor in these two carbons, the starch can be broken into these components: amylopectin is 50% of the yellow dent corn kernel (80% of the starch) and amylose is 12% of the kernel (20% of the starch).
One bushel of corn (56 lbs.) can provide several products. The one bushel can provide:
31.5 lbs. of starch
OR
33 lbs. of sweetener
OR
2.8 gal. of fuel ethanol
OR
22.4 lbs of PLA fiber, which is a starch-based polymer called polylactic acid
In addition, the corn will provide 13.5 lbs. of gluten feed (20% protein), 2.5 lbs. of gluten meal (60% protein), and 1.5 lbs. of corn oil. Based on this information, we can calculate the actual yield to the theoretical yield and determine the percent yield we can achieve for ethanol conversion. This is shown below:
1 bushel of corn:
The reaction of glucose to ethanol:
, typically
As discussed in Lesson 5 for pretreatment of lignocellulosic biomass, the breaking down of glucose also requires hydrolysis. As water ionizes into H+ and OH-, it will break apart a molecule such as maltose into two glucose molecules. The reaction does not happen fast without either an enzyme (Lesson 6) or acid/heat (Lesson 5). The figure below shows the ratio of glucose monomer to the glucose subunit in starch. When starch is broken down, it is done by adding the water molecule to form the glucose. This is where the value for lbs glucose/lb starch is derived for the calculation above.

This image illustrates the hydrolysis of starch into glucose, providing both chemical structures and quantitative data to explain the reaction. On the left side, the molecular structures of glucose are shown in both alpha and beta forms, highlighting the different anomeric configurations of the sugar. These forms are the monomeric units that result from the breakdown of starch.
The central part of the image depicts the hydrolysis reaction, where water (H₂O) is added to starch, a polysaccharide composed of repeating C₆H₁₀O₅ units. This reaction cleaves the glycosidic bonds in starch, yielding glucose monomers (C₆H₁₂O₆). The image emphasizes the stoichiometry of the reaction by showing the molecular weights of the components: 162 g/mole for the starch subunit, 18 g/mole for water, and 180 g/mole for glucose.
On the right side, a calculation is presented to determine the mass yield of glucose from starch. It shows that 180 g of glucose corresponds to 1 mole, and when divided by the 162 g of starch per mole, the result is a conversion factor of 1.11 g of glucose per gram of starch. This quantitative relationship is useful for understanding the efficiency of starch hydrolysis in biochemical and industrial contexts.
6.3b How Corn is Processed to Make Ethanol
6.3b How Corn is Processed to Make EthanolThe process of making corn into ethanol is a multistep process. The first step is to milling the corn. It can be done by dry milling or wet milling. The figures below show the process steps for each wet and dry milling. For wet milling, the corn kernels are broken down into starch, fiber, corn germ, and protein by heating in the sulfurous acid solution for 2 days. The starch is separated and can produce ethanol, corn syrup, or food-grade starch. As is noted in the first figure a, the wet milling process also produces additional products including feed, corn oil, gluten meal, and gluten feed. Dry milling is a simpler process than wet milling, but it also produces fewer products. The main products of dry milling are ethanol, CO2, and dried distiller grain with solubles (DDGS). Let's go through each of the steps in the dry grind process. The five steps are: 1) grinding, 2) cooking and liquefaction, 3) saccharification, 4) fermentation, and 5) distillation.

Wet Milling Process.
Schematic of The Wet Milling Process
- First Corn is steeped. From steeping the corn the products are separated into:
- Starch/Gluten
- The Starch/Gluten goes through a further step of separation and the starch is combined with all the other starch.
- The wet gluten is then taken and dried to make a dry 60% protein gluten meal
- Starch
- The Starch goes through 3 separate processes
- Drying to make starches
- Fermentation to make ethanol chemical
- Syrup refining to make corn syrup, dextrose, and high fructose corn syrup
- The Starch goes through 3 separate processes
- Corn Germ/Fiber goes through grinding screening to yield
- Germ
- goes through oil refining to become corn oil
- Fiber
- Becomes feed product, wet feed
- Germ
- Starch/Gluten

Dry grind ethanol process.
This image presents a flowchart outlining the industrial process of converting corn into valuable products, primarily ethanol, carbon dioxide (CO₂), and distillers grains with solubles (DGS). The process begins with corn, which undergoes grinding to break it down into smaller particles. The ground corn is then cooked, a step that helps gelatinize the starches, making them more accessible for enzymatic action.
Next, the mixture is liquefied with the addition of enzymes and yeast, initiating the breakdown of complex carbohydrates. This is followed by saccharification, where enzymes further convert the liquefied starches into simple sugars.
At this point, the process diverges into two parallel pathways:
- Fermentation: The sugars are fermented by yeast, producing ethanol and CO₂ as byproducts. The fermented mixture then undergoes distillation to separate and purify the ethanol.
- Centrifugation: The remaining solids are separated to yield distillers grains, a high-protein byproduct used in animal feed.
From the distillation step, a liquid byproduct called thin stillage is processed through an evaporator, concentrating it into distillers solubles. These solubles are then combined with the distillers grains to form distillers grains with solubles (DGS), a nutrient-rich feed ingredient.
Grinding
For dry grinding corn, a hammermill or roller mill is used to do the grinding. The figure below is a schematic of a hammermill with corn being put through it. The hammers are attached to rods that turn on a rotor. As the rotor turns, the feed (corn in this case) is hammered against the wall. A screen at the bottom allows particles that are small enough to leave the unit and keep in the larger particles to continue to be hammered until all the material is in the correct size range. The grinding helps to break the tough outer coatings of the corn kernel, which will increase the surface area of the starch. Once the corn is broken down, it is mixed/slurried with heated water to form a mash or slurry.

Cooking and Liquefaction
Once the corn slurry (mash) is made, it goes through cooking and liquefaction. The cooking stage is also called gelatinization. Water interacts with the starch granules in the corn when the temperature is >60°C and forms a viscous suspension. Have you ever cooked with cornstarch to make thick gravy? The figure below shows a picture of starch mixed with water being poured into a heated sauce as it cooks. It will thicken with heat.

The liquefaction step is actually partial hydrolysis that lowers the viscosity. It is essentially breaking up the longer starch chains into smaller chains. One way to measure this is to look at dextrose equivalents (DE), or a measure of the amount of reducing sugars present in a sugar product, relative to glucose, expressed as a percentage on a dry basis. Dextrose is also known as glucose, and dextrose equivalent is the number of bonds cleaved compared to the original number of bonds. The equation is:
Pure glucose (dextrose): DE = 100
Maltose: DE = 50
Starch: DE = 0
Dextrins: DE = 1 through 13
Dextrins are a group of low molecular-weight carbohydrates produced by hydrolysis of starch or glycogen. Dextrins are mixtures of polymers of D-glucose units linked by α (1,4) or α (1,6) glycosidic bonds. Dextrins are used in glues and can be a crispness enhancer for food processing.
Maltodextrin: DE = 3 through 20
Maltodextrin is added to beer.
Recall that starch hydrolysis is where water reacts with the sugar to break the sugar down and form glucose. The water breaks into the H+ and OH- ions to interact with the starch as it breaks down.
In order to accomplish liquefaction, the reaction must take place under certain conditions. The pH of the mash is maintained in the range of 5.9-6.2, and ammonia and sulfuric acid are added to the tank to maintain the pH. About one-third of the required type of enzyme, α-amylase, can be added to the mash before jet cooking (2-7 minutes at 105-120°C) to improve the flowability of the mash. The jet cooking serves as a sterilization step to avoid bacterial contamination during the fermentation step later on. At this stage, shorter dextrins are produced but are not yet glucose.
Three types of processes can be utilized for liquefaction. The figure below shows the three options. Process 1 is where the α-amylase is added, and the material is incubated at 85-95°C. Process 2 has the mash in the jet cooker at 105-120ºC for 2-7 minutes, then flows to a flash tank at 90°C. α-Amylase is added three hours later. The third option, Process 3, adds the α-amylase, the heats in the jet cooker at 150°C, followed by flow to the flash tank at 90°C and adding more α-amylase.

The three option types for liquefaction processing of corn mash.
Three processes
Process Type 1
α-amylase added; incubated at 85-95ºC
Process Type 2
Jet cooker 105-120ºC for 2-7 minutes
Flash Tank to 90ºC; add α-amylase for 3 hours
Process Type 3
α-amylase added
Heating/Jet cooking @ 150ºC
Flash tank to 90ºC; add more α-amylase
The α-amylase for liquefaction acts on the internal α (1,4) glycosidic bonds to yield dextrins and maltose (glucose dimers). A type of α-amylase exists in the saliva of humans; a different α-amylase is utilized by the pancreas. The first figure below shows one type of α-amylase. The α-amylase works a little faster than the β-amylase, and the β-amylase works on the second α (1,4) glycosidic bond so that maltose is formed (see the second figure below). β-amylase is part of the ripening process of fruit increasing the sweetness of fruit as it ripens.

Schematic of an α-amylase.

Saccharification
The next step in the process of making ethanol is saccharification. Saccharification is the process of further hydrolysis of glucose monomers. A different enzyme is used, called glucoamylase (also known by the longer name amyloglucosidase). It cleaves both the α (1,4) and α (1,6) glycosidic bonds from dextrin ends to form glucose. The optimum conditions are different from the previous step and are at a pH of 4.5 and a temperature of 55-65°C. The figure below shows a schematic of the glucoamylase, which is also called a ϒ-amylase. There is a wide variety of amylase enzymes available that are derived from bacteria and fungi. The table below shows different enzymes, their source, and the action of each.

| Enzyme | Source | Action |
|---|---|---|
| α-Amylase | Bacillus amyloliquefaciens | Only α-1,4-oligosaccharide links are cleaved to give a-dextrins and predominantly maltose (G2), G3, G6, and G7 oligosaccharides |
| α-Amylase | B. licheniformis | Only α-1,4-oligosaccharide links are cleaved to give a-dextrins and predominantly maltose, G3, G4, and G5 oligosaccharides |
| α-Amylase | Aspergillus oryzae, A. niger | Only α-1,4 oligosaccharide links are cleaved to give a-dextrins and predominantly maltose and G3 oligosaccharides |
| Saccharifying a-amylase | B. subtilis (amylosacchariticus) | Only α-1,4-oligosaccharide links are cleaved to give a-dextrins with maltose, G3, G4 and up to 50% (w/w) glucose |
| β-Amylase | Malted barley | Only α-1,4-links are cleaved, from non-reducing ends, to give limit dextrins and b-maltose |
| Glucoamylase | A. niger | α-1,4 and α-1,6-links are cleaved, from the nonreducing ends, to give β-glucose |
| Pullulanase | B. acidopullulyticus | Only α-1,6-links are cleaved to give straight-chain maltodextrins |
Some of the newer developed enzymes (granular starch hydrolyzing enzymes – GSHE) allow skipping the liquefaction stage by hydrolyzing starch at low temperatures with cooking. Advantages include: 1) reduced heat/energy, 2) reduced unit operation (reducing capital and operating costs), 3) reduced emissions, and 4) higher DDGS. They work by “coring” into starch granules directly, without the water swelling/infusion. Disadvantages include: 1) enzymes cost more and 2) contamination risks.
Fermentation
The final chemical step in producing ethanol from the starch is fermentation. The chemical reaction of fermentation is, where 1 mole of glucose yields 2 moles of ethanol and 2 moles of carbon dioxide. The reaction is shown in Equation 2 below:
To cause fermentation to take place, yeast is added. A common yeast to use is saccharomyces cerevisiae, which is a unicellular fungus. The reaction takes place at 30-32°C for 2-3 days in a batch process. Supplemental nitrogen is added as ammonium sulfate ((NH4)2SO4) or urea. A protease can be used to convert proteins to amino acids to add as an additional yeast nutrient. Virginiamycin and penicillin are often used to prevent bacterial contamination. The carbon dioxide produced also lowers pH, which can reduce the contamination risk. Close to 90-95% of the glucose is converted to ethanol.
It is possible to do saccharification and fermentation in one step. It is called Simultaneous Saccharification and Fermentation (SSF), and both glucoamylase and yeast are added together. It is done at a lower temperature than saccharification (32-35°C), which slows the hydrolysis into glucose. As glucose is formed, it is fermented, which reduces enzyme product inhibition. It lowers initial glucose concentrations, lowers contamination risk, lowers energy requirements, and produces higher yields of ethanol. Because SSF is done in one unit, it can improve capital costs and save residence time.
Distillation and Increase of Ethanol Concentration
The last phase of ethanol production is the processing of ethanol to increase the ethanol concentration. Downstream from the fermenters, the ethanol concentration is 12-15% ethanol in water (which means you have 85-88% water in your solution!). Distillation was mentioned in an earlier lesson; crude oil must be distilled into various boiling fractions to separate the oil into useable products. Distillation is a process of separating components using heat and specially designed towers to keep the liquid flowing downward and the vapors being generated to flow upwards. Water boils at 100°C, while ethanol boils at 78°C. However, because water and ethanol evaporate at a lower temperature than their boiling points, and because they both have OH functional groups that are attracted to each other, ethanol and water molecules are strongly bound to each other and form an azeotrope together. That just means that you cannot completely separate ethanol from water – the ethanol fraction will contain about 5% water and 95% ethanol when you get to the end of the distillation process. The figure below shows a schematic of a distillation unit. You don’t want water in gasoline as you drive because it prevents efficient combustion. Do you want water in your ethanol if you use it as a fuel?

The answer is no, so you must use an additional method to remove all the water from ethanol. The method is called dehydration. The unit that is used is called a molecular sieve, and the material used in it is called zeolite. Under these conditions, the zeolite absorbs the water into it, but the ethanol will not go into the zeolite. They use what is called a pressure-swing adsorption unit. The unit is designed to run in two modes. At high pressure, the ethanol is dehydrated in Unit 1, and at low pressure, anhydrous ethanol is fed through to remove the water from Unit 2. When the zeolite sieve has absorbed all the water, Unit 1 is switched to become the low-pressure regenerating bed, and Unit 2 becomes the high-pressure unit. The residence time for the process is 3-10 minutes. The zeolite for this process is a highly ordered aluminosilicate with well-defined pore sizes that are formed into beads or included in a membrane. The zeolites attract both water and ethanol, but the pore sizes are too small to allow the ethanol to enter. The pore size of the zeolite membrane is 0.30 nm, while the size of the water molecule is 0.28 nm and the ethanol 0.44 nm. Depending on the type of unit, the membrane or beads can be regenerated using heat and vacuum, or by flowing the pure ethanol through the unit as well as described above.

The first unit is the dehydrator to remove water while the second unit is having the water removed.
The diagram shows 95% EtOH vapor from distillation going into Unit 1: a high-pressure dehydrating bed. Out of that 60-85%, EtOH goes to the final product while 15-40% of the EtOH enters unit 2, a low-pressure vacuum regenerating bed. Out of this, the wet EtOH Vapor goes back to distillation.


Once we have fermented the material to ethanol, it goes through a series of processes to obtain the products in the form that we want them. The first figure below is a schematic of product recovery, and the second figure shows the definitions of some of the terminology.

Product recovery diagram of ethanol and other products.
Product recovery diagram of ethanol and other products. From fermentation, CO2 is recovered along with Beer: 12-13% Ethanol. From there, distillation occurs. This recovers 95% ethanol, which goes through a molecular sieve to become 100% ethanol and goes into denatured ethanol storage with gasoline. From distillation, whole stillage is also recovered. This goes into separation/centrifugation and yields thin stillage and WDG. The thin stillage is either recycled or it goes into the evaporator and becomes syrup. The WDG and syrup are combined to become WDGS. The WDGS goes into the dry and becomes DDGS.

Product separation/recovery terminology.
The image defines terminology as follows:
Whole Stillage (waste liquid from distillation) goes to centrifuge or filter presses.
Thin Stillage (liquid from centrifuge) is recycled or evaporated to make
Syrup (solubles) which are added to the
WDG (Wet distillers grains) which are then dried to make
DDGS (Distiller Dried Grains with Solubles)
To summarize, corn has 62% starch, 19% protein, 4% oil, and 15% water. If you look at the products on a dry basis (you don’t look at the water like a product), 73% of the corn is starch and 27% is protein, fiber, and oil. For every bushel of corn, realistically you’ll generate 2.8 gallons of ethanol, ~17 lbs of CO2, and ~17 lbs of DDGS. We’ll look at the economics of this process and a couple of other processes in a later lesson.
So, at this point, you can see how to generate ethanol from corn. If you want to generate ethanol from cellulose in plants, you have the information from Lesson 6 to generate glucose from cellulose (it is a more involved process), but once you have glucose, you can use the same end steps in ethanol production from the fermentation of glucose. In the next section, we’ll look at the production of another alcohol, butanol.
6.4 Butanol Production
6.4 Butanol ProductionAnother alcohol that can be generated from starch or cellulose is butanol, a four-carbon chain alcohol. There are usually two isomers: normal butanol (n-butanol) and iso-butanol. Their structures, along with ethanol, are shown below:
| Name | Atoms and Bonds | Stick Representation |
|---|---|---|
| n-Butanol (4 C atoms) |  |  |
| Ethanol (2 C atoms) |  |  |
| Isobutanol (4 C atoms) |  |  |
There are some advantages of butanol when compared to ethanol:
- It has a higher energy content than ethanol.
- It is less hydrophilic than ethanol (less attracted to water).
- It is more compatible with oil and its infrastructure.
- It has a lower vapor pressure and higher flash point than ethanol (evaporates less easily).
- It is less corrosive.
- N-butanol works very well with diesel fuel.
- Both n-butanol and iso-butanol have good fuel properties.
The table below shows a comparison of the energy content of various fuels in Btu/gal. The higher the value, the more miles per gallon one can achieve; the Btu/gal value of butanol is close to the value of gasoline, and is higher than ethanol.
| Fuel | Energy Content (Btu/gal) |
|---|---|
| Gasoline | 114,800 |
| Diesel fuel | 140,000 |
| Methanol | 55,600 |
| Ethanol | 76,100 |
| Butanol | 110,000 |
Butanol production is also a fermentation process – we’ll go over the differences in a little bit. There is a history regarding butanol production. It was known as the ABE process, or acetone, butanol, and ethanol process. It was commercialized in 1918 using an enzyme named Clostridium acetobutylicum 824. Acetone was needed to produce Cordite, a smokeless powder used in propellants that contained nitroglycerin, gunpowder, and a petroleum product to hold it together – the acetone was used to gelatinize the material. In the 1930s, the butanol in the product was used to make butyl paints and lacquers. It has also been reported that Japanese fighter planes used butanol as fuel during WWII. The process of ABE fermentation was discontinued in the US during the early 1960s due to unfavorable economic conditions (made less expensively using petroleum). South Africa used the process into the 1980s, but then discontinued. There are reports that China had two commercial biobutanol plants in 2008, and currently, Brazil operates one biobutanol plant. There are three species of enzymes commonly used for butanol fermentation because they are some of the highest producers of butanol: Clostridium acetobutylicum 824, Clostridium beijerinckii P260, and Clostridium beijerinckii BA101. The figures below show micrographs of two of the fermentation enzymes used for butanol production.


As in the conversion of starch to ethanol, the plants must be processed in a similar way, so I won’t repeat the five steps we just covered – we just use different enzymes, and end processing may be different because of the different chemicals produced. Starch must be hydrolyzed in acid before using the enzyme. And, as with using cellulose and hemicellulose as the starting material, it must first be pretreated to separate out the cellulose, then treated again to eventually produce glucose in order to make butanol from fermentation. Remember the glucose-to-ethanol reaction? Starch will produce the following products: 3 parts acetone (3 CH3-CO-CH3), 6 parts butanol (6 CH3-CH2-CH2-CH2OH), and 1 part ethanol (1 CH3-CH2-OH).
So, what feed materials are used for butanol production? Similar to what is used for ethanol production, which includes: 1) grains, including wheat straw, barley straw, and corn stover, 2) by-products from paper and sugar production, including waste paper, cotton woods, wood chips, corn fiber, and sugarcane bagasse, and 3) energy crops including switchgrass, reed canarygrass, and alfalfa. The table below shows the costs of various biomass sources.
| Source | Price ($/ton) |
|---|---|
| Wheat straw | 24 |
| Barley straw | 26 |
| Oat straw | 32 |
| Pea straw | 44 |
| Grass hay | 50 |
| Corn stover | 50 |
| Switchgrass | 60 |
| Corn | 260 (varied from 73-260) |
The price and the availability of feeds determine what might be used to produce various biofuels. The feeds most available in the US are corn stover (2.4 x 10⁸ tons/year) and wheat straw (4.9 x 10⁷ tons/year). Other biomass substrates include corn fiber, barley straw, and corn fiber at ~4-5 x 10⁶ tons/year. Yields of butanol from corn and corn products by fermentation are shown in the table below.
| Ferment* Parameters | Glucose | Cornstarch | Maltodextrins | Soy Molasses | Ag Waste | Pack Peanuts |
|---|---|---|---|---|---|---|
| Acetone (g/L) | 3-7 | 3-7 | 3-7 | 2-4 | 1-5 | 5-7 |
| Butanol (g/L) | 7-20 | 7-20 | 7-19 | 7-18 | 1-10 | 1-16 |
| Ethanol (g/L) | 0.3-1 | 0.3-1 | 0.5-1.7 | 0.3-0.6 | 0.2-1 | 0.3-1 |
| Total ABE (g/L) | 14-26 | 14-26 | 14-27 | 14-23 | 5-16 | 5-22 |
| ABE yield g/g | 0.33-0.42 | 0.33-0.44 | 0.33-0.50 | 0.33-0.39 | 0.18-0.39 | 0.34-0.38 |
The solventogenic Clostridium species can metabolize both hexose and pentose sugars, which are released by cellulose and hemicellulose in wood and agricultural wastes; this is an advantage over other cultures used to produce biofuels. If all the residues available were converted into acetone-butanol (AB), the result would produce 22.1 x 10⁹ gallons of AB. In 2009, 10.6 x 10⁹ gallons of ethanol was produced, but that was only equivalent to 7.42 x 10⁹ gallons of butanol on an equal energy basis.
There are several issues that are a challenge to producing AB in a traditional batch process: 1) product (butanol) concentration is low 13-20 g/L, 2) incomplete sugar utilization (<60 g/L), and 3) the process streams are large. These issues are due to severe product inhibition. Other issues include: 1) butanol glucose yield low, 22-26%, 2) butanol concentration in fermentation is low, 1.5%, 3) butanol concentration of 1% inhibits microbial cell growth, 4) butanol fermentation is in two phases, and 5) feedstock cost is high.
One of the more important considerations of butanol production is limiting the microbial inhibitory compounds. These compounds include some compounds related to lignin degradation, including syringaldehyde, coumaric acid, ferulic acid, and hydroxymethylfurfural.
As an example of one particular process, wheat straw was processed using a separate hydrolysis, fermentation, and recovery process. The following conditions were used: 1) wheat straw milled to 1-2 mm size particles, 2) dilute sulfuric acid (1% v/v) pretreatment at 160 C for 20 min., 3) mixture cooled to 45 C and hydrolyzed with cellulase, xylanase, and β-glucosidase enzymes for 72 h, followed by centrifugation and removal of sediments, 4) fermentation with C. beijerinckii P260 (fermentation gases CO2 and H2 were released to the environment, but could be captured, separated and used in other processes, and 5) butanol removed by distillation. For this particular process, the production of ABE was relatively high, with butanol and acetone being the major products. The reaction was done in a batch reactor and no treatment was used to remove inhibitor chemicals. The table below shows the process with wheat straw, barley straw, corn stover, and switchgrass. Wheat straw did not need to be detoxified, but the others did. Detoxification can be done by adding lime (a weak base) or using a resin column to separate out the components.

A schematic diagram of acetone butanol ethanol (ABE) production.
ABE production. The wheat straw goes into milling and then into treatment where it is treated with H2SO4, BuOH and water. It then goes into hydrolysis with enzymes. Out of hydrolysis, Lignin is removed and the rest of the product continues to fermentation. During fermentation, CO2 and H2 are removed and after fermentation, the solids are removed. After that Acetone and ethanol are recovered.
So, what can be done to overcome butanol toxicity? What kind of downstream processing needs to be done to separate out the wanted components? The butanol level in the reactor has to be kept to a certain threshold in order to reduce toxicity to the culture and utilize all the sugar reactants.
First of all, these are the typical processing steps that must be utilized in some form for most refining units (the upstream processing includes pretreating the raw material, similar to what we discussed in Lesson 5): 1) sorting, 2) sieving, 3) communition (size reduction by milling), 4) hydrolysis, and 5) sterilization. The next main stage is the bioreaction stage: metabolite biosynthesis and biotransformations. The final aspect of processing is downstream processing, and the methods used depend on the products made. To separate solids, filtration, precipitation, and centrifugation take place. Flocculation can also be done. To separate liquids, several processes can be done: 1) diffusion, 2) evaporation, 3) distillation, and 4) solvent-liquid extraction.
For butanol processing, there have been several processes developed to reduce the level of toxicity. These include: 1) simultaneous saccharification, fermentation, and recovery (SSFR), 2) gas stripping (using N2 and/or fermentation gases – CO2 and H2), 3) cell recycling, 4) pervaporation (combination process of permeation/evaporation using selective membranes), 5) vacuum fermentation, 6) liquid-liquid extraction, and 6) perstraction (combination of solvent extraction and membranes for permeation). The goal is to convert all the sugars to acetone and butanol but remove the products as they are produced to decrease toxicity. We’ll discuss more about liquid-liquid extraction (or solvent extraction) when we get to the lesson on biodiesel.
| Wheat straw | Before detoxification | After detoxification |
|---|---|---|
| ABE (g/L) | 25.0-28.2 | No detox required |
| Productivity (g/L•h) | 0.63-0.71 | -- |
| Barley straw | Before detoxification | After detoxification |
|---|---|---|
| ABE (g/L) | 7.1 | 26.6 |
| Productivity (g/L•h) | 0.10 | 0.39 |
| Corn Stover | Before detoxification | After detoxification |
|---|---|---|
| ABE (g/L) | 0.00 | 26.3 |
| Productivity (g/L•h) | 0.00 | 0.31 |
| Switch Grass | Before detoxification | After detoxification |
|---|---|---|
| ABE (g/L) | 1.5 | 13.1 |
| Productivity (g/L•h) | <0.02 | <0.03 |
6.5 Assignments Overview
6.5 Assignments OverviewReminder
Remember that your Final Project Outline Report will be due next week.
Discussion #1
Please read the following selections. You can find a link to these readings in the Readings section of Lesson 6.
- Bourzac, K. (2009, July 9). Biofuel Plant Opens in Brazil.
- News Release from University of York (2022, September 7). Climate Change Puts Availability of Vital Renewable Energy Source at Risk, Research Reveals
Write a paragraph discussing how these articles relate to biomass production and sustainability.
After posting your response, please comment on at least one other person's response. Discussions will be reviewed, and grades will reflect critical thinking in your input and responses. Don't just take what you read at face value; think about what is written.
6.6 Summary and Final Tasks
6.6 Summary and Final TasksSummary
This lesson continued from the previous lesson, but went into greater depth with the processing aspects of ethanol production. Starch and cellulose must first be converted into glucose before fermentation into ethanol and CO2. Starch feedstocks include sugarcane in Brazil, sugarbeets in Europe, and corn in the US. In order to process corn, there are five steps: grinding, cooking and liquefaction, saccharification, fermentation, and distillation. Enzymes are needed in saccharification, and yeast is needed in fermentation. Cellulose to glucose requires some additional steps and enzymes in order to break the structure down, but once it gets to the glucose stage, all the processing is the same. Because the water in the ethanol must be removed for use as a fuel, the last steps include distillation and a molecular sieve.
Butanol can be produced in a similar way, but acetone and ethanol also accompany butanol processing. Different enzymes are used. While the concentration of butanol is low when converting from feed materials, butanol has some advantages over using ethanol; it mixes better with gasoline and has a higher energy content.
Lesson Objectives
By the end of this lesson, you should be able to:
- explain similarities and differences between sugar-based and starch-based ethanol production, as well as butanol production;
- describe the differences between wet and dry milling of corn;
- explain process steps in dry milling ethanol and butanol production;
- identify important co-products from corn ethanol and butanol production;
- evaluate the largest factors that affect the economics of ethanol and butanol production.
References
Pryor, Scott; Li, Yebo; Liao, Wei; Hodge, David; “Sugar-based and Starch-based Ethanol,” BEEMS Module B5, USDA Higher Education Challenger Program, 2009-38411-19761, 2009.
Bothast, R.J., Schilcher, M.A., Biotechnological processes for conversion of corn into ethanol, Appl. Microbiol. Biotechnol., 67, 19-25, 2005.
Reminder - Complete all of the Lesson tasks!
You have reached the end of this Lesson! Double-check the Road Map on the Lesson Overview page to make sure you have completed all of the activities listed there before you begin the next lesson.
Questions?
If there is anything in the lesson materials that you would like to comment on, or don't quite understand, please post your thoughts and/or questions to our Throughout the Course Questions & Comments discussion forum and/or set up an appointment during office hours. While you are there, feel free to post responses to your classmates if you can help.
Lesson 7: Thermochemical Methods to Produce Biofuels
Lesson 7: Thermochemical Methods to Produce BiofuelsOverview
In previous lessons, we discussed producing ethanol and butanol using enzymes. However, there are limits to how ethanol and butanol will be utilized – they will most likely be used like gasoline (for automobiles). If you recall from previous lessons, while gasoline is the main fuel, other fuels are also produced, i.e., jet fuel, diesel fuel, and fuel oil. These fuels are produced to be used in engines other than the automobile gasoline engine and are therefore a different structure. In this lesson, we will see how to produce liquid fuels from biomass for use in jet engines (a medium chain length) using thermochemical direct and indirect liquefaction. We will spend more time on making biodiesel from vegetable oils, plant oils, and animal fats, in a future lesson.
Lesson Objectives
By the end of this lesson, you should be able to:
- explain the chemical characteristics of heavier fuels such as jet fuel and diesel fuel;
- explain thermochemical processes used to produce higher molecular weight compounds, from direct and indirect methods;
- evaluate how thermochemical processes are different from enzymatic processes.
Lesson 7 Road Map
This lesson will take us one week to complete. Please refer to the Course Syllabus for specific time frames and assignment due dates.
Questions?
If there is anything in the lesson materials that you would like to comment on or don't quite understand, please post your thoughts and/or questions to our Throughout the Course Questions and Comments discussion forum. The discussion forum will be checked regularly. While you are there, feel free to post responses to your classmates if you are able to help. Regular office hours will be held to provide help for EGEE 439 students.
7.1 Review of Refinery Processing and Chemical Structures for Jet Fuel and Diesel Fuel
7.1 Review of Refinery Processing and Chemical Structures for Jet Fuel and Diesel FuelRecall from Lesson 2 the general schematic of a refinery, shown below. Jet fuel is typically in the middle distillate range, also known as naphtha and kerosene. Diesel fuel is heavier (higher molecular weight and longer long-chain hydrocarbons). These fuels do not require as much processing because they can be obtained primarily from the distillation of oil, but because of sulfur/oxygen/nitrogen functional groups and high molecular weight waxes, these fuels must have these components removed. They are hydrotreated (hydrogen is added, sulfur/oxygen/nitrogen is removed, and aromatics are made into cycloalkanes). Waxes are also separated out.

Primary processes that are typical in a petroleum refinery.
This is a simple flow diagram of a crude oil refinery.
Crude oil enters and goes to distillation.
From distillation:
LPG (gases) goes through alkylation to become O.N. 100 Motor Fuel Alkylate which can go on to become gasoline
Straight-run gasoline goes through catalytic reforming to become O.N. 95 Reformate which can go on to become gasoline
Naphtha, Kerosene, and Diesel all go through Hydrotreating and then dewaxing to become either treated Kerosene, Diesel (low sulfur) or lubricating oils.
Fuel Oil goes through a catalytic cracker to become O/N 90-95 Gasoline
Resid goes through Thermal Cracking to become either Carbon, Asphalt, or O.N. 75 Gasoline.
The primary structure we want for jet fuel and diesel fuel is:
| Name | Atoms and Bonds | Stick Representation |
|---|---|---|
| Heptane (7 C atoms) |  |  |
| Name | Atoms and Bonds | Stick Representation |
|---|---|---|
| Cyclohexane (6 C atoms) |  |  |
The table below also shows a list of different chemicals and the properties of each. This table is mainly focused on those chemicals that would be in jet and diesel fuels.
| Name | Number of C Atoms | Molecular formula | bp (0C), 1 atm | mp (0C) | Density (g/mL)(@200C) |
|---|---|---|---|---|---|
| Decane | 10 | C10H22 | 174.1 | -30 | 0.760 |
| Tetradecane | 14 | C14H30 | 253.5 | 6 | 0.763 |
| Hexadecane | 16 | C16H34 | 287 | 18 | 0.770 |
| Heptadecane | 17 | C17H36 | 303 | 22 | 0.778 |
| Eicosane | 20 | C20H42 | 343 | 36.8 | 0.789 |
| Cyclohexane | 6 | C6H12 | 81 | 6.5 | 0.779 |
| Cyclopentane | 5 | C5H10 | 49 | -94 | 0.751 |
| Benzene | 6 | C6H6 | 80.1 | 5.5 | 0.877 |
| Naphthalene | 10 | C10H8 | 218 | 80 | 1.140 |
| Tetrahydronaphthalene(tetralin) | 10 | C10H12 | 207 | -35.8 | 0.970 |
| Decahydronaphthalene(decalin) | 10 | C10H18 | 187,196 | -30.4, -42.9 | 0.896 |
7.2 Direction Liquefaction of Biomass
7.2 Direction Liquefaction of Biomass
There are differences for each of the thermal processes, as described in Lesson 4. Here we focus on direct liquefaction. Direct liquefaction (particularly hydrothermal processing) occurs in a non-oxidative atmosphere, where the biomass is fed into a unit as an aqueous slurry at lower temperatures, with bio-crude in the liquid form being the product. The primary focus of these particular processes is to produce a liquid product that is a hydrocarbon with an atomic H:C ratio of ~2, and a boiling range of 170-280 °C.
Many of the processes developed are based on coal-to-liquid processing. The main purposes of taking coal and biomass into a liquid are to produce liquids, to remove some of the less desirable components (i.e., sulfur, oxygen, nitrogen, minerals), and to make a higher energy density material that will flow.
One of the primary processes to convert coal into liquids directly is through a combination of thermal decomposition and hydrogenation under pressure. There are several single and two-stage processes that have been developed but have not been made commercial in the US. However, China opened a commercial direct liquefaction plant partially based on US designs in 2008. The first figure below shows the general schematic of the plant. The next figure shows the products they make. Design considerations include 1) temperatures of ~400-450°C, 2) hydrogenation catalysts, 3) hydrocarbon solvents that are similar to fuels, 4) naturally occurring aromatics in coal, 5) sulfur, nitrogen, minerals that must be removed in refining of the liquid. Biomass can be processed in a similar manner, but biomass has significantly more oxygen and fewer aromatic compounds and decomposes differently than coal. Other processes have been developed for biomass, that appear to do a better job of processing cellulose. One process is hydrothermal processing in pressurized water using an acid catalyst such as LaCl3 at 250°C - we won't go into more detail here, but it is different from the direct liquefaction discussion in the next paragraph.

Direct coal liquefaction schematic from Shenhua plant in China.
Schematic of Direct Coal Liquefaction.
Air enters the system and goes through air separation. This produces N2 and O2. N2 goes towards coal preparation and O2 goes to gasification and purification.
The coal enters the system and goes to coal preparation. Following preparation it can either go to gasification and then on to purification and liquefaction or upgrading. Or it can go into a coal slurry preparation process. This process requires a catalyst and a solvent. Following treatment, the slurry begins liquefaction, followed by separation. Following separation, the residue is removed, and the solvent is recycled. The rest of the product goes to upgrading where H2 is introduced. From upgrading the coal goes to fractionation which yields gas, naptha, jet fuel, and diesel.

So, what are the differences with direct liquefaction of biomass? On the surface, it looks pretty much the same as the process of coal liquefaction. It is a thermochemical conversion process of organic material into liquid bio-crude and co-products. Depending on the process, it is usually conducted under moderate temperatures (300-400°C, lower than coal liquefaction) and pressures (10-20 MPa, similar or maybe a little higher with primarily hydrogen in coal to liquids) with added hydrogen or CO as a reducing agent. Unlike coal, biomass is “wet”, or at least wetter than coal, and can be processed as an aqueous slurry. When processed as an aqueous slurry, the process is referred to in the literature as hydrothermal processing and can be subcritical to supercritical for water. The figure below shows the conditions for supercritical water; water behaves more like an acid/base system under these conditions. Thus, it can also be a catalyst. There is also a high solubility of organic material in water under these conditions. This mainly occurs along the liquid/vapor line. The basic reaction mechanisms can be described as:
- depolymerization of biomass;
- decomposition of biomass monomers by cleavage, dehydration, decarboxylation, and deamination;
- recombination of reactive fragments.
Different types of biomasses react differently depending on the biomass source. Carbohydrates, such as cellulose, hemicellulose, and starch can decompose in hydrothermal water. The typical product formed under these conditions is glucose, and glucose can then be fermented to make alcohol or further degrade in water to make glycolaldehyde, glyceraldehyde, and dihydroxyacetone. The products made depend on the conditions: at temperatures, ~180°C, products are sugar monomers, but at higher temperatures, 360-420°C, the aldehyde, and acetone compounds are formed.

Lignin and fatty acids also decompose in hydrothermal water, but the products are very different because the substrate is different. For lignin, the products are similar to the building blocks for lignin, (p-coumaryl, coniferyl, and sinapyl alcohols), although the functional groups vary depending on the hydrothermal conditions. Bembenic and Clifford used hydrothermal water at 365°C and ~13 MPa to form methoxy phenols, using different gases to change the product slate (hydrogen, carbon monoxide, carbon dioxide, and nitrogen). For lipid or triglyceride (fats and oils) reaction in hydrothermal water at 330-340°C and 13.1 MPa, the main products are the free fatty acids (HC – COOH) and glycerol (C3H8O3). The free fatty acids can then be reacted to straight-chain hydrocarbons that can be used for diesel or jet fuel, although the temperature usually needs to be a little higher (400°C) for this to take place. The figure below shows the schematic of a hydrothermal water process to convert algae into liquid fuels, making use of heat from an integrated heat and power system. Flue gas from a power generation facility is used to grow algae. Algae is then harvested and concentrated in water. The algae are then reacted in a hydrothermal unit followed by catalytic hydrogenation to make the straight-chain hydrocarbon liquid fuels.

Schematic for hydrothermal liquefaction of algae for production of liquid fuels (diesel, jet fuel).
Schematic for hydrothermal liquefaction of algae. First, the algae are grown, flue gas enters along with water, nutrients, and recycled CO2. Evaporation occurs during this period. After growth, the next step is cell concentration/dewatering (settling, dissolved air flotation, and centrifugation). Next is hydrothermal liquefaction (HTL) and the aqueous phase is removed. Finally, catalytic is hydrotreating and product fractionation. Here hydrogen gas from a hydrogen plant is added. This process yields hydrocarbon biofuels. In the diagram, all of these steps have double-headed arrows pointing to heat integration and power generation (catalytic hydrogasification (CHG) + Biogas Combustion).
Many types of catalysts can be used, although it depends on the process stage in which catalysts are used and what feed material is used. In hydrothermal processing, the more common catalysts used are acid and base catalysts. Particle size for biomass needs to be fine, with a size of < 0.5 mm. The introduction of the feed into the reactor is also challenging, as it is fed into a high-pressure reactor. Some advantages of using this process for biomass: 1) it is possible to process feeds with high water content, as much as 90%, 2) it is possible to process many different types of waste materials, including MSW, food processing waste, and animal manure, and 3) the process serves the dual roles of waste treatment and renewable energy production.
Process parameters include solids content, temperature, pressure, residence time, and use of catalysts. Often simultaneous reactions are taking place, which makes the overall understanding of the reactions complicated. The types of reactions taking place include solubilization, depolymerization, decarboxylation, hydrogenation, condensation, and hydrogenolysis.
For one particular process, hydrothermal liquefaction requires the use of catalysts. One typical catalyst used is sodium carbonate combined with water and CO to produce sodium formate:
This dehydrates the hydroxyl groups to carbonyl compounds, then reduces the carbonyl group to an alcohol:
The formate and hydrogen can be regenerated and recycled. Other catalysts used that behave in a similar manner include K2CO3, KOH, NaOH, and other bases. For simultaneous decomposition and hydrogenation, nickel (Ni) catalysts are used.
Similar to pyrolysis, the major product of this process is a liquid biocrude, which is a viscous dark tar or asphalt material. Up to 70% of the carbon is converted into biocrude; lighter products are obtained when different catalysts are used. Co-products include gases (CO2, CH4, and light hydrocarbons) as well as water-soluble materials. The liquid biofuel has a similar carbon-to-hydrogen ratio as in the original feedstock and is a complex mixture of aromatics, aromatic oligomers, and other hydrocarbons. In this process, the oxygen is reduced and is 10-20% less than typical pyrolysis oils, with a heating value higher than pyrolysis oils, 35-40 MJ/kg on a dry basis. However, the USDA has developed a pyrolysis process using recycled gases that produces a fairly light hydrocarbon with very little oxygen content. (Mullens et al.) I will discuss this more in the next section. The table below shows a comparison of biocrudes from various processes and feed materials. The quality of the biocrude shown from hydrothermal processing is for a heavy biocrude. Other processes will make a lighter material, but also produce more co-products that must be utilized as well.
| Characteristic | Hydrothermal Bio-oil | Fast pyrolysis Bio-oil | Heavy Petroleum Fuel | USDA Oil Oak | ||
|---|---|---|---|---|---|---|
| Water Content, wt% | 3-5 | 15-25 | 0.1 | 4.8 | ||
| Insoluble solids, % | 1 | 0.5-0.8 | 0.01 | n/a | ||
| HHV, MJ/kg | 30 | 17 | 40 | 34.0 | ||
| Density, g/ml | 1.10 | 1.23 | 0.94 | n/a | ||
| Viscosity, cp | 3,000-17,000 | 10-150 | 180 | n/a | ||
| Wet | Dry | Wet | Dry | |||
| Carbon, % | 73.0 | 77.0 | 39.5 | 55.8 | 85.2 | 80.2 |
| Hydrogen, % | 8.0 | 7.8 | 7.5 | 6.1 | 11.1 | 5.9 |
| Oxygen, % | 16.0 | 13.0 | 52.6 | 37.9 | 1.0 | 11.8 |
| Nitrogen, % | <0.1 | <0.1 | <0.1 | <0.1 | 0.3 | 2.1 |
| Sulfur, % | <0.05 | <0.5 | <0.05 | <0.5 | 2.3 | n/a |
| Ash, % | 0.3-0.5 | 0.3-0.5 | 0.3-0.5 | 0.2-0.3 | <0.1 | n/a |
BEEMS Module, He, Hu, and Li. Mullens et al., USDA.
7.3 Bioprocessing to Make Jet Fuel
7.3 Bioprocessing to Make Jet FuelMany researchers and scientists think that ground transportation will become increasingly dependent upon batteries, as in hybrids and electric vehicles. Reduction in fuel usage has been realized in the last 10 years, due to hybrid automobiles coming into the auto-market. However, this is not a viable option for air travel, which will remain dependent on liquid fuel. Since more fuel will be available for aircraft if less is used for vehicles, petroleum refineries should be able to keep up with demand. However, if there is a concern about emissions, especially the need to reduce CO2, liquid jet fuels from biomass will by far be the best option. Jet fuel must also go through a qualification process and become certified for use, depending on the source of the fuel and the type of jet engine. As discussed briefly in Lesson 2, jet fuel should have certain properties. The table below shows some of the ASTM qualifications for jet fuel that currently exist.
| Category | JP-8 spec limits, Min | JP-8 spec limits, Max |
|---|---|---|
| Flashpoint, °C | 38 (min.) | -- |
| Viscosity, cSt, -20°C | -- | 8.0 (max.) |
| Freezing point, °C | -- | -47 (max.) |
| Smoke pt., mm | 19 (min.) | -- |
| Sulfur , wt% | -- | 0.3 (max.) |
| Aromatics, % | -- | 25 (max.) |
| Thermal stab.@ 260°C | -- | 25 mm (max.) |
| Calorific value, Btu/lb | 18,400 | -- |
| Hydrogen content | 13.4 | -- |
| API gravity, 60° | 37.0 | 51.0 |
| FSII (DiEGME) | 0.10 | 0.15 |
| Conductivity pS/m | 150 | 600 |
The Federal Aviation Administration has been working diligently to get some alternative fuels available in the market. The government has aspirational goals for American airlines to utilize alternative jet fuel, with the hope of 1 billion gallons of alternative jet fuel per year by the year 2018. Airlines will need to meet this requirement either by purchasing alternative jet fuel or finding viable methods to produce alternative jet fuel. The expectations for jet fuel are that it be primarily composed of long-chain alkanes (although shorter carbon chain lengths than diesel fuel) with some cycloalkane and/or aromatic content for the necessary O-ring lubrication and other reasons.
There are several known biomass materials that could be utilized in the production of jet fuel. These include fats/oils, cellulose, woody biomass, and coal.
One of the primary sources is vegetable oil (this also includes algae oil and fats from the production of meats). Vegetable oils contain long-chain hydrocarbons connected by three carbons as esters. The fatty acid portion of the oil is easily converted into fatty acid methyl esters (FAMEs) through transesterification to produce biodiesel. We will discuss biodiesel production for transesterification extensively in another lesson, but I will briefly discuss here why the FAA is interested in making jet fuel from fats and oils. Unfortunately, currently, FAMEs are an issue for bio jet fuel and requirements include a limit of 5 ppm, as the FAMEs can cause corrosion, have a high freeze point, and are not compatible with materials in a jet engine. (Fremont, 2010) At present, biodiesel production is not always economical due to the high cost of oils and the method of production, and the ester must be removed for jet fuel.
Therefore, other methods are being evaluated to produce not only biodiesel but also biojet fuel. These process methods include Hydroprocessed Esters and Fatty Acids (HEFA), Catalytic Hydrothermolysis, and Green Diesel. (Hileman and Stratton, 2014) The figure below shows a schematic of the process for HEFA. Jet fuel made from HEFA has been approved for use in airplanes because it has gone through the approval process. The following white paper, Alternative Fuels Specification and Testing, (Kramer, S., 2013, March 1, Retrieved December 16, 2014) includes a schematic of the approval process on page 4; as you can see, it is a thorough and complicated process, and it takes quite some time to get a particular type of fuel qualified.
There are others who want to explore the use of the fluid catalytic cracking (FCC) unit in a refinery to convert vegetable oils into jet fuel. Al-Sabawi et al. (CanmetENERGY) provided a review of various biomass products that have been processed at a lab scale in the FCC unit. They show that the main effect would be on the catalyst used and the lifetime of the catalyst. (Al-Sabawi, 2012)

Renewable jet process diagram for HEFA-produced jet fuel.
Schematic of Renewable Jet Processing for HEFA-produced Jet Fuel
Natural Oils, Fats, and Greases are processed. First, they go into a hydrogen-rich environment and undergo deoxygenation. Water and CO2 are removed during this step. From there, the products go into another hydrogen-rich environment and undergo selective hydrocracking. Following hydrocracking, the products are separated. Any H2 is recycled, and the products become light fuels, green jet fuel, synthetic paraffinic Kerosene (SPK), and green diesel.
Mullens and Boateng of the USDA have developed a process to produce pyrolysis oils of low oxygen content (data on properties of fuel in the previous section). (Mullens, 2013) The review paper by Al-Sabawi et al. also discusses the potential processing of pyrolysis oils in the FCC unit. The main requirement is the pyrolysis oils need to be low in oxygen, but additional information on the composition of the oil could tell us whether the FCC unit or another unit in a refinery would be best for processing.
Cellulosic sources for producing alternative jet fuel can be used. By use of gasification of biomass and Fischer-Tropsch processing, a good biojet fuel can be produced, although some additives need to be included to prevent some potential problems. There are also processes to produce medium chain-length alcohols from cellulose, as methanol and ethanol do not have the energy density necessary to allow planes to fly long distances. One of the fuels that made it through the approval process is Synthetic Paraffinic Kerosene (SPK) made by Fischer-Tropsch synthesis. (Hileman and Stratton, 2014) It may also be possible to use by-products from the production of ethanol from corn (corn stover), sugar cane (bagasse), and paper production (tall oil). Westfall et al. (2008) and Liu et al. (2013) have also outlined other potential sources to produce fuels, with most processes including a catalytic deoxygenation aspect. (2008) The next section of this lesson will discuss Fischer-Tropsch and other chemical processes to make liquid fuels; it is an indirect method, as either natural gas or carbon materials that have been gasified must be used in these processes.
Additionally, there are some processes being developed for the production of alternative jet fuel from biomass-natural gas and biomass-coal. Researchers are working to develop processes at the demonstration scale for eventual commercialization. Virent, along with Battelle in Ohio, have produced ReadiJet Fuel using a pilot scale facility. (Conkle et al., 2012a, 2012b) Their paper includes a diagram of a schematic of their process (p. 3), a catalytic process to deoxygenate oils similar to the HEFA process. Liu et al. point out that jet fuel from natural gas has some advantages, especially the transportation aspect of fuels (2013). Jet fuel made from natural gas is made via steam reforming to CO and H2, then use of the Fischer-Tropsch method to make long-chain alkanes (see additional explanation toward the end of the lesson). The fuel is very clean (no sulfur and no aromatics) and can be a drop-in replacement for petroleum-derived jet fuel - jet fuel made in this way has been thoroughly tested, and the fuel has been qualified for use in military and commercial jet airliners so long as the alternative fuel composes less than 50% of the fuel mixture. Penn State and the Air Force have been involved with the production of a coal-based jet fuel (Balster et al., 2008) that could possibly be co-processed with some type of bio-oil, such as vegetable oil or low-oxygen pyrolysis oil. The potential for using coal-based jet fuel lies in its high-energy density, superior thermal properties, and few issues with lubricity. The following table shows how the fuel produced by Battelle/Air Force and PSU/Air Force meets some of the ASTM requirements; Battelle’s fuel has been certified, but PSU’s fuel has not completely met certification criteria. Recently, Penn State received DOE funding to expand the solvent extraction unit to a continuous reactor and will use solvent from Battelle’s process to extract the coal – the goal is to incorporate coal into a biomass process in a more environmentally sound way than using other solvents. The figure below shows a schematic of the PSU unit. Elliot et al. (2013) at Pacific Northwest National Laboratory have developed a specific hydrothermal process to convert algal water slurries into organic hydrocarbons at subcritical water conditions (350 °C and 20 MPa pressure). The process also includes catalytic processes to remove oxygen, sulfur, and nitrogen, and the liquids generated are most likely of fuel quality.
| Category | JP-8 spec limits, Min | JP-8 spec limits, Max. | JP-900 (actual) PSU/Air Force | ReadiJet (actual) Battelle/Air Force |
|---|---|---|---|---|
| Flashpoint, °C | 38 (min.) | - | 61 | 42 |
| Viscosity, cSt, -20°C | - | 8.0 (max.) | 7.5 | 4.2 |
| Freezing point, °C | - | -47 (max.) | -65 | -44 |
| Smoke pt., mm | 19 (min.) | - | 22 | 25 |
| Sulfur, wt% | - | 0.3 (max.) | 0.0003 | 0.0 |
| Aromatics, % | - | 25 (max.) | 1.9 | 10 |
| Thermal stab.@260°C | - | 25 mm (max.) | 0 | 1 |
| Calorific value, Btu/lb | 18,400 | - | 18,401 | 18,659 |
| Hydrogen content | 13.4 | - | 13.2 | - |
| API gravity, 60° | 37.0 | 51.0 | 31.1 | 44.5 |
| FSII (DiEGME)* | 0.10 | 0.15 | 0 | 0 |
| conductivity pS/m* | 150 | 600 | 0 | 0 |
*No additives were included in these fuels for these tests. Balster et al., Conkel et al.

PSU Solvent Extraction Unit - Large Laboratory Scale.
This is a diagram of the PSU Solvent Extraction Unit. The diagram shows N2 or H2 gas at 100 psig being loaded into an extractor with a coal solvent (0.25 -1 kg/h). The extractor runs at 250-500ºC. After the extractor, there is a settler at 200ºC and any solids are removed for gasifying. Following the settler, there is a filter operating at 200ºC, 100psig, 0.25-1kg/h. Any solids are removed for gasifying. After the filter, there is a liquids receiver, and then liquids for further upgrade are removed.
7.4 Natural Gas and Synthetic Natural Gas as Feedstocks for Liquid Fuels
7.4 Natural Gas and Synthetic Natural Gas as Feedstocks for Liquid FuelsIn Lesson 4, we discussed gasification in depth. We also briefly discussed using syngas to make liquids. In Lesson 8, we will go into a little more depth. These types of processes are called indirect liquefaction.
The primary objective of gasification is to produce a syngas primarily composed of carbon monoxide (CO) and hydrogen (H2). After gasification, the product needs to be cleaned to remove any liquids, and there are several reactions that can be done to change the H2/CO ratio or to make different products. This is where we will start this lesson.
Below are the three different process phases that the gas must go through. The first phase is the gasifier and separation of gas, liquid, and solid products. The biomass is not pure carbon, and all the streams will contain a variety of other compounds that may not be wanted or may be harmful.
Solids are removed by a cyclone or an electrostatic precipitator. The particles are similar to what is seen in combustion – ungasified or partially gasified particles. Some mineral matter/ash can also be in the solids. A separator is used to remove the liquids, mainly tars and water, that must be separated and processed for use. The water fraction can be used to react the organic compounds further, and the tars can be distilled and reacted further, similar to the direct liquefaction processes we described in previous sections. In any case, the water must be treated before disposal.

Gasification process to produce liquid products – the first phase is gasification and separation.
Phase 1 of Gasification:
Coal is crushed, ground, and sized in the presence of hydrogen. Next, the prepared feed coal goes into the gasified where there is steam from a boiler and lots of oxygen gas. Ash and slag are removed, and the remaining products go into tar separation, where the raw gas is separated from the tar.
The gases can also contain unwanted gases. Three gases that need to be removed from the gas phase are ammonia (NH3), carbon dioxide (CO2), and hydrogen sulfide (H2S). They are corrosive and/or toxic and need to be removed. The acid gases (H2S and CO2) are called acid gases because they can dissolve in water and produce weak acids that can be corrosive to metals. There are a range of processes that can separate out the acid gases. One typical method to remove these harmful gases is called the Rectisol process. Both H2S and CO2 are soluble in methanol, while H2 and CO are not. In the simplified schematic, you can see there are two parts to the process, an absorber, and a regenerator. The raw gas goes into the absorber and comes into contact with the lean solution of methanol. The purified gas goes out the top, and the solution rich in unwanted absorbed gases goes to the regenerator – the acid gases are then separated out from the methanol so that a lean methanol solution comes out the bottom to be recycled for use in the absorber. The H2S in the acid gas can be burned or reacted with SO2 to form solid sulfur, which is used for making chemicals. The CO2 goes out of the stack, but could also be captured if processes to capture it are put into place.

Gasification process to produce liquid products – the second phase is gas purification using the Rectisol process.
Phase 2 of Gasification:
Raw Gas from phase one enters the absorber and the purified gas is removed. Then the remaining rich solution goes into the regenerator. Acid gas is separated in the regenerator and the remaining lean solution returns to the absorber.
The H2/CO ratio may not be ideal for downstream synthesis reactions. This figure shows a process to use the water-gas shift reaction to change the ratio of H2/CO.

Gasification process to produce liquid products – the third phase after gas purification is the change in the ratio of H2/CO.
Phase 3 of Gasification:
The purified gas and steam go to a WHS reactor. From there they enter a CO2 scrubber which can send the gas to the regenerator to remove additional CO2 after that the gas can return to the scrubber and with hydrogen gas proceed to synthesis.
Ideally, the gas stream coming off the gasifier followed by a Rectisol unit could be reasonably pure H2 and CO. The water-gas shift can change the ratio of H2/CO. The reaction is shown below:
This would be the way to make less CO and more H2, but the reaction can go in reverse to make more CO and less H2 as well. From coal gasification, we want to shift it to the right as written. Advantages include:
- that it's an equilibrium process;
- can shift reaction in other direction by taking advantage of LeChatlier’s Principle;
- with the same number of moles on both sides, the equilibrium position is independent of pressure – no requirement of compression or release of pressure of shift reactor;
- can be adapted to any operating pressure.
The major disadvantage of the water-gas shift reaction is it’s a CO2 factory! There are only a few ways of separating CO2, such as a monoethylamine (MEA) scrubber. You can separate the CO2 to a 99% concentration, which would be ideal for CCS. Another thing to consider is we do not need to separate the entire gas stream and shift it; we only need to do enough to get the H2/CO ratio where we want it to be. Once we get to this point, we can be ready to do some synthesis of liquids.
7.5 Fischer-Tropsch Process to Generate Liquid Fuels
7.5 Fischer-Tropsch Process to Generate Liquid FuelsSo, what can be done with synthesis gas? It can be burned and used in a gas turbine to heat exchange the heat to produce steam and operate a second turbine for electricity. The gas can be fed to a solid oxide fuel cell to generate electricity. We can also use synthesis gas to generate fuels, chemicals, and materials. In fact, the dominant application of synthesis gas from coal is the production of synthetic hydrocarbons for transportation fuels – Fischer Tropsch (FT) synthesis. This is what is primarily done in South Africa by the company Sasol and was also one of the methods used by the Germans in WWII to generate liquid fuels; in fact, direct liquefaction was the primary method used to produce liquid fuels in Germany in the 1940s. However, it is not the only gasification to liquids process. As noted in Lesson 4, the FT synthesis reaction can be presented by:
We are taking carbon atoms and building them up as alkanes, containing up to at least 20 carbon atoms. It is really a polymerization process, and it follows polymerization statistics. The figure below shows a typical polymerization statistical function. You will not obtain one single pure alkane from the FT process, and there will be a distribution of products. As with all chemical reactions, you will have reaction variables to adjust, such as temperature, pressure, residence, and the addition of a catalyst. By skillful selection of variables (T, P, t, and catalyst), we can, in principle, make anything from methane to high molecular weight waxes. The intent is to maximize liquid transportation fuel production.

The primary process for FT is the Synthol Process; the schematic is shown in the figure below. The synthesis gas goes into the reactor at 2.2 MPa of pressure and 315-330°C. The product leaves the reactor where the catalyst is recovered, oils are removed by a hydrocarbon scrubber, and the tail gas is recovered. The gas part is recycled, and the rest of the material is then distilled into gasoline, jet fuel, and diesel fractions. The Synthol reactor is a fluid bed reactor that uses an iron-based catalyst.

Schematic of Synthol process for FT liquids production.
Schematic of Synthol Process for FT liquid production:
Synthesis gas enters the synthol reactor. From there it moves on to the catalyst recover. The gas can then return to the synthol reactor or proceed to the HC scrubber, where heavy oil is introduced. Dissolved heavy oils are removed and everything else moves onto tall gas recovery. The tall gas is then recycled and everything else moves to distillation where it goes on to become gasoline, jet fuel, and diesel.
The liquids produced make very clean fuels. The product is near zero sulfur and low in aromatic compounds, and it is composed of mainly straight-chain alkanes. When considering the carbon-steam reaction, it is an endothermic reaction (the gasification, needs to add heat). In this case, the reaction is “backward," or going the other direction. Therefore, the FT synthesis reaction is an exothermic reaction. Because the reaction is exothermic, heat is generated, so Synthol reactors have internal cooling tubes with steam that when heated generate high-pressure steam that can be used in other processes.
FT diesel fuel is high-quality diesel fuel – we want to have linear alkanes, low aromatic content, and low sulfur. FT diesel fuel has all three aspects of diesel fuel that we want, and has a cetane number ≥ 70 – it is an ideal diesel fuel (recall that good diesel fuel has a cetane number of 55).
Jet fuel made from FT synthesis makes a decent fuel. It is low in aromatic and sulfur content. It is the first bio-based jet fuel that has been certified for use in aircraft and has been tested in blends with major airlines (Virgin). However, for use in military jets, it must be blended because newer designs use the fuel as a coolant for electronics, as the fuel can have issues in these aircraft. For example, alkanes have the lowest density of various compound classes in jet fuel, so FT jet fuel has borderline volumetric density. Alkanes are also likely to undergo pyrolysis reactions at certain high temperatures, and if the fuel is used as a heat-exchange fluid to reduce the heat load, carbon formation can occur – this is mainly a problem for some of the newer military jet aircraft.
FT gasoline that comes straight off of the reaction is not great gasoline, as it has a low octane number. Recall that branched alkanes and aromatic compounds have higher octane numbers. Since FT compounds tend to be straight-chain alkanes, isomerization is required, and an appropriate catalyst must be used for catalytic reforming.
The primary location for gasification and FT synthesis is in South Africa – the gasoline being sold in South Africa has an octane number of 93. An integrated plant will also produce aromatics, waxes, liquid petroleum gas, alcohols, ketones, and phenols in addition to liquid hydrocarbon fuels. The reasoning behind marketing multiple products is that all the products will go up and down in price; when something goes up in price, you make more of it, and when something goes down in price, you may make less. This is a way for plants to maximize their profits.
Methanol Production
Synthesis gas can also be used to produce methanol, and CH3OH. The current technology for making methanol is fairly mature. Typically, natural gas is used as the feedstock, which is steam-reformed to make CO and hydrogen:
Then methanol is synthesized by the reaction:
However, another methanol synthesis reaction allows for CO2 to be in the feed gas:
However, because water and methanol are infinitely soluble, an additional step is required downstream to isolate methanol from water. Typical operating conditions in the methanol synthesis reactor are 5-10 MPa pressure, 250-270°C, using a copper/zinc catalyst. The reaction is extremely exothermic, so heat must be removed to keep the reaction under control. Similar to the FT reaction, the reactor has a shell and tube heat exchanger where the coolant is circulated through the shell, and catalyst particles are packed into the tubes where the reactant/product liquids flow. The figure below shows a schematic of the methanol synthesis process.

So, what can methanol be used for? It is periodically used as a replacement for gasoline, particularly for racing fuel, as it has a high-octane number. It has no sulfur in it, will produce almost no NOX due to the low flame temperature, and can be blended with gasoline.
There are also some disadvantages to using methanol as a fuel. It is infinitely miscible with water, it has health and safety issues, provides only half the volumetric energy density of gasoline, and may have compatibility issues with materials in some vehicles.
Enormous tonnages of methanol are produced and handled annually with excellent safety – but within the chemical process industry. However, if the general public is handling methanol, safety may be an issue because methanol has toxic properties. Methanol is being seriously considered as the fuel of choice in the use of fuel cells. However, there is a process to make methanol directly into gasoline, so concerns about methanol aren’t an issue then.
Methanol-To-Gasoline (MTG)
Methanol can be used to make a gasoline product. The process uses a special zeolite catalyst with a pore size such that molecules up to C10 can get out of the catalyst. Larger molecules cannot be made with this process; therefore, a product is made with no carbon molecules greater than C10, which boils in the gasoline range. In this process, aromatics and branched-chain alkanes are made, which means the MTG process produces very high-octane gasoline. Gasoline is the only product. In the reaction, methanol is converted into dimethyl ether (which can be a good diesel fuel) by the following reaction:
As the reaction progresses, the dimethyl ether is dehydrated further to the product hydrocarbons. The overall reaction is:
As with the other reactions we’ve looked at in this section of the lesson, the reaction is highly exothermic, so the reactor and process have to be designed to remove heat from the reaction to keep it under control. The conditions for this reaction are 330-400°C and 2.3 MPa. If one wanted to envision how a plant could incorporate all of these processes together, the following would be one scenario:
- Add an MTG unit to existing natural gas-fed methanol plants (produce high-octane gasoline).
- Replace the natural gas units with coal and/or biomass gasification and gas conditioning.
- Add parallel trains of Synthol reactors (produce high cetane diesel).
- Add a third section, using a solid oxide fuel cell to generate electricity using synthesis gas as the feed material.
The plant then produces gasoline, diesel, and electricity.
7.6 Assignments Overview
7.6 Assignments OverviewFinal Project Outline Assignment
Biomass Choice: Choose biomass to focus your paper on.
This week, I am asking you to begin your biomass project. You will do a 1-2 page write-up, stating the information listed below. It can be an outline at this point but needs to have enough information so I can see what your project will be about and to see that you have begun to work on it.
- Biomass Choice. Reminder - do not make choices that already exist in the marketplace. This includes sugar cane used to make ethanol in Brazil or corn used to make ethanol in the midwest of the USA.
- Literature review on the biomass (at this point, this should consist of a list of resources that you have consulted - APA style, please!)
- Requirements for location
- Climate (i.e., tropical, subtropical, moderate,…)
- Land area required or another type of facility to grow
- Method of Production
- Product markets around location
- Economic Evidence
- Other factors (environmental, political, tax issues, etc.)
Some notes on format:
- Approximate length – 2 pages, double-spaced, 1” margins, 12-point font, name at the top.
- The outline should include the elements listed above.
- Use as filename your user ID_Outline (i.e., ceb7_Outline).
- Upload it to the Outline Dropbox.
7.7 Summary and Final Tasks
7.7 Summary and Final TasksSummary
Lesson 7 covered thermochemical methods of converting biomass into fuels. These are the main methods being considered at this point; however, research continues on additional methods and what is included may not be a complete list. The main advantage of fermentation is that it is a natural process that does not require additional chemicals, but the main disadvantage of fermentation is the processes tend to be slow. All of the thermochemical processes require heat and some other process parameters that may make them more expensive – another lesson will discuss the economics behind all of the processes we’ve discussed for comparison.
We discussed both direct and indirect methods for making fuel from biomass. These methods are not just directed towards making ethanol. Many of these processes are used to make hydrocarbon fuels that limit the amount of oxygen in the product, as too much oxygen typically results in either causing the fuel to form unwanted “gums" or a corrosive environment that will cause problems in the units and storage containers. For jet fuels, oxygenated compounds will keep the fuel from being certified for use, so most of the methods presented make deoxygenated jet fuel. I would suggest continuing to monitor the news to see the progression in certification for additional bio-based fuels.
Lesson Objectives
By the end of this lesson, you should be able to:
- explain the chemical characteristics of heavier fuels such as jet fuel and diesel fuel;
- explain thermochemical processes used to produce higher molecular weight compounds, from direct and indirect methods;
- evaluate how thermochemical processes are different from enzymatic processes.
Reminder - Complete all of the Lesson tasks!
You have reached the end of this Lesson! Double-check the Road Map on the Lesson Overview page to make sure you have completed all of the activities listed there before you begin the next lesson.
Questions?
If there is anything in the lesson materials that you would like to comment on, or don't quite understand, please post your thoughts and/or questions to our Throughout the Course Questions & Comments discussion forum and/or set up an appointment during office hours. While you are there, feel free to post responses to your classmates if you can help.
References
Al-Sabawi, M., Chen, J., Ng, S. “Fluid Catalytic Cracking of Biomass-Derived Oils and Their Blends with Petroleum Feedstocks: A Review,” Energy Fuels, 26, 5355-5372, 2012.
Balster, L., Corporan, E., DeWitt, M., Edwards, J. T., Ervin, J.S., Graham, J.L., Lee, S-Y., Pal, S., Phelps, D.K., Rudnick, L.R., Santoro, R.J., Schobert, H.H., Shafer, L.M., Striebich, R.C., West, Z.J., Wilson, G.R, Woodward, R., Zabarnick, S. “Development of an advanced, thermally stable, coal-based jet fuel,” Fuel Processing Technology, 89 (4), 364-378, 2008.
CAPA Centre for Aviation, December 25, 2013, accessed June 17, 2014.
Conkle, H.N., Marcum, G.M., Griesenbrock, E.W., Edwards, E.W., Chauhan, S.P., Morris, Jr., R.W., Robota, H.J., Thomas, D.K., “Development of Surrogates of Alternative Liquid Fuels Generated from Biomass,” 2012, accessed June 17, 2014.
Conkle, H.N., Griesenbrock, E.W., Robota, H.J., Morris, Jr., R.W., Coppola, E.N., “Production of Unblended, “Drop-in,” Renewable Jet Fuel,” 2012, accessed June 17, 2014.
Elliott, D.C., Hart, T.R., Schmidt, A.J., Neuenschwander, G.G., Rotness, L.J., Olarte, M.V., Zacher, A.H., Albrecht, A. O., Hallen, R.T., Holladay, J.E., “Process development for hydrothermal liquefaction of algae feedstocks in a continuous-flow reactor,” Algal Research-Biomass Biofuels and Bioproducts, , 2 (4), 445-454, 2013.
Fremont, M. “Jet Fuel Contamination with FAME- World Jet Fuel Supply,” Airbus FAST Magazine, #46, August 2010, 8-13.
Kramer, S., “Alternative Fuels: Specifications and Testing,” CAAFI: Research and Development Team White Paper Series: Specifications and Testing, 2011, accessed August 20, 2014.
Hileman, J.I., Stratton, R.W., “Alternative jet fuel feasibility,” Transport Policy, article in press, 2014.
Liu, G. Yan, B., and Chen, G., “Technical review on jet fuel production,” Renewable and Sustainable Energy Reviews, 25, 59-70, 2013.
Martinkus N, W. Shi, N. Lovrich, J. Pierce, P. Smith, and M. Wolcott. 2014. Integrating biogeophysical and social assets into biomass-to-biofuel supply chain siting decisions, Biomass and Bioenergy 66 (2014) 410-418.
Mullen, C.A., Boateng, A., and Goldberg, N., “Production of Deoxygenated Biomass Fast Pyrolysis Oils via Product Gas Recycling,” Energy Fuels, 27 (7), 3867–3874, 2013.
Westfall, P.J., Gardner, T.S., “Industrial fermentation of renewable diesel fuels,” Current Opinion in Biotechnology, 22 (3), 344-350, 2011.
The World Bank. Health [Internet]. Social capital: what is social capital? c2012. [Cited 2012 Feb 13].
Lesson 8: Biodiesel Production
Lesson 8: Biodiesel ProductionOverview
We’ve focused on the processes used to make ethanol from fermentation and to create other products using thermochemical methods. Now we will look at making biodiesel from fats using transesterification as well as other methods being investigated. Converting vegetable oils into biodiesel is fairly straightforward and easy to do, but it is still not very economical. We will begin with a brief chemistry tutorial on the chemistry of vegetable oils and animal fats before going into transesterification. We will then discuss other methods of biodiesel production.
Lesson Objectives
By the end of this lesson, you should be able to:
- explain the chemistry of vegetable oil biodiesel, and several ways to make it;
- explain how to utilize biodiesel in a diesel engine;
- evaluate the best uses of biodiesel.
Lesson 8 Road Map
This lesson will take us one week to complete. Please refer to the Course Syllabus for specific time frames and assignment due dates.
Questions?
If there is anything in the lesson materials that you would like to comment on or don't quite understand, please post your thoughts and/or questions to our Throughout the Course Questions and Comments discussion forum. The discussion forum will be checked regularly. While you are there, feel free to post responses to your classmates if you are able to help. Regular office hours will be held to provide help for EGEE 439 students.
8.1 Terminology for Vegetable Oils and Animal Fats
8.1 Terminology for Vegetable Oils and Animal FatsFat is a generic term for lipids, a class of compounds in biochemistry. You would know them as greasy, solid materials found in animal tissues and in some plants – oils that are solids at room temperature.
Vegetable oil is the fat extracted from plant sources. We may be able to extract oil from other parts of a plant, but seeds are the main source of vegetable oil. Typically, vegetable oils are used in cooking and for industrial uses. Compared to water, oils and fats have a much higher boiling point. However, there are some plant oils that are not good for human consumption, as the oils from these types of seeds would require additional processing to remove unpleasant flavors or even toxic chemicals. These include rapeseed and cottonseed oil.
Animal fats come from different animals. Tallow is beef fat and lard is pork fat. There is also chicken fat, blubber (from whales), cod liver oil, and ghee (which is a butterfat). Animal fats tend to have more free fatty acids than vegetable oils do.
Chemically, fats and oils are also called “triglycerides.” They are esters of glycerol, with a varying blend of fatty acids. The figure below shows a generic diagram of the structure without using chemical formulas.

So what is glycerol? It is also known as glycerin/glycerine. Other names for glycerol include 1,2,3-propane-triol, 1,2,3-tri-hydroxy-propane, glyceritol, and glycyl alcohol. It is a colorless, odorless, hygroscopic (i.e., will attract water), and sweet-tasting viscous liquid. The following figure shows the chemical structure in two different forms.

So now we need to define what the fatty acids are. Essentially, fatty acids are long-chain hydrocarbons with a carboxylic acid. The following figure shows the generic chemical structure of a fatty acid with the carboxylic acid on it.

This image provides a visual and textual explanation of the carboxylic acid functional group, commonly found in organic molecules such as fatty acids. It features two equivalent representations of the same chemical structure:
- R–C=O with an –OH group attached to the carbon, which is the expanded structural form.
- RCOOH, the condensed molecular formula.
In both cases, "R" denotes a long hydrocarbon chain, which can vary in structure. The image notes that this chain may be saturated, meaning it contains only single bonds between carbon atoms, or unsaturated, meaning it includes one or more double bonds.
The COOH group is identified as the acidic functional group—a defining feature of carboxylic acids. The image emphasizes that this group can be written in either the expanded or condensed form, both of which are chemically equivalent.
The figure below shows different fatty acid chemical structures. The chemical structures are shown as line chemical structures, where each point on the links is a carbon atom and the correct number of hydrogen atoms is dependent on whether there is a single or double bond. Fatty acids can be saturated (with hydrogen bonds) or unsaturated (with some double bonds between carbon atoms). Because of the metabolism of oilseed crops, naturally formed fatty acids contain even numbers of carbon atoms. In organic chemistry, carbon atoms have four pairs of electrons available to share with another carbon, hydrogen, or oxygen atom. Free fatty acids are not bound to glycerol or other molecules. They can be formed from the breakdown or hydrolysis of a triglyceride.


The fatty acids shown have slightly different properties. Palmitic acid is found in palm oil. The figure below shows the relationship of each fatty acid to its size and saturation. Palmitic and steric acids are saturated fatty acids, while oleic and linoleic acids are unsaturated with different amounts of double bonds. The figure below shows differing amounts of carbon atoms compared to the number of double bonds in the compound.

The figure below shows the part of the triglyceride that is a fatty acid and the part that is glycerol, including chemical structures this time. The chemical structure shown here is a saturated triglyceride.
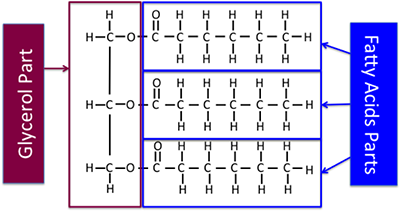
So, we’ve discussed what fats and oils are. Now, what is biodiesel? What is at least one definition? It is a diesel fuel that was generated from biomass. However, there are different types of biodiesel. The most commonly known type of biodiesel is a fuel comprised of mono-alkyl esters (typically methyl or ethyl esters) of long-chain fatty acids derived from vegetable oils or animal fats – this is according to ASTM D6551. An ASTM is a document that contains the standards for particular types of chemicals, particularly industrial materials. This is a wordy definition that doesn’t really show us what it is chemically.
So when we talk about an alkyl group, it is a univalent radical containing only carbon and hydrogen atoms in a hydrocarbon chain, with a general atomic formula of CnH2n+1. Examples include:
| Alkyl Name | Chemical Derived From | Chemical Formula |
|---|---|---|
| Methyl | Derived from methane | CH3- |
| Ethyl | Derived from ethane | CH3CH2- |
Another term we need to know about is an ester. Esters are organic compounds where an alkyl group replaces a hydrogen atom in a carboxylic acid. For example, if the acid is acetic acid and the alkyl group is the methyl group, the resulting ester is called methyl acetate. The reaction of acetic acid with methanol will form methyl acetate and water; the reaction is shown below. An ester formed in this method is a condensation reaction; it is also known as esterification. These esters are also called carboxylate esters.
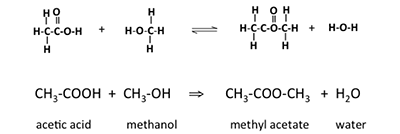
This image illustrates a chemical esterification reaction, both in terms of structural formulas and molecular formulas, showing the formation of an ester from a carboxylic acid and an alcohol.
At the top, the structural formulas depict the reaction between acetic acid (CH₃COOH) and methanol (CH₃OH). The acetic acid molecule features a carboxyl group (–COOH), while methanol contains a hydroxyl group (–OH). These two reactants undergo a condensation reaction, where a molecule of water (H₂O) is eliminated, and a new bond forms between the acid and alcohol.
The product of this reaction is methyl acetate (CH₃COOCH₃), an ester, along with water. The reaction is shown as reversible, indicated by the double arrows (⇌), which is characteristic of esterification reactions under equilibrium conditions.
Below the structural representation, the molecular formulas summarize the same reaction:
Each compound is labeled:
- Acetic acid
- Methanol
- Methyl acetate
- Water
This is the basic reaction that helps to form biodiesel. The following figure shows the different parts of the chemical structure of the biodiesel, the methyl ester fatty acid, or fatty acid methyl ester (FAME).

So, at this point, let’s make sure we know what we have been discussing. Biodiesel is a methyl (or ethyl) ester of a fatty acid. It is made from vegetable oil, but it is not vegetable oil. If we have 100% biodiesel, it is known as B100 – it is a vegetable oil that has been transesterified to make biodiesel. It must meet ASTM biodiesel standards to qualify for warranties sold as biodiesel and qualify for any tax credits. Most often, it is blended with petroleum-based diesel. If it is B2, it has 2% biodiesel and 98% petroleum-based diesel. Other blends include B5 (5% biodiesel), B20 (20% biodiesel), and B100 (100% biodiesel). We’ll discuss why blends are used in the following section. And to be clear: sometimes vegetable oil is used in diesel engines, but it can cause performance problems and deteriorate engines over time. Sometimes, vegetable oil and alcohol are mixed together in emulsions, but that it is still not biodiesel, as it has different properties from biodiesel.
So, if straight vegetable oil (SVO) will run in a diesel engine, why not use it? Vegetable oil is significantly more viscous (gooey is a non-technical term) and has poorer combustion properties. It can cause carbon deposits, poor lubrication within the engine, and engine wear, and it has cold-starting problems. Vegetable oils have natural gums that can cause plugging in filters and fuel injectors. For a diesel engine, the injection timing is thrown off and can cause engine knocking. There are ways to mitigate these issues, which include: 1) blending with petroleum-based diesel (usually < 20%), 2) preheating the oil, 3) making microemulsions with alcohols, 4) “cracking” the vegetable oil, and 5) using the method of converting SVO into biodiesel using transesterification. Other methods are used as well, but for now, we’ll focus on biodiesel from transesterification. The table below shows three properties of No. 2 diesel, biodiesel, and vegetable oil. As you can see, the main change is in the viscosity. No. 2 Diesel and biodiesel have similar viscosities, but vegetable oils have much higher viscosity and can cause major problems in cold weather. This is the main reason for converting the SVO into biodiesel.
| Fuel | Energy Content (Btu/gal) | Cetane Number | Viscosity (centistokes) |
|---|---|---|---|
| No. 2 Diesel | 140,000 | 48 | 3 |
| Biodiesel | 130,000 | 55 | 5.7 |
| Vegetable oil | 130,000 | 50 | 45 |
8.2 The Reaction of Biodiesel: Transesterification
8.2 The Reaction of Biodiesel: TransesterificationSo, how do we make biodiesel?
The method being described here is for making FAMEs biodiesel. The reaction is called transesterification, and the process takes place in four steps. The first step is to mix the alcohol for reaction with the catalyst, typically a strong base such as NaOH or KOH. The alcohol/catalyst is then reacted with the fatty acid so that the transesterification reaction takes place. The first figure below shows the preparation of the catalyst with the alcohol, and the second figure shows the transesterification reaction.

Formation of methoxide

The catalyst is prepared by mixing methanol and a strong base such as sodium hydroxide or potassium hydroxide. During the preparation, the NaOH breaks into ions of Na+ and OH-. The OH- abstracts the hydrogen from methanol to form water and leaves the CH3O- available for reaction. Methanol should be as dry as possible. When the OH- ion reacts with H+ ion, it reacts to form water. Water will increase the possibility of a side reaction with free fatty acids (fatty acids that are not triglycerides) to form soap, an unwanted reaction. Enzymatic processes can also be used (called lipases); alcohol is still needed and only replaces the catalyst. Lipases are slower than chemical catalysts, are high in cost, and produce low yields.
Once the catalyst is prepared, the triglyceride will react with 3 mols of methanol, so excess methanol has to be used in the reaction to ensure a complete reaction. The three attached carbons with hydrogen react with OH- ions and form glycerin, while the CH3 group reacts with the free fatty acid to form the fatty acid methyl ester.
The figure below is a graphic of the necessary amounts of chemicals needed to make the reaction happen and the overall yield of biodiesel and glycerin. The amount of methanol added is almost double the required amount so the reaction goes to completion. With 100 lbs of fat and 16-20 lbs of alcohol (and 1 lb of catalyst), the reaction will produce 100 lbs of biodiesel and 10 lbs of glycerin. The reaction typically takes place at between 40-65°C. As the reaction temperature goes higher, the rate of reaction will increase, typically 1-2 hours at 60 °C versus 2-4 hours at 40°C. If the reaction is higher than 65°C, a pressure vessel is required because methanol will boil at 65°C. It also helps to increase the methanol-to-oil ratio. Doubling the ratio of 3 mols of alcohol to 6 mols will push the reaction to completion faster and more completely.

The following video shows a time-lapsed reaction of transesterification of vegetable oil into biodiesel. It also incorporates the steps after the reaction to separate out the biodiesel.
Biodiesel Production Demonstration (9:44)
Transcript: Biodiesel Production Demonstration (9:44)
MARK HALL: Hello. I'm Mark Hall of the Auburn University Extension Renewable Energy Specialist. We're doing several of these things on energy options that you can do, several pieces that, each piece of the puzzle, that you can contribute to our energy independence by making ethanol, making biodiesel, being more energy efficient in how you operate your home.
Today, we're going to talk about making biodiesel. And we have Lance Hall. Lance has been making biodiesel to run in his car. He bought a used Volkswagen off eBay and started making biodiesel. And he's liked it so much that he's bought a new diesel car. And he's been real successful doing this for a couple of years.
Before we bring Lance in, I'd like to thank my friend and coworker Walter Harris, the county agent coordinator in Madison County, for filming us today. Lance, come in and show us what you've been doing. And congratulations. You've been successful doing this.
I was talking to my daddy about my new job several years ago. And he said, well, Lance has been doing that for a long time. I said, what? I didn't know that. So Lance, show people how to make biodiesel.
LANCE HALL: OK. A lot of people know about the biodiesel. They've read the stories. They've done some research. But, yet, they still don't have enough confidence in their ability to actually make a batch. So I'm going to show you today on how to make a batch of biodiesel, just small scale, but it's easy.
OK. The first thing that we're going to do is start off with vegetable oil. Now, this will be 800 milliliters. And don't be confused between the milliliters and your normal units of measure. It's a simple conversion that anybody can do with a handheld calculator.
So we've got 800 milliliters here. Well, first thing we want to do is heat it. Now, don't be concerned about this fancy piece of equipment, either. The main element of this is to heat it any way that you can safely.
And these things here are magnetic stirrers. Again, don't be concerned with this. Just stir it while you're heating it to even things out. And we're going to heat this up to about 130 degrees Fahrenheit.
MARK HALL: Lance, tell them about where you get this equipment.
LANCE HALL: All of this equipment that I've got in my shop, all my lab stuff, eBay is a wonderful place to find a used lab supplies, lab glass. These are magnetic stirrer plates. These are really handy to have if you have the means to buy them. You don't have to have them, of course. But I like to use them.
And this is also an electronic scale that comes in handy when you start weighing out your catalyst, doing anything that you want to measure a precise weight. That's worth the money there. And that's going to take a little while, so--
MARK HALL: Lance, is there any other sites, internet sites that you would recommend for people that are interested in making biodiesel?
LANCE HALL: There are several sites out there. One of the most informative on what biodiesel is, where it's being used, is biodiesel.org. That's the National Biodiesel Board website, lots of good information there. It won't really tell you as much how to make it, but hopefully, this will be one of the more informative sites that you'll actually be able to see somebody make one, make a batch.
OK. As our oil is heating up, we have to mix up our methanol potassium hydroxide mixture. So safety is paramount with the use of methanol or the strong caustic lye potassium hydroxide. Methanol can cause blindness or death, and it can be absorbed through the skin. And the potassium hydroxide will burn your skin if it gets on you.
So here's what we're going to do. We're going to take our methanol and we're going to pour this into a container. Face shields are good, too.
We're going to use 175 milliliters of the methanol. That's roughly 20% of the 800 milliliters of oil. You usually want to use about a 20% methanol volume compared to the veggie oil volume.
OK. Our next ingredient is our potassium hydroxide. That's our lye. Now, we have to do a quick calculation on how much of this we need to mix with our methanol in order for the reaction to take place.
I've got a nice spreadsheet that I like to use. It's the Biodiesel-o-matic. You can usually find it online from different biodiesel websites. I'm going to pull that up.
OK. We want to use 7 grams of potassium hydroxide per each liter of veggie oil. So you take 7 divided by 0.8. And that gives you 6.4 grams.
Double bag this stuff, or it will absorb moisture. And that will kill your process.
So we're going to use our scale. We're going to zero the container. And then we're going to put 6.4 grams into it. Make sure you have your gloves on.
OK. That's our 6.4 grams. Close this immediately. Keep it double-bagged. OK. Now, you're going to take your 6.4 grams of potassium hydroxide and put that into your 175 milliliters of methanol.
Again, you want to stir this. It's not necessary to heat it, though. Just stir. And stir this until at least the potassium hydroxide is completely dissolved into the methanol. You don't want to see any chunks of white potassium hydroxide flakes.
All right. Our potassium hydroxide is fully mixed into our methanol. We want to remove the stir bar. And then we're just going to slowly pour this into our oil as it's being stirred.
Again, you don't have to have fancy equipment. Just pour it in as you're stirring it manually. But the key is to do it slowly.
The figure below shows a schematic of the process for making biodiesel. Glycerol is formed and has to be separated from the biodiesel. Both glycerol and biodiesel need to have alcohol removed and recycled in the process. Water is added to both the biodiesel and glycerol to remove unwanted side products, particularly glycerol, that may remain in the biodiesel. The wash water is separated out similar to solvent extraction (it contains some glycerol), and the trace water is evaporated out of the biodiesel. Acid is added to the glycerol in order to provide neutralized glycerol.

Schematic of the biodiesel process using transesterification.
Schematic of the biodiesel process using transesterification:
Oil, alcohol, and a catalyst undergo transesterification. From there they are mixed methyl esters from which crude glycerol is removed. The crude glycerol goes into a separator under heat and a vacuum in which alcohol is removed. It then goes through a water wash and is neutralized with acid to produce neutralized glycerol. The other remaining mixed methyl esters from transesterification go into a different separator which removes any alcohol. They then undergo an extraction using water and move into a second separator under heat and a vacuum that removes any water. This yields biodiesel.
As briefly discussed, the initial reactants used in the process should be as dry as possible. Water can react with the triglyceride to make free fatty acids and a diglyceride. It can also dissociate the sodium or potassium from the hydroxide, and the ions Na+ and K+ can react with the free fatty acid to form soap. The figure below shows how water can help to form a free fatty acid, and that free fatty acid can react with the Na+ ion to form soap. The sodium that was being used for a catalyst is now bound with the fatty acid and unusable. It also complicates separation and recovery. All oils may naturally contain free fatty acids. The refined vegetable oil contains less than 1%, while crude vegetable oil has 3%, waste oil has 5%, and animal fat has 20%. Animal fats are a less desirable feedstock.

This image illustrates two fundamental chemical processes involving triglycerides: hydrolysis and saponification, both of which are essential in lipid chemistry and soap production.
Part A: Hydrolysis of Triglycerides
In this reaction, a triglyceride—a molecule composed of a glycerol backbone esterified with three fatty acids—is partially hydrolyzed by water. The structural formula of the triglyceride is:
When water (H₂O) is added, one ester bond is cleaved, producing a free fatty acid and a diglyceride. The reaction is reversible and can be represented as:
Part B: Saponification (Soap Formation)
This part shows the saponification reaction, where a free fatty acid reacts with sodium hydroxide (NaOH). First, NaOH dissociates in water:
Then, the hydroxide ion reacts with the fatty acid:
Finally, the sodium ion combines with the carboxylate to form soap:
This reaction is the basis of traditional soap-making, converting fats into glycerol and soap through alkaline hydrolysis.
8.3 Various Processes Used to Make Biodiesel
8.3 Various Processes Used to Make BiodieselSome of the processes used in making biodiesel are different from what we’ve discussed. The first of these processes we’ll discuss is solvent extraction.
In the process of making biodiesel through transesterification, we noted that biodiesel and glycerol are the products, with some water formation and unwanted potential soap formation. So, the products are liquid, but they are also immiscible (do not dissolve in each other) and have differences in specific gravity. The specific gravity of the products is shown in the table below.
| Material | Specific gravity (g/cm3) |
|---|---|
| Glycerol (pure) | 1.26 |
| Glycerol (crude) | 1.05 |
| Biodiesel | 0.88 |
| Methanol | 0.79 |
In batch processing, gravity separation is used, and the products remain in the reactor; the reactor then becomes a settler or decanter. Once the reaction is finished, the product mixture then sits without agitation. After 4-8 hours, the glycerol layer settles at the bottom (because it has higher gravity) and the biodiesel settles at the top. However, if a continuous flow facility is utilized, the products separate too slowly in a settler, so a centrifuge is used. A centrifuge will spin the liquids at a very high speed, which helps to promote density separation. The figure below shows a few different types of industrial centrifuges that can be used for biodiesel separation.

One of the issues that can happen during separation is the forming of a layer containing water and soap, in between the glycerol and biodiesel. That will hinder the separation. Another issue is that glycerol contains 90% of the catalyst and 70% of the excess methanol. In other words, the glycerol fraction is kind of the “trashcan” layer of the process. The biodiesel layer also contains some contaminants, including soap, residual methanol, free glycerol, and residual catalyst. The catalyst in biodiesel is extremely problematic if introduced into fuel systems. One way to improve the separation is through water washing with hot water, as the contaminants are soluble in water, but the biodiesel is not. Water washing will remove contaminants such as soap, residual methanol, free glycerol, and catalysts. The water should be softened (had ions removed) and be hot (both the biodiesel and water should be at 60°C). Thorough mixing with the wash water is needed so that all the contaminants can be removed, but the mixing intensity should also be controlled so that emulsions do not form between the biodiesel and water. Sometimes acid is added in the wash process to separate out the soaps. However, the last portion of washing needs to be acid-free, so a step may need to be added to neutralize the glycerol.
There is more than one way to implement the washing process. For batch processes, two of the methods are: a) top spray and b) air bubbling (see figure below). For the top spray, a fine mist of water is sprayed top-down in a fine mist. The water droplets contact the biodiesel as the water flows down, separating out the impurities. Air bubbling is a method that uses air as a mobile phase. Air bubbles through a layer of water and carries water with it on the way up. As the air bubbles burst on the way up, water droplets are released and drop down on the biodiesel at the bottom, contacting the biodiesel and washing out impurities. It can be a relatively slow process; a combination of the two is also possible.

For continuous-flow processes, different equipment is used, which typically incorporates some sort of counter-current flow process. The lighter biodiesel is introduced at the bottom and the heavier water is introduced at the top, and as they flow the fluids contact each other so that the biodiesel at the top has impurities removed and the water flowing down out the bottom contains the contaminants. The figure below shows two types of counter-current units: a) counter-flow washing system and b) rotating disc extractor. Both units contain materials to increase the interaction between water and biodiesel. For the counter-flow system, packing increases the interaction, while for the rotating disk extractor, disks rotate around as the fluid flows through. These types of equipment are typically used on an industrial scale and need precise mechanical design and process control; these units cost much more than the other type of system.

This image presents two schematic diagrams labeled (a) and (b), each illustrating a different method for washing biodiesel using softened water to remove impurities, such as residual catalysts, soaps, and glycerol.
(a) Counter Flow Washing Column
This diagram shows a vertical column where two fluids—softened water and biodiesel—flow in opposite directions:
- Softened water enters from the top left and flows downward.
- Biodiesel enters from the bottom left and flows upward.
- As the two fluids pass each other in opposite directions, impurities are transferred from the biodiesel into the water.
- The cleaned biodiesel exits from the top right, while the gray water (now containing the impurities) exits from the bottom right.
This counter-current setup enhances mass transfer efficiency, making it a common method in biodiesel purification.
(b) Rotating Disk Extractor
This diagram depicts a more mechanically intensive system:
- Softened water is introduced from the top center.
- Biodiesel enters from the middle left.
- Inside the extractor, rotating disks create turbulence and increase the contact surface area between the two liquids, improving the extraction of impurities.
- The purified biodiesel exits from the top right, while the gray water exits from the bottom right.
The most problematic step in biodiesel production, however, is water washing. It requires heated, softened water, some method of wastewater treatment, and water/methanol separation. Methanol recovery from water is somewhat costly using methanol-water rectification. Water can also be removed by vacuum drying. One of the alternative methods for removing water is the use of absorbent materials such as magnesium silicate. One company that provides a process for doing this is Magnesol, which is produced by the Dallas Group. Once the magnesium silicate removes the water, it can be regenerated by heating it up and evaporating the water. Methanol must also be removed from the biodiesel; one method for doing this is flash vaporization of methanol.
So, which type of process should be used? Should it be a batch or continuous flow system? Smaller plants are typically batch (< 1 million gallons/yr). They do not require continuous operation 24 hours per day 7 days a week. The batch system provides better flexibility and the process can be tuned based on particular feedstocks. However, in a commercial, industrial setting, most likely a continuous flow system will be used because of increased production and high-volume separation systems, which will increase the throughput. There are automation and process controls, but this also means higher capital costs and the use of trained personnel. It is feasible to have hybrid systems as well.
The primary byproduct is glycerin (aka glycerine, glycerol). It is a polyhydric alcohol, which is sometimes called a triol. It is a colorless and odorless liquid, which is viscous (thick-flowing) and sweet-tasting. It is non-toxic and water-soluble. Parameters to test quality are purity, color, and odor. Glycerol properties and chemical information are shown in the table below.
| Chemical name | Propane-1,2,3-triol |
|---|---|
| Chemical formula | C3H5(OH)3 |
| Molecular Weight, g/mol | 92.09 |
| Density, g/cm³ @ 20°C | 1.261 |
| Viscosity, mPa.s, @ 20°C (93% w/ water) | 1500 (400) |
| Melting point, °C (°F) | 17.9 (64.2) |
| Boiling point, °C (°F) | 290 – 297 (554-567) |
| Auto-ignition, °C (°F) | 370(700) |
| Flash Point, °C (°F) | 188 - 199 (370 - 290) |
| Food energy, kJ/g | 18 |
There are several different applications that glycerol can be used for, including the manufacture of drugs, oral care, personal care, tobacco, and polymers. Medical and pharmaceutical preparations use glycerol as a means to improve smoothness, lubrication, and moisturize – it is used in cough syrups, expectorants, laxatives, and elixirs. It can also be substituted for alcohol, as a solvent that will create a therapeutic herbal extraction.
Glycerol can be used in many personal care items; it serves as an emollient, moisturizer, solvent, and lubricant – it is used in toothpaste, mouthwashes, skin care products, shaving cream, hair care products, and soaps. Glycerol competes with sorbitol as an additive; glycerol has a better taste and a higher solubility.
Since it can be used in medical and personal care products, glycerol can also be used in foods and beverages. It can be used as a solvent, moisturizer, and sweetener. It can be used as a solvent for flavors (vanilla) and food coloring. It is a softening agent for candy and cakes. It can be used as part of the casings for meats and cheeses. It is also used in the manufacture of shortening and margarine, filler for low-fat food, and thickening agents in liqueurs.
Glycerol is also used to make a variety of polymers, particularly polyether polyols. Polymers include flexible foams and rigid foams, alkyl resins (plastics) and cellophane, surface coatings, and paints, and as a softener and plasticizer.
Unfortunately, there is already enough glycerol produced for the glycerol market. Glycerol consumption in traditional uses is 450 million lb/yr, and traditional capacity is 557 million lb/yr. If we produce glycerol from making biodiesel, it has the potential to produce 1900 million lb/yr. Therefore, we need to find a new market for glycerol, or it will be wasted in some fashion.
There is research being done to find new uses for glycerol. This includes use in additional polymers as an intermediate, conversion to propylene glycol for antifreeze, production of hydrogen via gasification, as a boiler fuel (have to remove alkali), in an anaerobic digester supplement, and for algal fermentation to produce Omega-3 polyunsaturated fatty acids.
8.4 Biodiesel Properties and Specifications
8.4 Biodiesel Properties and SpecificationsTo ensure quality biodiesel, there are standards for testing the fuel properly to see that it meets specifications for use. ASTM (an international standards and testing group) has a method to legally define biodiesel for use in diesel engines, labeled ASTM D6751. The table below shows the test methods necessary for all the expected standards for biodiesel.
| Property | ASTM Method | Limits | Units |
|---|---|---|---|
| Ca & Mg, combined | EN 14538 | 5 max | ppm (ug/g) |
| Flash point | D 93 | 93 min | °C |
| Alcohol Control | - | - | - |
| 1. Methanol content | EN14110 | 0.2 max | % mass |
| 2. Flash point | D 93 | 130 min | °C |
| Water & Sediment | D2709 | 0.05 max | % vol |
| Kinematic Viscosity, 40°C | D445 | 1.9-6.0 | mm2/sec |
| Sulfated Ash | D874 | 0.02 max | % mass |
| Sulfur | - | - | - |
| S 15 Grade | D5453 | 0.0015 max (15) | % mass (ppm) |
| S 500 Grade | D5453 | 0.05 max (500) | % mass (ppm) |
| Copper Strip Corrosion | D130 | No. 3 max | - |
| Cetane | D613 | 47 min | - |
| Cloud Point | D2500 | report | °C |
| Carbon Residue (100% sample) | D4530 | 0.05 max | % mass |
| Acid Number | D664 | 0.50 max | mg KOH/g |
| Free Glycerin | D6584 | 0.020 max | % mass |
| Total Glycerin | D6584 | 0.240 max | % mass |
| Phosphorus Content | D4951 | 0.001 max | % mass |
| Distillation, T90 AET | D1160 | 360 max | °C |
| Sodium/Potassium, combined | EN 14538 | 5 max | ppm |
| Oxidation Stability | EN 14112 | 3 min | Hours |
| Cold Soak Filtration | Annex to D6751 | 360 max | seconds |
| For use in temperatures below -12 °C | Annex to D6751 | 200 max | seconds |
There are advantages and disadvantages to using biodiesel compared to ultra-low sulfur diesel. It has a higher lubricity, low sulfur content, and low CO and hydrocarbon emissions. This makes it good to blend with diesel from petroleum to be able to achieve the required specifications for ultra-low sulfur diesel because ultra-low sulfur diesel has poor lubricity. But as discussed previously, biodiesel has poor cold weather properties. It really depends on the location; for instance, if using biodiesel in the upper Midwest, there could be problems in the winter.
As with all materials, the production and quality of biodiesel is important. Most importantly, the transesterification reaction should reach completion for the highest production and quality. Due to the nature of the transesterification of triglycerides, a small amount of tri-, di-, and mono-glycerides remain. The figure below shows the changes in these compounds as the glycerides react to form biodiesel. Some terminology to be aware of: 1) bound glycerol is glycerol that has not been completely separated from the glyceride and is the sum of tri-, di-, and mono-glycerides and 2) total glycerol combines the bound glycerol with the free glycerol.

Glycerol content in biodiesel must be as low as possible, as ASTM standards state. The biodiesel will not technically be “biodiesel” unless ASTM standards are met, which means it is below the total glycerol specifications. High glycerol content can cause issues with high viscosity and may contribute to deposit formation and filter plugging. Crude glycerol is often a dark brown color and must be refined and purified before use elsewhere. In biodiesel preparation, brown layers will form, and, possibly, white flakes or sediments, formed from saturated mono-glycerides, will fall to the bottom of the tank the biodiesel is being stored in.
Biodiesel is also a great solvent, better than petroleum-based diesel. It can loosen carbon deposits and varnishes that were deposited by petro-diesel and can cause fuel-filter plugging when switching over to biodiesel. Filters should be changed after the first 1,000 miles with biodiesel.
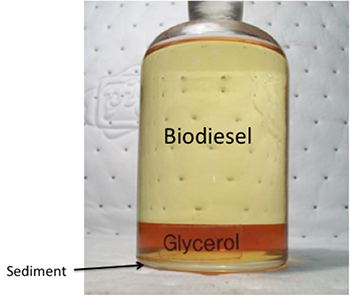
Another issue is the cold weather properties of biodiesel. These properties include cloud point, pour point, and cold soak filtration. Biodiesel can form cloud points at a much higher temperature than petro-diesel, close to the freezing point. The cloud point is the temperature at which crystals begin to form; it can cause the biodiesel to gel and flow slower than it should. Once the pour point is reached (basically completely frozen), the fuel cannot move. It depends on the normal temperature of the climate as to whether the fuel can be used or blended with petrodiesel. What can complicate it more is the saturated or unsaturated fatty acid content. High saturated fatty acid content can lead to higher fuel stability but higher pour points. High unsaturated acid content can lead to lower pour points but less stability for storing. The figure below shows a pour point comparison of biodiesels made from various oils (including fatty acid content) compared to petrodiesel. Petro-diesel pour points are significantly lower than biodiesels.

Pour point comparison of biodiesels made from various oils (including fatty acid content) and No. 1 diesel fuel.
| Biodiesel | Pour Point (Methyl Ester) ºC | Pour Point (Ethyl Ester) ºC | % Saturated Fatty Acids | % Monounsaturated Fatty Acids | % Polyunsaturated Fatty Acids |
|---|---|---|---|---|---|
| Canola | 15 | 22 | 6% | 62% | 32% |
| Safflower | 22 | 22 | 10% | 20% | 77% |
| Sunflower | 24 | 28 | 11% | 13% | 69% |
| Soybean | 25 | 30 | 15% | 24% | 61% |
| asdf | -45 | - | - | - | - |
Cetane number is also an important property for diesel fuels. Cetane number measures the point that the fuel ignites under compression, and this is what we want for a diesel engine. The higher the cetane number, the greater the ease of ignition. Most petro-diesel fuels have a cetane number of 40-50 and meet the ASTM specification for ASTM D975. In general, most biodiesels have higher cetane numbers, 46-60 (some as high as 100), and meet the specifications for ASTM D6751. Because of the higher cetane numbers of biodiesel, the engine running on biodiesel will have an easier time starting and have low idle noise. The table below shows the heat of combustions for various fuels along with their cetane number.
| Fuel | Heat of Combustion (Mj/kg) | Cetane No. |
|---|---|---|
| Methyl Ester (Soybean) | 39.8 | 46.2 |
| Ethyl Ester (Soybean) | 40.0 | 48.2 |
| Butyl Ester (Soybean) | 40.7 | 51.7 |
| Methyl Ester (Sunflower) | 39.8 | 47.0 |
| Methyl Ester (Peanut) | - | 54.0 |
| Methyl Ester (Rapeseed) | 40.1 | - |
| No. 2 Diesel | 45.3 | 47.0 |
If full-strength biodiesel is used (i.e., B100), most engine warranties will not be covered. It will also require replacing rubber seals in older engines. Blends include B2, B10, and B20 (2%, 10%, and 20% biodiesel, respectively). Adding biodiesel as a blend with ultra-low sulfur should improve lubricity for ultra-low sulfur diesel fuel, which will improve engine wear. Emissions of hydrocarbons, CO, NOx, and particulate matter are similar to petrodiesel fuels, although can be reduced in some cases.
Biodiesel is stored very similarly to petrodiesel. It is stored in clean, dark, and dry environments. It can be stored in aluminum, steel, fluorinated polyethylene, fluorinated polypropylene, and Teflon types of containers. It is best to avoid copper, brass, lead, tin, and zinc containers.
In another lesson, we will discuss the economics behind using biodiesel.
8.5 Summary and Final Tasks
8.5 Summary and Final TasksSummary
In this lesson, you’ve learned about how to make biodiesel from vegetable oils. You’ve had the opportunity to see how it is made and that it’s fairly simple to make. You’ve been provided with information on properties and how biodiesel is typically used. In a future lesson, you will be provided with information on the economics behind biodiesel and ethanol, as well as determining how much energy it takes to make biodiesel, versus the amount of energy that is produced. The additional information is important to determining the use of, and best practices for making, alternative fuels.
Lesson Objectives
By the end of this lesson, you should be able to:
- explain the chemistry of vegetable oil biodiesel, and several ways to make it;
- explain how to utilize biodiesel in a diesel engine;
- evaluate the best uses of biodiesel.
References
Scott W. Pryor 1*, B. Brian H 2, J.H. Van Gerpen 2 1. Department of Agricultural and Biosystems Engineering, North Dakota State University, 2. Department of Biological and Agricultural Engineering, University of Idaho, BEEMS Module B4, Biodiesel, USDA Higher Education Challenger Program, 2009-38411-19761. Contact: Scott Pryor, Scott.Pryor@ndsu.edu
Reminder - Complete all of the Lesson tasks!
You have reached the end of this Lesson! Double-check the Road Map on the Lesson Overview page to make sure you have completed all of the activities listed there before you begin the next Lesson.
Questions?
If there is anything in the lesson materials that you would like to comment on, or don't quite understand, please post your thoughts and/or questions to our Throughout the Course Questions & Comments discussion forum and/or set up an appointment during office hours. While you are there, feel free to post responses to your classmates if you can help.
Lesson 9: Algae as a Source for Fuels
Lesson 9: Algae as a Source for FuelsOverview
We spent the last lesson on what biodiesel is and how to make it. In another lesson, we will focus on economics. In this lesson, we will focus on making fuels from algae. Algae are a special type of feedstock; algae are generated on sites with water (fresh or salt), using waste CO2, and can be used to make biodiesel, and other forms of fuels. In Lesson 10, we will explore how algae grow and the types of fuels that can be made from it.
Lesson Objectives
By the end of this lesson, you should be able to:
- explain how algae grows and important factors in growth for fuels;
- describe the use of algae for various fuels, from making biodiesel to gases and alcohols;
- evaluate the efficacy of using algae for fuels.
Lesson 9 Road Map
This lesson will take us one week to complete. Please refer to the Course Syllabus for specific time frames and assignment due dates.
Questions?
If there is anything in the lesson materials that you would like to comment on or don't quite understand, please post your thoughts and/or questions to our Throughout the Course Questions and Comments discussion forum. The discussion forum will be checked regularly. While you are there, feel free to post responses to your classmates if you are able to help. Regular office hours will be held to provide help for EGEE 439 students.
9.1 Introduction
9.1 IntroductionAlgae are generated from sunlight, water, CO2, and nutrients as well as algal cultures. There are more than 30,000 species of algae. One of the major factors in the use of algae to generate fuels is choosing the best species for oil generation and developing methods for removing the oil and making it into a fuel. Fuels that can be made from algae oil are biodiesel, n-alkane hydrocarbons, ethanol, methane, and hydrogen. Algae can also be used for soil conditioners and agrochemicals such as fertilizers and proteins as well as fine chemicals and bioactive substances such as polysaccharides, antioxidants, omega-3 and-6 fatty acids, proteins, and enzymes.
There are currently several applications for algae including: 1) algin – a thickening agent for food processing (brown algae), 2) carrageenan – foods, puddings, ice cream, toothpaste (red algae), 3) iodine (brown algae), 4) agar – growth media in research (red algae), 5) as food (red and brown algae), 6) plant fertilizers, and 7) diatomaceous earth – used for filtering water, insulating, soundproofing. The table below shows some additional applications detailing the species, end product, origin, and main way to culture the algae.
| Species | End Product | Origin | Main Culture Systems |
|---|---|---|---|
| Chlorella spp. | Health food | Germany Indonesia Japan | Tubular photobioreactors Circular pivot ponds Raceway ponds |
| Spriulina spp. | Health food | China, India Japan Thailand, USA | Raceway ponds |
| Dunaliella salina | β-carotene | Australia India | Extensive open ponds Raceway ponds |
| Haematococcus pluvialis | Astaxanthin | Israel USA | Photobioreactors Raceway ponds |
| Crypthecodinium cohnii | DHA | USA | Heterotrophic cultivation (glucose) |
| Chaetoceros spp. Nannochloropsis spp. Navicula spp. Tetraselmis spp. Pavlova spp. | Aquaculture feed | Throughout the world | Tanks Bag reactors Raceway ponds |
The role of algae in the aqueous world is that they are the base of the aquatic food chain and are photosynthetic organisms. There is a symbiotic relationship between fungi and algae known as lichens. A lichen is a composite organism that emerges from algae or cyanobacteria living among filaments of a fungus in a mutually beneficial relationship. Their properties are plant-like, but lichens are not plants. Lichens help to cause the pigments of algae, reduce harmful amounts of sunlight, and kill bacteria. They can also serve as shelters, such as kelp forming underwater forests and red algae that form reefs.
Algae can have some negative impacts via eutrophication. Eutrophication is the ecosystem response to the addition of artificial or natural substances, mainly phosphates through detergents, fertilizers, or sewage to an aquatic system. It can also be caused by dense blooms of cyanobacteria or algae. These can cause impacts through 1) clogging of waterways, streams, and filters, 2) a decrease in water taste and quality, and 3) potential toxification. Red tide is one event that can be caused by dinoflagellates.
So why make biofuels from algae? There are several reasons. Algae have high lipid content (up to 70%); they grow rapidly and will produce more lipids per area than other terrestrial plants (10-100 times). To grow algae, non-arable land (this can be thought of as land that is not typically used for farming) can be used along with saline or brackish water. Algae don’t have the same competition with generating food or feed as other oil-producing plants. One of the most amazing features is the use of CO2 in growing algae; it helps grow algae significantly. It also provides nutrient (N, P) removal in agricultural and municipal wastewater.
The table below shows a comparison of annual oil yield from a variety of plants and algae. Even microalgae with lower lipids content (30%) will generate 50.00 m3/ha, significantly higher than palm oil. (Mata et al., 2010)
| Source | Annual oil yield (m3/ha) |
|---|---|
| Corn | 0.14 |
| Soybeans | 0.45 |
| Sunflower | 0.95 |
| Canola (Rape) | 1.20 |
| Jatropha | 1.90 |
| Palm | 5.90 |
| Microalgae (30% lipids) | 59.00 |
| Microalgae (50% lipids) | 98.00 |
| Microalgae (70% lipids) | 140.00 |
9.2 What are Algae?
9.2 What are Algae?Algae are eukaryotic organisms, which are organisms whose cells contain a nucleus and other structures (organelles) enclosed within membranes. They live in moist environments, mostly aquatic, and contain chlorophyll.
Algae are not terrestrial plants, which have 1) true roots, stems, and leaves, 2) vascular (conducting) tissues, such as xylem, and phloem, and 3) lack of non-reproductive cells in the reproductive structures. Algae are not cyanobacteria. Cyanobacteria are prokaryotes, which lack membrane-bound organelles and have a single circular chromosome. The figure below shows the cellular composition of blue-algae and the subsequent one shows a micrograph of the cells. The cell has a wall with a gelatinous coat. Just beneath the cell wall is a plasma membrane. Within the cell, there are layers of phycobilisomes, photosynthetic lamellae, ribosomes, protein granules, and circular DNA known as nucleoids. These are typical components of growing plants - however, the components we are interested in are lipid droplets, which are oils that can be extracted from the algae.

Cell structure of blue-algae.

Algae is composed of ~ 50% carbon, 10% nitrogen, and 2% phosphorus. The table below shows the composition of various algae looking at the percentages of protein, carbohydrates, lipids, and nucleic acid.
| Species | Protein | Carbohydrates | Lipids | Nucleic acid |
|---|---|---|---|---|
| Scenedesmus obliquus (green alga) | 50-56 | 10-17 | 12-14 | 3-6 |
| Scenedesmus quadricauda | 47 | - | 1.9 | - |
| Scenedesmus dimorphus | 8-18 | 21-52 | 16-40 | - |
| Chlamydomonas rheinhardii (green alga) | 48 | 17 | 21 | - |
| Chlorella vulgaris (green alga) | 51-58 | 12-17 | 14-22 | 4-5 |
| Chlorella pyrenoidosa | 57 | 26 | 2 | - |
| Spirogyra sp. | 6-20 | 33-64 | 11-21 | - |
| Dunaliella bioculata | 49 | 4 | 8 | - |
| Dunaliella salina | 57 | 32 | 6 | - |
| Euglena gracilis | 39-61 | 14-18 | 14-20 | - |
| Prymnesium parvum | 28-45 | 25-33 | 22-38 | 1-2 |
| Tetraselmis maculata | 52 | 15 | 3 | - |
| Porphyridium cruentum (red alga) | 28-39 | 40-57 | 9-14< | - |
So what are the characteristics of algae?
1. Eukaryotic organisms:
As mentioned above, algae are eukaryotic organisms. The structure of a eukaryote (a typical plant cell) is shown in the first figure below. The second figure below shows the cell structure of a prokaryote, a bacterium, one of two groups of prokaryotic life. Some do not consider the prokaryotes as true algae because they have a different structure, but most include these in the family of algae. There are labels for the different parts of the organisms, but I will not require you to know this information in detail - it is there so if you have a desire to look up more information, you can. The table shows a comparison of both these types of cells.

Eukaryote schematic structure.

Prokaryote schematic structure.
| Category | Eukaryotic cells | Prokaryotic cells |
|---|---|---|
| Size | Fairly large in size | Very minute in size |
| Nuclear region | Nuclear materials surrounded by a membrane | The nuclear region (nucleoid) is not surrounded by a nuclear membrane |
| Chromosome | More than one chromosome is present | Single chromosome present |
| Membrane | Membrane-bound cell organelles are present | Membrane-bound cell organelles are absent |
2. Live in moist environments
These organisms lack a waxy cuticle (the wax in terrestrial plants prevents water loss). There is a wide variety of growth environments for algae. The typical conditions for algae are moist, tropical regions and they can grow in marine and freshwater. Freshwater algae grow in animals, aquatic plants, farm dams, sewage, lakes, rivers, lagoons, snow, mud/sand, and soil.
3. Contain chlorophyll
Algae are mostly photosynthetic, like plants. They have five kinds of photosynthetic pigments (chlorophyll a, b, c, d, and f) and have many accessory pigments that are blue, red, brown, and gold. Chlorophyll is a green pigment found in almost all plant algae and cyanobacteria. It absorbs light and transfers light energy to ATP (adenosine triphosphate).
So how are algae classified?
Algae belong to the Protista kingdom. The figure below shows a schematic of where Protista fits with other classifications of Plantae, Animalia, Fungi, Eubacteria, and Archaebacteria.
Algae can also be classified based on chlorophyll content. The first type is Chromista. These types of algae contain chlorophylls a and c, and examples of the algae include brown algae (golden-brown algae), kelp, and diatoms. These materials are a division of Phaeophyta. These types have a habitat on rocky coasts in temperate zones or open seas (cold waters). The structure is multicellular and they can grow up to 50 m long.

Various kingdoms of life.
Eubacteria (unicellular, prokaryotic)
Archaebacteria (unicellular, prokaryotic)
Protista (eukaryotic, unicellular and multicellular)
Plantae (multicellular, eukaryotic)
Animalia (multicellular, eukaryotic)
Fungi (multicellular, eukaryotic)

This image is a detailed phylogenetic tree that visually represents the evolutionary relationships among a wide array of life forms, branching out from a common ancestral origin. The tree is structured to show how different groups of organisms have diverged over time, highlighting both unicellular and multicellular life across the domains of Bacteria, Archaea, and Eukarya.
Key Features of the Image:
- Central Root: The tree originates from a central point, symbolizing the last universal common ancestor (LUCA).
- Major Domains:
- Bacteria: Includes groups like Cyanobacteria, Purple Bacteria, Mycobacteria, and Gram Positive Bacteria.
- Archaea: Represented by Archaebacteria, showing their distinct lineage.
- Eukarya: A large and diverse branch that includes:
- Protists: Such as Dinoflagellates, Ciliates, Heliozoans, and Amoebas.
- Fungi: Including Yeasts and Neurospora (Ascomycota).
- Plants: From Green Algae to Ferns, Gymnosperms, and Angiosperms.
- Animals: Ranging from Sponges and Cnidarians to Nematodes, Arthropods, Echinoderms, Urochordates, and Vertebrates.
- Organelles: The tree also includes Chloroplasts and Mitochondria, indicating their endosymbiotic origins from ancestral bacteria.
- Illustrations: Each branch is accompanied by a representative illustration of a typical organism from that group, enhancing visual understanding of the diversity and evolutionary lineage.
Red algae are another type and contain chlorophyll a, such as marine algae (seaweed). These organisms are in the division of Rhodophyta, which has over 4000 species. These are some of the oldest eukaryotic organisms on Earth (there are 2 billion-year-old fossils). They are abundant in tropical, warm waters. They act as food and habitat for many marine species. The structure ranges from thin films to complex filamentous membranes. These algae have accessory pigments and the phycobilins (red) mask chlorophyll a. The second figure below shows various red algae. Dinoflagellates are unicellular protists, and these are associated with red tide and bioluminescence.

Green algae contain chlorophylls a and b. They are in the division Chlorophyta. This is the largest and most diverse group of algae. It is found mostly in freshwaters and also on land (rocks, trees, and soil). The structures are single cells (Micrasterias), filamentous algae, colonies (Volvox), and leaf-like shapes (Thalli). Terrestrial plants arose from a green algal ancestor. Both have the same photosynthetic pigments (chlorophyll a and b). Some green algae have a cell wall made of cellulose, similar to terrestrial plants.
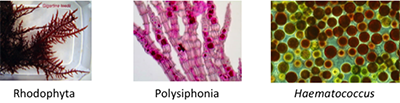

9.3 Algae Growth and Reaction Conditions
9.3 Algae Growth and Reaction ConditionsThere are two primary ways that algae reproduce. Some algae are unicellular and demonstrate the simplest possible life cycles. Note that there is a generative phase and a vegetative phase. During the generative phase, cysts are freed. The cysts open to form gametes and then form the zygote. From there, the vegetative phase occurs so the plant grows and new cysts can form. Most algae have two recognizable phases, sporophyte and gametophyte. The second figure below shows a schematic of the two phases. The main difference is a male and female type is required to form the zygote. I will not be expecting you to know the details in depth, but want you to recognize there are differences.

Life cycle of unicellular algae.
The vegetative phase: zygote, stalk growth, whorl formation, cap formation, maximum cap
The generative phase: from the maximum cap to cyst formation, add secondary nuclei, free cysts with many nuclei, formation of gametes, to opening of cysts releasing gametes, the copulation which results in a zygote

Two-phase regeneration of algae. This type requires a male and female to form the zygote.
Diploid (2N) Zygote goes through mitosis to make a sporophyte, sporophyte undergoes mitosis to produce haploid (1N) spores. Spores undergo germination to make a young gametophyte. Mitosis results in mature male and female gametophytes. Mitosis produces egg and sperm which become a diploid (2N) zygote through fertilization
Algae have a particular path of growth, beginning with a lag phase, and continuing on to an exponential phase, a linear phase, and stationary phase, and a decline of death phase. The figure below shows a schematic of the algal growth rate in a batch culture.

There are several factors that influence the growth rate. The temperature will vary with algae species. The optimal temperature range for phytoplankton cultures is 20-30°C. If temperatures are higher than 35°C, it can be lethal for a number of algal species, especially green microalgae. Temperatures that are lower than 16°C will slow down the growth of algae.
Light also has an effect on the growth of algae: it must not be too strong or weak. In most algal growth cultivation, algae only need about 1/10 of direct sunlight. In most water systems, light only penetrates the top 7-10 cm of water. This is due to bulk algal biomass, which blocks light from reaching into deeper water.
Mixing is another factor that influences the growth of algae. Agitation or circulation is needed to mix algal cultures. An agitator is used for deep photo reactor systems. Paddle wheels are used for open pond systems. And pump circulation is used for a photo-tube system.
Of course, algae need nutrients and the proper pH to grow effectively. Autotrophic growth requires carbon, hydrogen, oxygen, nitrogen, phosphorous, sulfur, iron, and trace elements. The compositional formula of C O1.48 H1.83 N0.11 P0.01 can be used to calculate the minimum nutrient requirement. Under nutrient-limiting conditions, growth is reduced significantly and lipid accumulation is triggered. Algae prefer a pH from neutral to alkaline.
There are particular steps for algal biodiesel production. The figure below shows the processing steps for algae production in biodiesel production. The first step is the cultivation of algae, which includes site selection, algal culture selection, and process optimization. Process optimization includes the design of the bioreactor and necessary components for algal cell growth (nutrients, light, and mass transfer). Once the algae grow to the necessary level, the algae are harvested. The biomass must first be processed in order to dewater, thicken, and dry the algae in order to extract the oil that will then be processed into biodiesel. The biomass process differs depending on the method of oil extraction and biodiesel production. You primarily learned about transesterification to make biodiesel in Lesson 9, but there are other processes being researched and developed.

Steps in algal biodiesel production.
Steps in algal biodiesel production
The first step is algae and site selection. Then there is algae cultivation which receives light, water, CO3, and nutrients. (The algal culture, 0.02-0.06% Total suspend solids-TSS). The algal effluent (2-7% TSS) then goes to harvesting. The culture is recycled and the algal slurry (5-15% TSS) goes to biomass processing (dewatering, thickening, filtering, drying). The nutrients are recycled and the algal cake (15-30% TSS) goes into oil extraction (cell disruption and oil extractions). The lipids and free fatty acids then go to biodiesel production.
9.4 Design of Algae Farms
9.4 Design of Algae FarmsSite selection is an important area to investigate. The best areas to grow algae are areas with adequate sunlight year round, with tropical and subtropical climates. In the US, this includes the following states: Hawaii, California, Arizona, New Mexico, Texas, and Florida. This also means that the temperature will moderate year-round. There also has to be adequate land availability (for open-pond systems) and close proximity to CO2 (i.e., near a power plant or gasifier). To keep costs at a minimum, water and nutrients must be available at lower costs and manpower kept at reasonable rates.
There are two main types of culturing technologies: open systems and closed systems. Open systems include tanks, circular ponds, and raceway ponds. Closed systems include three different types: flat-plate, tubular, and vertical-column enclosed systems. The figures below show several different examples of open and closed systems.
Open systems can be in natural waters, or specifically engineered to grow algae. Natural water systems include algae growth in lakes, lagoons, and ponds, while the engineered systems are those described in the previous paragraph: tanks, circular ponds, and raceway ponds. Of course, there are going to be advantages and disadvantages of open systems. The main advantages are that open systems are simple in design, require low capital and operating costs, and are easy to construct and operate. However, disadvantages include little control of culture conditions, significant evaporative losses, poor light utilization, expensive harvesting, use of a large land area, limited species of algae, problems with contamination, and low mass transfer rates. One of the more common designs is the raceway pond. It has existed since the 1950s and is a closed-loop recirculation channel for mass culture. The design includes a paddlewheel for mixing and recirculation, baffles to guide the flow at bends, and algal harvesting is done behind the paddlewheel. Cyanotech has a field of raceway ponds located in Kona, Hawaii, with a wide variety of algae.


So, what are some of the design features to keep in mind with algae systems? Algal systems are phototrophic, which means they need to obtain energy from sunlight to synthesize organic compounds. Therefore, the growth rate depends on light intensity, temperature, and substrate concentration, as well as pH and species type.
Some factors affect how specific systems are designed. Open pond design is affected by factors including the pond size, the mixing depth, the paddle wheel design, and the carbonator. The carbonator is how the carbon is added to the algae - it can be done in a number of ways, including carbonaceous seed materials, but utilizing CO2 from power systems (generated from the combustion of carbon-based materials) is one of the more common for algae growth - it also mitigates generation of GHG. We will not go into ways to design these systems, as that is above the level of this course.
There are also a variety of closed systems. One type of system is the photobioreactor (PBR). Advantages of a system such as this include 1) compact design, 2) full control of environmental conditions, 3) minimal contamination, 4) high cell density, and 5) low evaporative losses. The disadvantages include: 1) high production costs, typically an order of magnitude higher than open ponds, 2) overheating, and 3) biofouling. A company that has systems such as this is Algatechnologies. They have a plant located in Kibbutz Ketura, Israel. The figure below shows a picture of the various algae they have growing in Israel.

There are three types of designs for the PBRs: flat plate, tubular, and vertical column. Advantages of the flat plate PBR include 1) large surface area, 2) good light path, 3) good biomass productivity, and low O2 build-up. However, the drawbacks include 1) difficulty in scaling up, 2) difficulty in controlling temperature, and 3) algae wall growth. A flat plate PBR is shown in the third figure. For the tubular PBR, advantages include 1) good biomass productivity, 2) good mass transfer, 3) good mixing and low shear stress, and 4) reduced photoinhibition and photooxidation. Tubular PBRs also have disadvantages: 1) gradients of pH, dissolved O2 and CO2 along the tubes, 2) O2 build-up, 3) algae wall growth, 4) requirement of large land area, and 5) a decrease in illumination surface area upon scale-up. The two previous figures are examples of tubular PBRs. Vertical column PBRs have different advantages and disadvantages. The positive features include 1) high mass transfer, 2) good mixing and low shear stress, 3) low energy consumption, 4) high potential for scalability, 5) easy sterilization, and 6) reduced photoinhibition and photooxidation. The negative features are 1) a small illumination surface area, 2) the need for sophisticated materials for construction, and 3) decrease in illumination surface area upon scale-up. The figure below shows a vertical column PBR.

We can compare open and closed systems by looking at various parameters and providing general comparisons of these systems. The table below provides a list of parameters to compare for each type of system. Open systems tend to cost less, but process control is difficult, and the growth rate is lower. Closed systems are a much higher cost, but control is much better and productivity is therefore higher.
| Parameters | Open systems | Closed systems |
|---|---|---|
| Contamination | High | Low |
| Process control | Difficult | Possible |
| Species control | Not possible | Possible |
| Mixing | Not uniform | Uniform |
| Foot-print | Extremely high | Very low |
| Area/volume ratio | Low (5 to 10 m-1) | High (20-200 m-1) |
| Capital cost | Low | High |
| Operation cost | Low | High |
| Water losses | Very high | Low |
| Light utilization | Low | High |
| Productivity | Low | High (3-5 times) |
| Biomass conc. | Low | High (3-5 times) |
| Mass transfer | Low | High |
9.5 Algae Harvesting and Separation Technologies
9.5 Algae Harvesting and Separation TechnologiesThe following video is produced by Los Alamos National Laboratory in New Mexico. The video provides a nice overview of how algae are generated, how to harvest them, and the areas of research LANL are focusing on to improve various aspects of the process to make it more economical.
Turning Algae into Energy (3:12)
Transcript: Turning Algae into Energy (3:12)
RICHARD SAYRE: The upside of renewable fuels is that they're sustainable. They reduce the environmental impact, and they can help potentially mitigate climate change. We particularly like algae as biomass or bio fuel feedstock. Algae grow about two to 10 times faster than the best terrestrial crop plants.
They often will store oils as a energy reserve product. And oils that come out of these algae, we've found can be directly converted into fuels, using preexisting technologies.
JOSE OLIVARES: So the laboratory is interested in this area because we have a mission around energy security, providing new technologies for energy for the nation. The big problem, the big challenge is how to get that whole process to be economically and energetically efficient.
RICHARD SAYRE: To make algal biofuels economically viable, there are two very important factors that we have to improve, and that's the biomass productivity per unit land area or the yield. And the other very important factor that we need to improve is reducing the costs of harvesting the algae from the pond.
JOSE OLIVARES: The laboratory is actually developing some nice technologies in a number of different areas, transforming the algae so that it can produce more lipids, more biomass, overall better productivity, under better conditions.
PETER LAMMERS: You've seen how we transfer the algae from the lab from, colonies on a Petri dish to larger cultures. We bring them out here, adapt them to the outdoors and the sunshine. We begin to scale them up. Pretty soon, we'll have algae at hundreds of acres, if not thousands of acres.
RICHARD SAYRE: Another important concern is water, how much water are we going to use? And to address those issues, we're now focusing on developing heat-tolerant strains of algae that can be grown in ponds that are covered with plastic to reduce evaporation. We've figured out how to engineer algae so they can use light more efficiently than normal algae do. We've seen up to a two-fold increase in growth.
We've also figured out how to engineer algae to make more oil. So at the time that we want to harvest the algae, we'll induce the expression of a gene that will cause all of the algae to stick to each other, settle out of the pond and then pick them up. Maybe the last reason why we like algae is that we can recycle the nutrients that are in waste water.
PETER LAMMERS: Algae can do wastewater treatment better than conventional systems. So why not take an energy-intensive expensive process and turn it into an energy-generating system where you're getting clean water and liquid fuels as your two products, and do that in a way that generates revenue rather than consumes revenue?
Algae are typically in a dilute concentration in water, and biomass recovery from a dilute medium accounts for 20-30% of the total production cost. Algae can be harvested using: 1) sedimentation (gravity settling), 2) membrane separation (micro/ultrafiltration), 3) flocculation, 4) flotation, and 5) centrifugation.
Sedimentation is the initial phase of separating the algae from water. Once agitation is completed, the algae are allowed to settle and densify. However, other methods most likely will also be required to achieve complete separation.
Membrane separation is a form of filtration. In the lab, a funnel is attached to a vacuum flask. The contents are poured out onto the filter on the funnel and allowed to dry some on the filter as the vacuum continues to be pulled. This method can be used to collect microalgae with low density but is typically done on a small scale. But the main disadvantage is membrane fouling. There are three modifications: 1) reverse-flow vacuum, 2) direct vacuum with stirring blade above the filter, and 3) belt compression.
Flocculation is another technique. Flocculation is a method where something is added to the mixture of water and algae that causes the algae to “clump” together (or aggregate) and form colloids. Chemical flocculants include alum and ferric chloride. Chitosan is a biological flocculant, but has a fairly high cost. Autoflocculation is an introduction of CO2 to an algal system to cause algae to flocculate on their own. Flocculation is often used in combination with a filter compressor, as described in the last paragraph.
Froth floatation is another method for harvesting and separating algae from water. This is a technique that has been used in coal and ore cleaning technology for many years. It is based on density differences in materials. Typically air bubbles are incorporated into the unit. Sometimes an additional organic chemical or adjustment of pH will enhance separation. For algal systems, the algae will accumulate with the froth of bubbles at the top, and there is some way to collect or scrape the froth and algae from the top to separate it from the water. It is an expensive technology that, at this point, it may be too expensive to use commercially. There is also the possibility of combining froth flotation with flocculation. For example, when alum is used as a flocculant for the algae, air is bubbled through to separate the flocculant by density. It can also be combined with a filter compressor.
One of the more commonly used machines is a continuous-flow centrifuge. It is efficient and collects both algae and other particles. However, it is more commonly used for the production of value-added products from algae and not for fuel generation.
Along with these separation techniques, moisture needs to be removed from algae to improve the shelf-life. Algae are concentrated from water through a series of processes, including the separation process. The concentration of algae in the pond starts at about 0.10-0.15% (v/v). After flocculation and settling, the concentration is increased to 0.7%. Using a belt filter process, the concentration increases to 2% (v/v). Drying algae from 2% to 50% v/v requires almost 60% of the energy content of the algae, which is a costly factor of algae use.
Lipid Separation Technologies
This is an important aspect of the use of algae to generate fuels. It is likely also an expensive option. The algae cells have to be subjected to cell disruption for the release of the desired products. Physical methods include 1) mechanical disruption (i.e., bead mills), 2) electric fields, 3) sonication, 4) osmotic shock, and 5) expeller press. There are also chemical and biological methods, including 1) solvent extraction (single solvent, co-solvent, and direct reaction by transesterification), 2) supercritical fluids, and 3) enzymatic extraction.
Single solvent extraction is one of the more common methods. A solvent that is chemically similar to the lipids is used, such as hexane or petroleum ether (this is just a light petroleum-based solvent). This is a commercial process. Extraction takes place at elevated temperatures and pressure. Advantages include an increased rate of mass transfer and solvent accessibility, and a reduced dielectric constant of immiscible solvents. The use of a co-solvent process is a little different. There are two criteria used to select a co-solvent. Selection should include: 1) a more polar co-solvent that disrupts the algae cell membrane, and 2) a second less polar co-solvent to better match the polarity of the lipids being extracted (alkanes can meet this criterion). There are several examples of co-solvent extraction. One method was developed by Bligh and Dyer in 1959. Alcohol and chloroform are the solvents, and the majority of the lipids dissolve into the chloroform phase. The interactions include water/methanol > methanol/chloroform > lipid/chloroform. Other combinations of co-solvents include 1) hexane/isopropanol, 2) dimethyl sulfoxide (DMSO)/petroleum ether, and 3) hexane/ethanol.
Supercritical extraction is similar to solvent extraction. The main difference is that the solvent is maintained until certain pressure and temperature conditions are met, which changes the solvent properties and helps extract the materials. It is often done on a smaller scale and may not be useful at an industrial level.
Enzymatic extraction is also similar to solvent extraction, except instead of a solvent, an enzyme is used to separate the materials.
As discussed in the biodiesel lesson , the reaction of transesterification is often used to convert lipids into fatty ester methyl esters (FAMEs) using alcohol and a catalyst. The advantages of using this method are the high recovery of volatile medium-chain triglycerides and the fact that antioxidants are not necessary to protect unsaturated lipids. There are other methods as well, as discussed near the end of the biodiesel lesson.
Direct Biofuel Production from Algae
Besides separating out the lipids to make diesel fuel, other fuels can be obtained from algae directly. These include alcohols such as ethanol and butanol, hydrogen, and methane.
Alcohols can be made from algae by heterotrophic (carbon nutrients from organic materials) fermentation of starch to alcohols, including ethanol and butanol. Marine algae used for this are Chlorella vulgaris and Chlamydomonas perigramulata. Procedures include starch accumulation via photosynthesis, subsequent anaerobic fermentation under dark conditions to produce alcohol, and alcohol extracted directly from the algal culture media. Hydrogen can also be produced directly from algae through photofermentation and dark fermentation. Methane can be produced by anaerobic conversion of algae. It can be coupled with other processes (using the residue after lipids are removed, for example). Challenges include the high protein content of biomass, which can result in NH3 inhibition and can be overcome by co-digestion with high carbon co-substrates. The figure below shows a schematic of different processes to convert algae and the range of fuel products that can be made.

Fuel products from various processes of algae.
Algae
- Gasification to syngas
- Fischer Tropch to catalytic upgrading to liquid hydrocarbon fuels
- Higher alcohol synthesis to MeOH, EtOH, etc
- Hydrogen
- Pyrolysis to liquid or vapor fuel to catalytic upgrading to transportation fuels: liquid or gas
- Supercritical Fluids to liquid or vapor fuel to catalytic upgrading to transportation fuels: liquid or gas
- Anaerobic digestion to biogas
9.6 Assignments Overview
9.6 Assignments OverviewFinal Project Rough Draft
Please submit a rough draft of your final project by the specified due date in Canvas. To review, your project should include the following elements:
Format
The report should be 8-12 pages in length. This includes figures and tables. It should be in 12-point font with 1” margins. You can use line spacing from 1-2. It is to be written in English, with proper grammar, and as free from typographical errors as possible. You will lose points if your English writing is poor.
The following format should be followed:
- Cover Page – Title, Name, Course Info
- Introduction
- Body of Paper:
- Biomass choice
- Literature review on the biomass (APA style, please!)
- Requirements for location
- Climate (i.e., tropical, subtropical, moderate,…)
- Land area required or another type of facility to grow
- Method of production
- Product markets around location
- Economic evidence
- Other factors (environmental, political, tax issues, etc.)
- Summary and Conclusions
- References
Use as filename your user ID_Draft (i.e., ceb7_Draft)
Upload it to the Rough Draft Dropbox.
(30 points)
9.7 Summary and Final Tasks
9.7 Summary and Final TasksSummary
Algae are an excellent source of lipids for biodiesel production. They can grow under conditions that terrestrial plants cannot grow, in water, using CO2 and waste materials. Pairing the proper species of algae with appropriate growing conditions will increase the amount of oil produced by the algae. Discussion on the economics of algae production will be included in another lesson, in order to compare it to other sources of biodiesel. For now, I will note that production under highly controlled conditions can be expensive.
Lesson Objectives
By the end of this lesson, you should be able to:
- explain how algae grow and the important factors in growth for fuels;
- describe the use of algae for various fuels, from making biodiesel to gases and alcohols;
- evaluate the efficacy of using algae for fuels.
References
Mata et al. (2010) Renew. Sust. Energy Rev. 14: 217–232.
Liao, W., Khanal, S., Park, S.Y., Li, Y., BEEMS Module A3, Algae, USDA Higher Education Challenger Program 2009-38411-19761, 2009.
Reminder - Complete all of the Lesson 10 tasks!
You have reached the end of Lesson 10! Double-check the Road Map on the Lesson 10 Overview page to make sure you have completed all of the activities listed there before you begin Lesson 11.
Questions?
If there is anything in the lesson materials that you would like to comment on, or don't quite understand, please post your thoughts and/or questions to our Throughout the Course Questions & Comments discussion forum and/or set up an appointment during office hours. While you are there, feel free to post responses to your classmates if you can help.
Lesson 10: Economics of Biomass Production – Ethanol, Butanol, and Biodiesel
Lesson 10: Economics of Biomass Production – Ethanol, Butanol, and BiodieselOverview
We’ve been going over the chemistry and processing aspects of making ethanol, butanol, and biodiesel, so now we’re going to throw in some economics! Cool! If the processes are not economic, then they won’t happen. The first part of the lesson will include some background information on the economic aspects of energy evaluation. Then we’ll focus on the current costs of ethanol, butanol, and biodiesel, and what tend to be the best sources for making biofuels. We’ll finish off the lesson by comparing the amount of energy required to grow, harvest, and make the fuel, to the amount of energy available in the fuel.
Lesson Objectives
By the end of this lesson, you should be able to:
- describe background information on energy economics;
- evaluate the supply and demand issues for ethanol, butanol, and biodiesel;
- utilize supply and demand information to understand economics;
- compare the amount of energy used to produce biofuel versus the amount of energy made available by the fuel.
Lesson 10 Road Map
This lesson will take us one week to complete. Please refer to the Course Syllabus for specific time frames and assignment due dates.
Questions?
If there is anything in the lesson materials that you would like to comment on or don't quite understand, please post your thoughts and/or questions to our Throughout the Course Questions and Comments discussion forum. The discussion forum will be checked regularly. While you are there, feel free to post responses to your classmates if you are able to help. Regular office hours will be held to provide help for EGEE 439 students.
10.1 Background for Economic Evaluation of Biofuel Use
10.1 Background for Economic Evaluation of Biofuel UseEssentially, I am a big proponent of the use of alternative fuels, as I believe they are necessary for our environment. However, to convince others of the environmental benefits, we must also have economic benefits. The use of biofuels in power generation must be competitive with coal and natural gas, and using alternative fuels in transportation must be economically competitive with petroleum refining of crude oil. The following section provides methods to evaluate the economics of energy facilities.
There is a time value of money. The purchasing power of money is continuously declining, there is inflation, and investors want an increase in their investment beyond inflation. There are ways to track the time value of money, and this is done through the calculation of annual price indexes. The Consumer Price Index (CPI) is a measure of the overall cost of living, while the Producer Price Index (PPI) is a measure of the cost of goods and other expenditures needed to stay in business. The table below shows the CPI and PPI for the USA and the CPI for the United Kingdom from 1997-2010.
| Year | CPI, USA | PPI, USA | CPI, UK |
|---|---|---|---|
| 1997 | 87.4 | 95.5 | 96.3 |
| 1998 | 94.7 | 94.7 | 97.9 |
| 1999 | 96.7 | 96.4 | 99.1 |
| 2000 | 100.0 | 100.0 | 100.0 |
| 2001 | 102.8 | 102.0 | 101.2 |
| 2002 | 104.5 | 100.7 | 102.5 |
| 2003 | 106.9 | 103.8 | 103.9 |
| 2004 | 109.7 | 107.6 | 105.3 |
| 2005 | 113.4 | 112.8 | 107.4 |
| 2006 | 117.1 | 116.2 | 109.9 |
| 2007 | 120.4 | 120.7 | 112.5 |
| 2008 | 125.0 | 128.3 | 116.5 |
| 2009 | 124.6 | 125.1 | 119.0 |
| 2010 | 126.7 | n/a | 123.0 |
Indexed to Year 2000 = 100
Note: 2010 PPI value for US not available at time book went to press
Source for data as cited in Energy Systems Engineering: US Bureau of Labor Statistics (2011) for USA data; UK National Statistics (2011).
Example 10-1 Factor of CPI and PPI (from ESE book)
A particular model of car costs $17,000 in 1998, and $28,000 in 2005, given in current dollars for each year. How much are each of these values worth in constant 2002 dollars? Use the US CPI values from Table above.
Values from the table are used to correct the constant 2002 dollars, for $17,000 in 1998 dollars, and $28,000 in 2005 dollars, respectively.
If energy projects are going to be funded, the costs and predicted earnings for these projects must be valued for a later date and compared to the option of keeping money in savings or investments. A method to include the actual cost of money in the future is discounting. In discounting, current funds are projected into the future, knowing that the money today is worth less in the future due to inflation. Other terms are also defined:
- Term of project: Planning horizon over which cash flow is assessed – typically the value of years N is divided over the project.
- Initial cost: One-time expense at the beginning of the first compounding period.
- Annuity: Annual increment of cash flow related to the project – can be positive or negative.
- Salvage value: One-time positive cash flow at the end of the planning horizon of the project – due to the sale of assets at the actual condition at the end.
Projects can be evaluated without discounting. We are not going to discuss discounting beyond this part because I don’t want to spend too much time on discounting – we can look at energy projects without it. Discounting is also ignored for projects with short lifetimes. These shorter projects are evaluated with what is called a simple payback, and this is the method we’ll focus on. The factors in the simple payback include:
- adding up all cash flows in and out of the project;
- this is known as net present value (NPV);
- if NPV is positive, the project is financially viable;
- breakeven point – the year in which total annuities from the project surpass the initial costs.
There is also terminology for energy projects. One such value is called the Capital Recovery Factor (CRF). This is applied to electricity generation. It is a measure used to evaluate the relationship between cash flow and investment cost. This can be applied to short-term investments (i.e., a project that takes place over 10 years or less).
Annual capital cost (ACC) can be determined from the following equation (1) and the CRF can be determined from ACC and NPV shown in equation (2):
(1) ACC = annuity – NPV/N, where NPV is the net present value and N is the number of years.
(2) CRF = ACC/NPV
The Electric Power Research Institute (EPRI) recommends a maximum CRF value of 12%.
So, how can energy projects be evaluated in order to determine their financial viability? There are multiple ways – the most common is the present worth method (PW). This method takes into account the discounting of money. For the present worth method, all the elements of the financial analysis are discounted back to the present worth. This takes into account the positive and negative elements of cash flow summed up. If the NPV is positive, it would be a financially attractive project. In this method, a minimum attractive rate of return (MARR) would be chosen (kind of like an interest rate). Example 10-2 first looks at a simple payback NPV. While I do not expect you to know how to discount, I expect you to know that it can affect the cost of a project, as suggested in the following example.
Example 10-2 Net Worth of a Plant (from ESE book)
A municipality is considering an investment in a small-scale energy system that will cost $6.5 million to install, and then generate a new annuity of $400,000/year for 25 years, with a salvage value at the end of $1 million. Calculate the net worth of the project using a simple payback approach.
Annuity= +$400,000 per year
N = 25 years
Salvage value = $1,000,000
Installation cost = $6,500,000
NPV = total value of annuities + salvage value – installation cost
This looks like the project is a good deal.
However, if discounting were to be included in this, there would be a factor to reduce the value of the annuities for the 25 years, so the salvage value would be reduced by a significant factor. These factors would be based on a parameter called the minimal attractive rate of return (MARR) – if the MARR is 5%, this project would not be viable.
Another parameter that can be used is the called the benefit-cost ratio (B/C) method. This is a method that is a ratio of all the benefits of the project to all of the costs. If the B/C ratio is greater than 1, the project is acceptable. When the B/C ratio is less than 1, the project is unacceptable. If the B/C value is close to 1, it may be necessary to reevaluate the project to see if minor changes would make it acceptable. The conventional B/C ratio equation is shown in equation (3).
(3) B/C = Total benefits / (Initial cost + Operating costs)
Example 10-3 Benefit to Cost Ratio
Let’s take the example in 10-2. In Part a, we’ll calculate the B/C for the investment using the simple payback method. In Part b, we’ll add in $50,000/year in operating costs for 25 years.
- Total benefits include:
Income (annuity over 25 years) $400,000 x 25 = $10,000,000
Salvage $1,000,000
Total costs = $6,500,000
- Now we’ll add in the operating costs for 25 years
25 x $50,000 = $1,250,000
So operating costs can influence the costs.
Discounting will also influence the costs, maybe to the point that the project would not be viable.
The last factor we will look at is the Levelized Cost of Energy. This is a method that incorporates the role of both the initial capital costs and ongoing costs. The levelized cost is determined per unit of energy output. Therefore, all the cost factors are combined into a cost-per-unit measure. We need a predicted average output of electricity in kWh and a sum of all the costs on an annual basis, divided by the annual output (see equation 4):
(4) Levelized cost = (Total annual cost)/(annual output)
Total annual cost = annualized capital cost + operating cost + return on investment (ROI)
Annual output is in kWh
Example 10-4 Levelized Cost of Energy
So, now we’ll continue with Example 10-3 and input the information into a formula to examine the Levelized Cost of Energy. This plant would produce 2.6 million kWh per year.
Income per year $400,000
Salvage $1,000,000
Total costs = $6,500,000
$50,000/year operating costs for 25 years
So, the first thing to do is to determine the overall costs on an annual basis – recall that we are not discounting at all, we are doing a simple payback method.
Costs on an annual basis
= Income/year – Operating Costs/Year + (Salvage – Initial costs) /25 years
= $400,000 – $50,000 + ($1,000,000 - $6,500,000)/25
= $130,000 per year
Levelized costs = $130,000/2.6 million kWh
= $0.050/kWh
The average electric energy price in the US in 2004 for all types of customers was $0.0762 – this has not changed drastically in the current year. Therefore, with a plant of this size, this would be competitive in the US.
Another aspect that needs to be considered is the direct costs versus external costs and benefits. Direct costs include capital repayment costs and operating costs. Operating costs include energy supply, labor, and maintenance costs. However, there are also external costs that are sometimes called overhead. These costs include health care and lost productivity due to pollution. Direct benefits include revenues from selling the product and services. External benefits include benefits to the local environment or the use of unusual energy technology, which could encourage visitors to the company.
Costs are important, but by using biofuels, we also expect a benefit to the environment. So, there have been interventions in energy investments for social aims. We expect the alternative form of energy to be “clean” energy. This means that there may be intervention in the marketplace because of the potential social benefit, which is typically done by government. Intervention by government can be on the local, state, and federal levels. Why do this? It is because we can’t put a “value” on the social benefit, and it gives fledgling technologies a chance to grow in sales volume to allow for competition in the marketplace. For example, government subsidies were given to the production of ethanol from corn for many years, and now ethanol from corn in the US is the most viable method of ethanol production (data will be presented on this in the following section).
There is more than one method of intervention. One support mechanism is to support research and development (R&D). The support usually comes from the government, but industry may also participate so that they are not supporting the funding all on their own. Government can also support commercial installation and operating systems. This can be in the form of direct costs, tax credits, and interest rate buydown.
Most of our discussion so far has been on electricity systems. But how do we evaluate the production of biofuels and economic viability? There are two metrics that are used: 1) net energy balance ratio and 2) life cycle assessment. The net energy balance ratio is a metric to compare bioenergy systems. It is a ratio to compare energy available for consumption to the energy used to produce the fuel. So, for example, how might we look at ethanol? The energy carrier itself is ethanol. However, energy was consumed in order to grow, harvest, and process the corn in order to produce ethanol. This is known as energy to produce. The ratio would look like this:
(5) NEB = Energy from fuel/ Energy to produce
If the NEB ratio is greater than 1, there is more energy available for consumption than is used to produce the biofuel. If the NEB ratio is less than 1, then more energy is required to produce the fuel than is available in the fuel for consumption – which makes for an unattractive project. This is a good metric for debate, but it is not a parameter that can stand alone.
The other metric is life cycle assessment (LCA). It is a method of product assessment that considers all aspects of the product’s life cycle. One way to express this is a cradle-to-grave analysis. For biofuels in transportation, it could be plant/harvest-to-wheels. In the petroleum industry, it’s known as well-to-wheels.
Example 10-5 Shows How the NEB and LCA are Determined
There are two farms that grow corn to produce ethanol. Farm A is 40.2 km from the ethanol plant. Farm A sells corn for $289.36 per metric ton. Farm B is 160.0 km from the ethanol plant, and corn sells for $284.02 per metric ton. Other information:
Truckload can carry 10.9 metric tons (500 bushels)
Truck emits 212.3 g CO2eq/metric ton-km (310 g CO2eq/ton-mile)
Plant needs 130.6 metric tons per year (6000 bushels/year)
Truck weighs 9.1 metric tons empty
Plants needs: 130.6 metric tons/year @ 10.9 metric tons
= 12 truckloads per year
For the two farms, examine the two farms – both for economics and GHG emissions.
Farm A
- Economic return
- Transportation
- GHG
- Empty truck:
- Full truck:
- Total 2.98 Mg CO2eq
Farm B
- Economic return
- Transportation
- GHG
- Empty truck:
- Full truck:
- Total 11.90 Mg CO2eq
As you can see, Farm A produces a better economic return. And it also puts out less CO2eq as well, so Farm A is the better plant to provide the raw material.
We also want to determine the fuel productivity per unit of cropland per year. This should be done before choosing a regional crop. Keep in mind that, depending on location, sunlight provides 100-250 W/m2 – however, less than 1% is available in starches and oils as a raw material for conversion to fuel. Research has focused on the conversion of lignocellulosic biomass (whole biomass) and utilization of the entire plant in order to produce fuel and/or value-added products – the economics improve under these conditions. Data on changes to the land must also be incorporated, especially if the land is being changed to sustain a large-scale biofuels program. For example, if a rainforest or peatland is removed to make space, the material from the land is typically burned, adding CO2 to the atmosphere before even getting the system started.
So, what is the NEB ratio of ethanol? Early on in the conversion of corn to ethanol, the ratio was positive, but not a very high ratio – 1.25. However, recent assessments show an improved NEB of 1.9-2.3. And if the fuel used to run the plant that produces the ethanol is 50% biomass, the NEB is 2.8, almost 3. As you will see in the economics, the production of ethanol is economical. The problem comes up when petroleum prices go down, such as in recent months; ethanol production is less economical.
So, what about the NEB ratio of biodiesel? When compared to the NEB of ethanol, in the early stages of biofuel production, the NEB ratio of biodiesel was 1.9 when co-products were included. It is higher because biodiesel production requires reduced energy requirements during processing, mainly because less distillation is required. The one drawback to biodiesel production is that GHG contains N2O, so the use of biodiesel has ~60% of petrodiesel emissions instead of being neutral. Another issue for biodiesel is soybeans suffer as a crop due to lower yields per land area compared to corn. Example 10-6 shows the NEB ratio calculation of soybeans to biodiesel.
Example 10-6 Calculate the Ratio of Energy Available in the Resulting Biodiesel to the Total Energy Input
Does biodiesel provide more energy than it consumes?
- Each gallon of biodiesel requires 7.7 lbs. of soy as feedstock
- Acre yields ~452 lbs. soy
- Assume pure biodiesel
- Assume a gallon of biodiesel contains 117,000 Btu net
| Input | Energy (1000 Btu) |
|---|---|
| Fuels | 1025 |
| Fertilizer | 615 |
| Embodied energy | 205 |
| All other | 205 |
| Input | Energy (1000 Btu) |
|---|---|
| Process heat & electricity | 1784 |
| Embodied energy | 595 |
| Transportation | 297 |
| All other | 297 |
Solution:
- Energy in to produce biodiesel
- Energy out from biodiesel produced
- = 2.02
This 2.02. A typical NEB for biodiesel production is ~1.9 to as high as 2.8.
So, are ethanol and biodiesel being consumed in our current fuel supply? Yes, they are, but partially because of an Environmental Protection Agency (EPA) mandate to use oxygenated fuel in a blend with gasoline and diesel fuel. Approximately 10% of the gasoline supply is ethanol, while in diesel, it’s estimated that diesel sold contains ~5-6% biodiesel.
10.2 Ethanol Production and Economics
10.2 Ethanol Production and EconomicsThe major feedstock for ethanol has been coarse grains (i.e., corn). Second-generation ethanol (from cellulosic biomass) is around ~7% of the total ethanol production. The figure below shows the global ethanol production by feedstock from 2007-2019.

Global ethanol production by feedstock from 2007-2019.
| Year | Coarse Grains | Wheat | Sugar Cane | Molasses | Sugar Beet | Biomass-based (2nd Generation) | Roots and Tuber | Other Feed Stocks | Total |
|---|---|---|---|---|---|---|---|---|---|
| 2007-2009 | 37 | 1 | 27 | 3 | 2 | - | - | 5 | 75 |
| 2010 | 50 | 2 | 30 | 2 | 3 | - | - | 6 | 93 |
| 2011 | 54 | 3 | 32 | 4 | 2 | - | - | 5 | 100 |
| 2012 | 56 | 4 | 35 | 4 | 2 | - | - | 6 | 107 |
| 2013 | 59 | 5 | 38 | 3 | 2 | 1 | 1 | 6 | 115 |
| 2014 | 61 | 6 | 43 | 3 | 2 | 2 | 1 | 6 | 124 |
| 2015 | 64 | 5 | 45 | 4 | 2 | 3 | 1 | 7 | 131 |
| 2016 | 65 | 6 | 47 | 5 | 2 | 4 | 1 | 7 | 143 |
| 2017 | 65 | 6 | 52 | 4 | 3 | 5 | 1 | 7 | 153 |
| 2018 | 66 | 6 | 53 | 4 | 3 | 8 | 1 | 8 | 149 |
| 2019 | 61 | 6 | 59 | 3 | 2 | 13 | 1 | 8 | 159 |
In 2013, world ethanol production came primarily from the US (corn), Brazil (sugarcane), and Europe (sugar beets, wheat). The figure below shows ethanol production contributions, in millions of gallons, from all over the world. In addition to Brazil, ethanol production from sugarcane is also being done in Australia, Columbia, India, Peru, Cuba, Ethiopia, Vietnam, and Zimbabwe. In the US, ethanol from corn accounts for ~97% of the total ethanol production in the US.

World ethanol production, millions of gallons, from various countries for 2013.
| Country | Millions of Gallons of Ethanol |
|---|---|
| US | 13300 |
| Brazil | 6267 |
| Europe | 1371 |
| China | 696 |
| India | 545 |
| Canada | asdf |
| 523 | asdf |
| Rest of the World | 727 |
The table below shows a comparison of costs for first-generation ethanol feedstock along with their production costs. The data in this table is from 2006, but it gives you an idea of why ethanol is made from corn in the US: because it is less expensive and more profitable. However, as seen in the other charts, the use of sugar-based materials like sugarcane and sugar beets is growing, as well as the use of cellulosic materials.
| Cost Item | Feedstock Costsb | Processing Costs | Total Costs |
|---|---|---|---|
| US Corn wet milling | 0.40 | 0.63 | 1.03 |
| US Corn dry milling | 0.53 | 0.52 | 1.05 |
| US Sugarcane | 1.48 | 0.92 | 2.40 |
| US Sugar beets | 1.58 | 0.77 | 2.35 |
| US Molassesc | 0.91 | 0.36 | 1.27 |
| US Raw Sugarc | 3.12 | 0.36 | 3.48 |
| US Refined Sugarc | 3.61 | 0.36 | 3.97 |
| Brazil Sugarcaned | 0.30 | 0.51 | 0.81 |
| EU Sugar Beetsd | 0.97 | 1.92 | 2.89 |
a Excludes capital costs
b Feedstock costs for US corn wet and dry milling are net feedstock costs; feedstock for US sugarcane and sugar beets are gross feedstock costs
c Excludes transportation costs
d Average of published estimates
Credit: rd.usda.gov
The figure below shows the overall process of making ethanol from corn. It also shows the additional products made from corn. If you recall from Lesson 7, DDGS is a grain that can be used to feed cattle. Corn oil is also produced for use. Typical yields of each product per bushel of corn are shown (2.8 gal of ethanol, 17 lbs. of CO2, and 17 lbs. of DDGS).

Product distribution of corn.
Corn
- Starch – 73% db
- Yeast
- CO2—0.54 g/g (th)
~17lbs/bu
18.9 lb/bu (th) - Ethanol--0.57 g/g (th)
(0.511 g/g glucose)
2.8 gal/bu
3.0 gal/bu (th)
- Protein, fiber, oil – 27% db
- DDGS
~17lbs/bu
- DDGS
So, what are the ethanol revenue streams? The figure below shows that the revenue streams are ethanol, DDGS, and CO2. The revenue streams are market-driven; ethanol is the plant’s most valuable product and typically generates 80% of the total revenue. The DDGS represents 15-20% of the revenue, and CO2 represents a small amount of revenue. The revenue margins are tight, however, and the sale of DDGS and CO2 is probably essential for the plant to be profitable.

Ethanol revenue streams. The numbers at the top of each bar are the revenue $ per bushel of corn. The values with the “@” are the values of how each product is sold.
| Product | Revenue $ per bushel of corn | Value ($) of how each product is sold |
|---|---|---|
| Ethanol | 4.05 | 1.50/gal |
| Ethanol | 5.40 | 2.00/gal |
| Ethanol | 6.75 | /gal |
| DDGS | 0.51 | 60/ton |
| DDGS | 1.02 | 120/ton |
| DDGS | 1.53 | 180/ton |
| CO2 | 0.07 | 8/ton |
The figure below shows the volatility of the price of corn, the price of ethanol, and the price of gasoline. Notice the price of gasoline and the price of ethanol are highly correlated, at least since 2009. For example, in 2010, the price of gasoline and the price of ethanol were ~$2.00 per gal. However, in recent months, with the price of oil going down significantly, expect that the profitability of ethanol will be less.

This image presents a line graph comparing the prices of ethanol, gasoline, and corn over the period from 2005 to 2011. The x-axis represents the years, while the y-axis shows prices in dollars. Ethanol and gasoline prices are measured in dollars per gallon, and corn prices are measured in dollars per bushel.
Three distinct lines represent the price trends:
- Blue line: Ethanol
- Orange line: Gasoline
- Green line: Corn
The graph visually demonstrates that the prices of these three commodities are highly correlated over time, often rising and falling in similar patterns. This correlation reflects the interconnected nature of energy and agricultural markets, particularly because corn is a primary feedstock for ethanol production.
A note on the graph explains that all prices shown are daily settlement prices for the nearest-to-maturity futures contracts. These contracts are traded on:
- The Chicago Mercantile Exchange (CME) for corn and ethanol
- The New York Mercantile Exchange (NYMEX) for reformulated blendstock gasoline
The major cost of producing ethanol from corn is the cost of the feedstock itself. The figure below shows the cost of feedstock is 55% of the expenses for the production of ethanol from corn, while energy is 21%, materials are 11%, and maintenance and personnel are 13%. If a bushel of corn sells for $4/bu or more, then the percentage for the feedstock price goes to 65-75% of the expenses.

Another issue with the production of ethanol is that water is used, and water is becoming less available. Water is used for gasoline production as well, but water use is a little higher for ethanol production (for gasoline, 2.5 gallons of water per gallon of gasoline is used, while for ethanol it is 3 gallons of water per gallon of ethanol). The extra water use is due to growing the plants for harvest.
10.3 Economics of Butanol Production
10.3 Economics of Butanol ProductionJust as ethanol can be produced from corn, so, too, can butanol. The main disadvantage to butanol production is that yields are significantly lower. But recall that the advantages include a better interaction of butanol with gasoline than ethanol, as well as the higher energy content of butanol. If all of the available residues of the corn along with the corn are converted to acetone-butanol (AB), the result would be the production of 22.1 x 10⁹ gallons of AB biofuel – this is a yearly amount. In 2009, 10.6 x 10⁹ gallons of ethanol were produced from corn – this would be equivalent to 7.42 x 10⁹ gallons of butanol on an equal energy basis. Recall that butanol production is accomplished in a similar fashion to ethanol production; it uses different enzymes. The figure below shows the schematic of wheat straw processing that was shown in Lesson 7. A description of the process and some information on production using wheat straw and other feedstocks can be found at the end of Lesson 7.

A schematic diagram of acetone butanol ethanol (ABE) production from wheat straw.
This image presents a flowchart detailing the bioconversion of wheat straw into butanol, a valuable biofuel and industrial solvent. The process begins with milling, where wheat straw is mechanically broken down to increase surface area and improve downstream processing efficiency.
Next, the milled straw undergoes chemical treatment with sulfuric acid (H₂SO₄), which helps to break down the lignocellulosic structure and release fermentable sugars. This is followed by enzymatic hydrolysis, where enzymes further degrade the pretreated biomass into simpler sugars. During this step, lignin, a non-fermentable component, is separated as a byproduct.
The resulting sugar-rich hydrolysate is then subjected to fermentation, during which microorganisms convert the sugars into butanol (BuOH), along with carbon dioxide (CO₂) and hydrogen gas (H₂) as gaseous byproducts. After fermentation, solids are separated from the liquid phase.
The liquid undergoes a recovery process, which includes distillation and possibly other purification steps. During this stage, butanol, water, and other components labeled A & E (unspecified in the diagram) are recovered.
The final output of the process is butanol, with several byproducts including lignin, CO₂, H₂, and distillation residues, making this a comprehensive representation of a lignocellulosic biomass-to-butanol conversion pathway.
So, how much investment might be necessary to build a plant for butanol production? An extensive computer simulation was done to determine costs, payback time and return on investment – we will not discuss the details of the computer simulation because it is beyond the scope of this course. However, I will provide a summary of the study to give you an idea of the related costs. An estimate was done for producing butanol from wheat straw (BEEMS Module B6). The estimate was based on a plant size of 150 x 106 kg/year, or 48 x 106 gallons of butanol per year, and the following costs were determined:
- Equipment purchase cost $27.66 x 10⁶
- Total plant direct cost (TPDC) $88.08 x 10⁶
- Total plant indirect cost (TPIC) $52.85 x 10⁶
- Total plant cost (TPC = TDPC + TPIC) $140.93 x 10⁶
- Contractor’s fee & contingency (CFC) $21.14 x 10⁶
- Direct fixed capital cost (DFC = TPC+CFC) $162.06 x 10⁶
It would take ~$162 million to build a butanol plant that produces 48 million gallons of butanol. Operating costs must also be taken into consideration, which would be more than $200,000,000. The major factors in the operating costs are utilities (59% of the costs) and raw materials (21%). With these costs in mind, it was estimated that for a grassroots plant, the butanol production cost would be $1.37/kg, or $4.28/gal. For an annexed plant, the cost of butanol production would be lower, or $0.82/kg, or $2.55/gal. The researchers doing this work have been successful at producing AB from lignocellulosic substrates, though there are some challenges ahead. In conclusion, these are the overall estimates:
- The cost of production of butanol from WS is $1.37/kg (distillative recovery)
- Return on investment is 19.87% and payback time is 5.03 years
- Expansion of an existing plant would result in a production cost of $1.07/kg (distillative recovery), and $0.82/kg (membrane recovery)
- Utilities affect butanol production costs most
This kind of information may convince a venture capitalist to contribute to the building of a butanol plant, especially if the payback is in 5 years and the return on investment is 19.87%. However, this was a computer simulation and would have to be updated for current prices. That could alter the numbers.
10.4 Economics of Biodiesel Production, Including Economics of Algae
10.4 Economics of Biodiesel Production, Including Economics of AlgaeOne of the major feedstocks for biodiesel is soy oil or any other vegetable oil. Animal fats can also be used, but as pointed out in a previous lesson, animal fats can produce more by-products that cause issues (i.e., free fatty acids which can cause soap formation). Jatropha is another oil used for biodiesel production. Second-generation biodiesel can be produced from algae, and use of algae for biodiesel production is a growing market. The feedstock is the primary cost involved in producing biofuel. Haas et al (2006) estimate that the cost of oil is ~ 85% of the production costs, while Duncan (2003) estimates it to be ~80% of the production costs.

Global biodiesel production by feedstock.
| Year | Vegetable Oil | Nob Agricultural (animal fats) | Jatropha | Biomass-based (2nd Generation) | Total |
|---|---|---|---|---|---|
| 2007-2009 | 13 | 1.75 | .25 | 0 | 15 |
| 2010 | 18.5 | 2.25 | .25 | 0 | 21 |
| 2011 | 20 | 2.5 | .5 | 0 | 23 |
| 2012 | 21.25 | 3.5 | .75 | 0 | 25.5 |
| 2013 | 22.75 | 3.25 | 1 | 0 | 27 |
| 2014 | 24.5 | 3.5 | 1.25 | 0 | 29.25 |
| 2015 | 26.75 | 3.25 | 1.5 | 0 | 31.5 |
| 2016 | 27.5 | 3.5 | 2.75 | .25 | 34 |
| 2017 | 29 | 3.75 | 2.5 | 1 | 36.25 |
| 2018 | 29.75 | 3.75 | 2.5 | 1 | 36.25 |
| 2019 | 31 | 4 | 3 | 2.5 | 40.5 |
The figures below show the challenges of the economics behind biodiesel production. The first figure shows the breakeven price of biodiesel plotted with the actual biodiesel price. Most years, the biodiesel price and breakeven price were the same. But in 2011 and 2013, the biodiesel sold at a higher price than the breakeven price, a good indicator of demand. In the second figure we can see that in most years, the ULSD price was lower than biodiesel, by ~$1 per gallon, but in late 2013 and 2014, the price was almost the same and the margin between the two was much closer. Again, this suggests a greater demand for biodiesel as well as the costs becoming closer to the processing of petrodiesel.


Most of the information we are looking at is based on soy oil production, but as we have discussed in Lessons 9 and 10, biodiesel can be produced in ways other than transesterification and can be produced from other sources, such as algae. The reason for producing biodiesel using other methods would be to reduce the oxygenates from the biodiesel, mainly so the biodiesel could be used as jet fuel, as jet fuel cannot have oxygenates in it. The reason behind using algae is because of the advantages of 1) using land areas that would not be able to grow terrestrial plants, 2) the ability of algae to produce much greater amounts of oil per landmass than plants like soy, and 3) algae plants take in much greater amounts of CO2 and could be located near a power plant to utilize emissions from the flue gases. However, as you will see from data in the following tables, the costs of oil from algae are still fairly high. One of the useful aspects of growing algae is it can be grown in water sources that can contain salt or some sediment - even though water usage may be high, some of the water may be separated out and used again.
The following data is from an overview review article on producing biodiesel from algae, from 2007. In the table below, Chisti compared the production of biodiesel from PBR and an open raceway pond, to show differences in production.
| Variable | Photobioreactor facility | Raceway ponds |
|---|---|---|
| Annual biomass production (kg) | 100,000 | 100,000 |
| Volumetric productivity (kg m-3 d-1) | 1.535 | 0.117 |
| Areal productivity (kg m-2 d-1) | 0.048a 0.072c | 0.035b |
| Biomass concentration in broth (kg m-3) | 4.00 | 0.14 |
| Dilution rate (d-1) | 0.384 | 0.250 |
| Area needed (m2) | 5681 | 7828 |
| Oil yield (m3 ha-1) | 136.9d 58.7e | 99.4d 42.6e |
| Annual CO2 consumption (kg) | 183,333 | 183,333 |
| System geometry | 132 parallel tubes/unit; 80 m long tubes; 0.06 m tube diameter | 978 m2/pond; 12 m wide, 82 m long, 0.30 m deep |
| Number of units | 6 | 8 |
a Based on facility area.
b Based on actual pond area.
c Based on the projected area of photobioreactor tubes.
d Based on 70% by wt oil in biomass.
e Based on 30% by wt oil in biomass.
Credit: Chisti, Y., Biotechnology Advances, 2007
As you can see, the PBR can produce more oil for a number of reasons, but the costs associated with the PBR are higher. Chisti estimates the cost to produce algae oil on a scale of 10,000 tons at $0.95 per pound. This particular article estimated that the cost of producing biodiesel from algae would range from $10.60 – $11.13 per gallon. The processing costs for palm oil would be ~$0.53 per gallon, and the processing costs for soybean oil would be $3.48 per gallon. A slightly more recent report, a project to estimate the price of biodiesel, indicates prices from $10.66 per gallon to as high as $19.16 depending on location and oil production. (Davis, R., et al., 2012) Yet another computer-simulated estimate provided by Richardson et al. shows a cost to produce algal oil at $0.25 - $1.61 per pound, not too far off of costs to produce soybean oil ($0.35 - $0.38 per pound) (Richardson et al., 2010). They also estimated the cost of biodiesel from algae oil to be $2.35 per gallon, less than a gallon of ULSD. However, they may not be including algae harvesting costs in this estimate.
So, you can see that biodiesel from microalgae is a long way off from being a reality, yet it probably has a future if the costs can be brought down due to benefits.
So, how does biodiesel compare to ethanol as a fuel? Ethanol from corn has become a big business here in the US. The first figure below shows the production by county and plant locations for ethanol production from corn. We saw earlier in the lesson that ethanol from corn has an NEB ratio greater than 1 and is improving, and that production of ethanol from corn is the least expensive here in the US. The amount of ethanol produced in 2014 was 13 billion gallons per year and is a $30 billion-a-year industry. It makes up 10% of the gasoline pool, although the government has mandated that the gasoline pool can utilize up to 10% ethanol, and companies get tax credits for using ethanol. Because of the high price of gasoline due to oil prices, demand for gasoline fell, and this has made it more difficult for ethanol producers to continue selling ethanol at the level that they had over the last several years. Recently, the EPA examined whether to raise the ethanol limit to 15%, but because of the drop in oil prices, the EPA has been reconsidering this and has not set levels for 2015. In the assignment section, you will read an article related to this so you can get a feel for what is facing the biofuels industry. Remember that by including ethanol in the gasoline pool, we reduce GHG emissions.
The second figure below shows the location of biodiesel facilities in the US from 2007. If you would like to view a more recent map and location of facilities (2015), go to Biodiesel Magazine. According to the most recent statistics, there are 145 biodiesel facilities in the US that provide more than 2.60 billion gallons of biodiesel per year (in 2010, the production of biodiesel was less than 0.4 billion gallons per year, which is an order of magnitude increase). Biodiesel makes up about 5-6% of the diesel fuel pool. Biodiesel plants tend to be smaller and more evenly distributed across the US than ethanol. You will also read an article related to biodiesel pricing. RIN means renewable identification number and RFS stands for renewable fuel standard.


10.5 Assignments Overview
10.5 Assignments OverviewWe don't have an assignment specific to this Lesson this week. We have Final Project related assignments. Check the syllabus for details.
10.6 Summary and Final Tasks
10.6 Summary and Final TasksSummary
The economics of biofuels depend on the overall economic health of the country as well as what is going on in the fuel industry for fossil fuels. Biofuels have come a long way in becoming a part of the U.S. industry, but issues with gasoline and diesel prices, as well as government involvement, will continue to dictate the use of biofuels.
Are you beginning to grasp the complexity of the issues surrounding how the biofuel production industry will survive going forward? If it reduces the carbon footprint, isn’t it worthwhile to continue to support biofuel production?
Lesson Objectives
By the end of this lesson, you should be able to:
- describe background information on energy economics;
- evaluate the supply and demand issues for ethanol, butanol, and biodiesel;
- utilize supply and demand information to understand economics;
- compare the amount of energy used to produce biofuel versus the amount of energy made available by the fuel.
References
Vanek, F., Albright, L., and Angenent, L., “Energy Systems Engineering: Evaluation and Implementation”, Second Edition, McGraw-Hill, 2012.
Pryor, Scott; Li, Yebo; Liao, Wei; Hodge, David; “Sugar-based and Starch-based Ethanol,” BEEMS Module B5, USDA Higher Education Challenger Program, 2009-38411-19761, 2009.
Xiaodong Du and Lihong Lu McPhail, "Inside the Black Box: The Price Linkage and Transmission Between Energy and Agricultural Markets," Energy Journal, Vol. 33, No. 2, 2012, pp. 171-194.
Nasib Qureshi, Adriano Pinto Mariano, Vijay Singh, Thaddeus Chukwuemeka Ezeji, “Biomass to Butanol,” BEEMS Module B6, USDA Higher Education Challenger Program, 2009-38411-19761, 2009.
Haas, M.J., McAloon, A.J., Yee, W.C., Foglia, T.A., “A process model to estimate biodiesel production costs,” Bioresource Technology, 97, 671-678, 2006.
Duncan, J., “Costs of biodiesel production,” Energy Efficiency and Conservation Authority Report, 2003.
Chisti, Y., “Biodiesel from microalgae: A research review,” Biotechnology Advances, 25, 294-306, 2007.
Davis, R., et al., “Renewable diesel from algal lipids: An integrated baseline for costs, emissions, emission and resource potential from a harmonized model,” Technical Report, prepared for US DOE Energy Biomass Program, ANL/ESD/12; NREL/TP-5100; PNNL-21437, June 2012.
Richardson, J.W., Outlaw, J.L., and Allison, M., “The economics of microalgae,” AgBioForum, 13 (2), 119-130, 2010.
Reminder - Complete all of the Lesson tasks!
You have reached the end of this lesson! Double-check the Road Map on this lesson Overview page to make sure you have completed all of the activities listed there before you begin the next Lesson.
Questions?
If there is anything in the lesson materials that you would like to comment on, or don't quite understand, please post your thoughts and/or questions to our Throughout the Course Questions & Comments discussion forum and/or set up an appointment during office hours. While you are there, feel free to post responses to your classmates if you can help.
Lesson 11: Additional Processes for Fuels from Biomass
Lesson 11: Additional Processes for Fuels from BiomassOverview
We’ve covered the basics of petroleum-based fuel production and electricity generation from coal, as well as processing aspects of several biofuels - primarily ethanol production from corn and sugar, and biodiesel production from vegetable oils. We also covered some thermochemical methods to produce liquid jet and diesel fuels that are more like petro-jet and diesel fuel. As you might think, there are other processes available to produce liquid and gaseous fuels beyond ethanol and biodiesel which we covered in the previous lessons. This lesson will cover anaerobic digestion, which makes gaseous fuels using organic materials and enzymes; and syngas fermentation, which can make liquid fuels and alcohols from gases using enzymes. We will also cover some biomass-to-liquid processes that are still in the research phase.
Lesson Objectives
By the end of this lesson, you should be able to:
- explain what anaerobic digestion is;
- explain what syngas fermentation is;
- utilize the information on each to supplement biofuel liquids conversion technologies;
- evaluate the best methods to date for biofuel liquids conversion technologies.
Lesson 11 Road Map
This is the final lesson of the course. This lesson will take two weeks to complete. You should complete the reading during the first week. Your Final Project will be due at the time specified and there will be Quiz #5. Please refer to the Course Syllabus for specific time frames and assignment due dates.
Questions?
If there is anything in the lesson materials that you would like to comment on or don't quite understand, please post your thoughts and/or questions to our Throughout the Course Questions and Comments discussion forum. The discussion forum will be checked regularly. While you are there, feel free to post responses to your classmates if you are able to help. Regular office hours will be held to provide help for EGEE 439 students.
11.1 Anaerobic Digestion
11.1 Anaerobic DigestionAnaerobic digestion (AD) is a biological process that breaks down organic materials (feedstocks) in the absence of oxygen (anaerobic conditions) into methane (CH4) and carbon dioxide (CO2). It is a process that occurs naturally in bogs, lake sediments, oceans, and digestive tracts. Cows contain one of the most well-known fermentation vats, the rumen, which is part of the stomach (in other animals as well). Fermentation takes place during digestion! The figure below shows a schematic of anaerobic digestion.

Anaerobic digester process.
This is the anaerobic digester process. Organic materials (carbohydrates, proteins, fats, oils, etc.) enter the cycle. The sugars, amino acids, and fatty acids become H2, CO2, and organic acids. From there the digester effluents (residual solids and water) are removed. The digestor yields CH4, CO2, and H2S which are removed as biogas.
There are benefits to using an anaerobic digester, particularly when raising livestock. Biogas, which contains methane and hydrogen, will be produced that can be used as a fuel. From a waste treatment point of view, it reduces the volume and mass of the waste, as well as reduces organic content and biodegradability of waste so that the residual matter can be better used as soil amendment and fertilizer. There are also environmental benefits: 1) odors and emissions of greenhouse gases (i.e., methane) and volatile organic compounds are reduced, and 2) the digester will destroy pathogens in the waste.
So, what are the biological processes that occur during AD? The bacteria ferment and convert complex organic materials into acetate and hydrogen. There are four basic phases of anaerobic digestion, which is a synergistic process using anaerobic microorganisms: 1) hydrolysis, 2) acidogenesis, 3) acetogenesis, and 4) methanogenesis. The figure below shows the progression and types of products for each phase.

Schematic of four phases of biogas production.
Four Phases of Biogas Production
Phase 1 – Hydrolysis
Complex Biopolymers (proteins, polysaccharides, fats/oils) in the presence of fermentative bacteria become broken-down monomers and oligomers (sugars, amino acids, peptides)
Phase 2 – Acidogenesis
The broken-down monomers and oligomers in the presence of fermentative bacteria become propionate, butyrate, etc (short-chain volatile organic acids)
Phase 3 – Acetogenesis
The broken-down monomers and oligomers from phase 1, in the presence of fermentative bacteria, can also become acetate or H2 + CO2. The propionate and butyrate in the presence of Acetogens (H2 producing or consuming) can also become acetate or H2 + CO2.
Phase 4 – Methanogenesis
H2 + CO2 in the presence of CO2 -reducing methanogens becomes CH4 + CO2. Acetate in the presence of acetoclastic methanogens can also become CH4 + CO2
Hydrolysis Biochemistry
We have talked about hydrolysis in earlier lessons. Hydrolysis is a reaction with water. Acid and base can be used to accelerate the reaction. However, this occurs in enzymes as well. The figure below shows the hydrolysis reaction, and how cellulose, starch, and simple sugars can be broken down by water and enzymes. In anaerobic digestion, the enzymes are exoenzymes (cellulosome, protease, etc.) from a number of bacteria, protozoa, and fungi (see Reaction 1).
(1)
(Sources: cellulose, starch, sugars, fats, oils) (Products: mono-sugars [glucose, xylose, etc.], fatty acids)

Acidogenesis Biochemistry
During acidogenesis, soluble monomers are converted into small organic compounds, such as short-chain (volatile) acids (propionic, formic, lactic, butyric, succinic acids – see Reaction 2), ketones (glycerol, acetone), and alcohols (ethanol, methanol – see Reaction 3).
(2)
(3)
Acetogenesis Biochemistry
The acidogenesis intermediates are attacked by acetogenic bacteria; the products from acetogenesis include acetic acid, CO2, and H2. Reactions 4-7 show the reactions that occur during acetogenesis:
(4)
(5)
(6)
(7)
Several bacteria contribute to acetogenesis, including:
Syntrophobacter wolinii, propionate decomposer
Syntrophomonos wolfei, butyrate decomposer
Clostridium spp., peptococcus anaerobes, lactobacillus, and actinomyces are acid formers.
Methanogenesis Biochemistry
The last phase of anaerobic digestion is the methanogenesis phase. Several reactions take place using the intermediate products from the other phases, with the main product being methane. Reactions 8-13 show the common reactions that take place during methanogenesis:
(8)
(9)
(10)
(11)
(12)
(13)
Several bacterial contribute to methanogenesis, including:
Methanobacterium, methanobacillus, methanococcus, and methanosarcina, etc.
As you can see, the bacteria for anaerobic digestion are different from other enzymes for making biofuels, and could even be in our own stomachs!
Any kind of organic matter can be fed to an anaerobic digester, including manure and litter, food wastes, green wastes, plant biomass, and wastewater sludge. The materials that compose these feedstocks include polysaccharides, proteins, and fats/oils. Some of the organic materials degrade at a slow rate; hydrolysis of cellulose and hemicellulose is rate limiting. There are some organic materials that do not biodegrade: lignin, peptidoglycan, and membrane-associated proteins. The organic residues contain water and biomass composed of volatile solids and fixed solids (minerals or ash after combustion). And it’s the volatile solids (VS) that can be non-biodegradable and biodegradable.
As we discussed regarding the pretreatment of biomass for making ethanol, the efficiency of anaerobic digestion improves with pretreatment. Hydrolysis of cellulose and hemicellulose (phase 1 in AD) is improved with pretreatment because it overcomes biomass recalcitrance. As discussed in a previous lesson, pretreatment options include treatments with acids, alkalines, steam explosion, size reduction, etc. Common alkaline agents include: NaOH, Ca(OH)2, and NH3.
Theoretical methane yield (YCH4, m3 STP/kg substrate converted) can be calculated from the elemental composition of a substrate:
The table below shows the substrate, a common elemental formula, and the theoretical methane yield for each.
| Substrate | Elemental formula | Theoretical methane yield >(m3 STP/kg) |
|---|---|---|
| Carbohydrates | (CH2O)n | 0.37 |
| Proteins | C106H168O34N28S | 0.51 |
| Fat | C8H15O | 1.0 |
| Plant biomass | C5H9O2.5NS0.025 | 0.48 |
The first figure below shows the biogas yield for several different feedstocks in m3/ton. Be aware that after digestion, there is a biogas yield, and the remainder of the digestion, is known as digestate. The biogas typically contains 50-60% CH4, with the rest primarily composed of CO2 and other trace gases. The digestate contains fiber, nutrients, and water, and these can be used for compost, animal bedding, and composite boards. The second figure below shows a schematic of the components of the digester.

Biogas yields (m3/ton) of different biomass feedstocks.
Biogas Yields (m3/ton) of Different Biomass Feedstocks:
- Maize 200
- Grasses 110
- Mangel 75
- Used Fats 800
- Fatty Wastes 400
- Vegetable Oil 350
- Sewage Waste 80
- Distillery Waste 80
- Dairy Waste 55
- Fruits & Vegetables 35
- Poultry Manure 35
- Cattle Manure 30
- Pig Manure 25

Schematic of an anaerobic digester facility and product output.
Farm leads to manure which goes to a digester. The products of the digester are separated into solids & liquids, and biogas. The biogas is stored in tanks and then sent to a CHP unit. From there the energy is used to produce power, or heat to warm the farm or the digester. The solids and liquids go through dewatering and are used as bedding, compost, or fertilizer
There are several factors that will affect anaerobic digestion. Different feedstocks will degrade at different rates and produce different amounts of methane (as seen in the Biogas yields graph and table above). That depends on the biological degradability and methane potential, the carbon and nutrients available, and the moisture content of each feed material. As noted in the Biogas yields graph and table above, fats contain the highest volatile solids and can generate the greatest amount of biogas. Solids take a longer time to digest than feedstocks that are soluble. Nutrients are also important. A suitable carbon to nitrogen ratio (C/N) is less than 30, and the carbon to phosphorous ration (C/P) should be less than 50. For example, lignocellulosic biomass has a high C/N ratio, so nitrogen sources must be added. Nutrients also must be free of toxic components. Other factors that can influence digestion are the availability and location of feed materials (transportation costs involved here), logistics of how to get materials to certain sites, and whether size reduction is going to be necessary.
Digester performance will also depend on the microbial population in the digester. This means maintaining adequate quantities of fermenting bacteria and methanogens. A recycled stream is used to take a portion of the liquid digestate as inoculum (material used for inoculation of feed materials). Depending on feeds, there may be an acclimation period to reach acceptable conditions.
There are also variations in the operational factors and environmental conditions of the digester. It is important to know the total solids (TS) and volatile solids (VS) in the feeds, the best retention times, and to provide mixing. Operational factors include the amount and strength type of feedstocks added to the digester. The operation also depends on maintaining the microorganism population and organic loading in reactors, whether operating in a batch or continuous reactor. Mixing is also an important factor in any reaction. The goal of mixing is to keep the microorganisms in close interaction with the feed and nutrients. Mixing also prevents the formation of a floating crust layer, which can reduce the amount of biogas percolating out of the slurry. Mixing will benefit the breakdown of volatile solids and increase biogas production, but keep in mind mixing adds energy cost, so this must be balanced. The types of mixing in this system include gas bubbling and/or mechanical mixing.
Environmental conditions include the temperature and pH of the reactor, as well as concentrations of materials, including the volatile fatty acids, ammonia, salt, and cationic ions. Different methanogens react in temperature ranges. The type of methanogens that produce the most biogas are thermophiles, but the digester must be operating between 40-70 °C. Methanogens also prefer neutral pH conditions (6.5-8.2). Accumulation of volatile fatty acids (VFAs) can cause the digestion to stop producing gas – this happens when too much digestible organic material is added, a toxic compound is added, or there is a sudden temperature change. Toxic materials include: 1) oxygen, 2) antibiotics, 3) cleaning chemicals, 4) inorganic acids, 5) alkali and alkaline earth salt toxicity, 6) heavy metals, 7) sulfides, and 8) ammonia. An additional reason for AD process failure has to do with the reaction within being out of balance. In particular, the rate of acid formation and methane production should be equal. This is done by maintaining definite ranges and ratios of the following: solids loading, alkalinity, temperature, pH, mixing, and controlling VFA formation. When the methanogen microorganisms cannot keep up with the fermenting bacteria, the digester becomes acidic – also known as “sour.”
An ambient temperature liquid phase AD reactor is called a covered lagoon. The advantages of the covered lagoon are the low cost, ease of construction, and control of odor control with manure storage. Disadvantages include difficult sludge removal and only seasonal production. However, there are several designs that have controlled temperature, and are typical to different types of reactors: 1) complete mixing, 2) plug flow, 3) sequencing batch, and 4) fixed film. The table below shows a comparison of the variables for each type of anaerobic digester configuration.
| Characteristic | Covered Storage | Plug Flow Digester | Mixed Plug Flow Digester | Complete Mix Digester | Fixed Film Digester | Induced Blanket Digester | Two- Stage Digester |
|---|---|---|---|---|---|---|---|
| Digestion Vessel | Clay or synthetic-lined storage | Rectangle tank in-ground | Rectangle tank in-ground | Round/square in/above ground tank | In/above ground tank | In/above ground tank | In/above ground tank |
| Level of technology | Low | Low | Medium | Medium | Medium | High | High |
| Added heat | No | Yes | Yes | Yes | Optional | Yes | Yes |
| Total solids | 3-6% | 11-13% | 3-13% | 3-10% | 2-4% | <8% | ~5% |
| Solids characteristics | Coarse | Coarse | Medium Coarse | Coarse | Fine | .. | .. |
| Retention time(days) | 60+ | 15+ | 15+ | 15+ | <4 | 3-5 | 10-13 |
| Farm type | Dairy, Swine | Dairy, Swine | Dairy, Swine | Dairy | Dairy, Swine | Dairy, Swine | Dairy, Swine |
| Optimum location | All climates | All climates | All climates | All climates | Temperate/warm | All climates | All climates |
11.2 Syngas Fermentation
11.2 Syngas FermentationThere is an unusual process for liquids production from biomass: gasification followed by fermentation of gases into liquids. During gasification, the gases of CO, H2, and CO2 are formed (as we have learned in past lessons), but instead of using something like FT or MTG, this is formation of liquids fuels through a fermentation process using a microbial catalyst. Products are typically ethanol, acetone, and butanol. Gasification was discussed in depth in Lesson 4, but I will cover it briefly here to remind you of the various processing aspects. Gasification takes place at temperatures of 750-900°C under partial oxidation. It happens in the following steps: drying; pyrolysis in absence of O2; gas-solid reactions to produce H2, CO, and CH4 from char; and gas-phase reactions that manage the amounts of H2, CO, and CH4. It is most often known as syngas, but if it contains N2, then it is called producer gas. Syngas can be generated from any hydrocarbon feed. The main cost associated with gas-to-liquid technologies has to do with the syngas production, which is over half of the capital costs. Costs can be improved using improved thermal efficiency through better heat utilization and process integration and by decreasing capital costs.
There are advantages to using fermentation as part of liquids generation rather than using something like Fischer-Tropsch:
- As with any gasification, it is independent of feedstock, and therefore, independent of biomass chemical composition.
- Microorganisms are very specific to ethanol production, whereas with chemical catalysts, there are a wide range of reaction products.
- No pretreatment is required as part of the biochemical platform.
- Complete conversion of biomass is achieved, including lignin conversion. This can reduce the environmental impact of waste disposal.
- Fermentation takes place at near ambient temperature and pressure, thus at a place where costs can be reduced significantly.
- The requirement for CO/H2 ratio is flexible.
Of course, there are disadvantages as well. These include:
- Gas-liquid mass transfer limitations.
- Low ethanol productivity, usually related to low cell density.
- Impurities in syngas generated from biomass.
- Sensitivity of microorganisms to environmental conditions (pH, oxygen concentration, and redox potential).
The microorganisms that are used for ethanol production from syngas are acetogens that can produce ethanol, acetic acid, and other products from CO and H2 in the presence of CO2. The organisms are: 1) Clostridium strain P11, 2) Clostridium ljungdahlii, 3) Clostridium woodii, 4) Clostridium thermoaceticum, and 5) Clostridium carboxidivorans P7. (Wilkens and Atiyeh, 2011) The bacteria are some of the same ones that occur during anaerobic digestion: acetogens and acidogens. I won’t go into great detail about the biochemistry, as it is a little beyond the scope of this class. The acetogens utilize the reductive acetyl-CoA (or Wood-Ljungdahl) pathway to grow carbons and hydrogens on single carbon substrates such as CO and CO2. Clostridium bacteria use H2 or organic compounds as the electron source for the reduction of CO2 to acetyl-CoA, which are further converted into acids and alcohols. The process proceeds in two phases: acidogenic and solventogenic phases. In the acidogenic phase, mainly acids are produced (i.e., acetic acid and butyric acid). In the solventogenic phase, mainly solvents are produced (i.e., alcohols such as ethanol and butanol). Reactions 14 and 15 show the reaction chemistry for acetic acid formation, and reactions 16 and 17 show the reaction chemistry for ethanol formation:
Acetic acid formation:
(14)
(15)
Ethanol formation:
(16)
(17)
In summation, gasification-fermentation alternative is a method for biofuel production utilizing syngas generated from gasification of biomass feedstocks. Because it is biologically based, it has the potential for reducing costs compared to other syngas to liquid technologies, but there are several challenges related to this technology. Challenges include low alcohol productivity, low syngas conversion efficiency, and limitations in gas-liquid mass transfer. These challenges must be solved if this technology is to become economically viable.
11.3 Microbial Fuel Cells
11.3 Microbial Fuel CellsA microbial fuel cell is a bio-electrochemical device that can convert chemical energy directly into electrical energy. But first, let’s go over what a fuel cell is. A fuel cell is a battery of sorts. So, what is a battery? A battery is when two different types of metals are connected together through what is called an electrolyte. One metal is an anode, which is a metal that “wants” to give off electrons when under the right conditions. One metal is a cathode, which is a metal that “wants” to accept electrons when under the right conditions. When these two metals are in close proximity, and there is a fluid that will conduct the electrons (an electrolyte), then the flow of electrons from one metal to the other can occur. And we can capture that flow to extract electricity. Batteries that we use in remotes for televisions will eventually get used up and need to be replaced. This is an example of a primary battery. The figures below show a generic cell, a stack of cells using zinc and copper, and a picture of a Voltaic cell as created by Alessandro Volta (inventor).


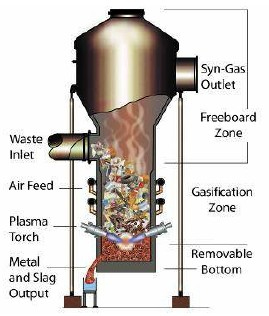
We can also have secondary batteries, where the flow of electricity is established to provide electrical energy, but we can also apply electricity to the battery to reverse the flow of electrons and regenerate the life of the battery. While regenerated batteries don’t last forever, you can definitely get your money’s worth because you can regenerate them.
Fuel cells are also a sort of battery, but the materials are different and flow continuously to produce electricity. The figure below shows a generic fuel cell. As with a battery, it has an anode, cathode, and electrolyte. The anode typically uses hydrogen as the fuel, on the left side of the figure, and oxygen as the oxidant used in the cathode, on the right side of the figure. The electrolyte contains a fluid but also a membrane that removes the protons from the hydrogen, leaving the electrons to flow, and allowing oxygen to accept the protons to form water. Typically, these cells are run on hydrogen and oxygen, but we get electrical energy out rather than heat from burning hydrogen and oxygen.

At the anode, hydrogen reacts as shown in reaction 18:
(18)
This is an oxidation reaction that produces protons and electrons at the anode. The protons then migrate through an acidic electrolyte, and the electrons travel through an external circuit. Both arrive at the cathode to react with the oxidant, oxygen, as shown in reaction 19:
(19)
This is the reduction reaction, where oxygen can be supplied purely or in the air. Essentially, the total circuit is completed through the mass transfer of protons in the electrolyte and external electrical circuit. There will be a small amount of heat lost through the electrodes. The overall reaction is shown in reaction 20:
(20)
The water and waste heat are the by-products and must be removed on a continuous basis. An ideal voltage from this reaction is 1.22 volts, but less than that voltage will be realized. Other issues include the use of fuel different from hydrogen (methanol, hydrocarbons, etc.) and the fact that fuel cells produce direct current (DC) when most applications require alternating current. This little bit of background has been provided so a short discussion on microbial fuel cells can be had.
We are not going to go into great depth on microbial fuel cells, as some of the biochemistry can be complex. I will provide you with some generic information on how a microbial fuel cell is set up. These are bio-electro-chemical devices, which convert chemical energy directly into electrical energy. As we have discussed before, there are some steps that need to occur. Cellulose is hydrolyzed into sugars, i.e., glucose. The sugars are fermented into short-chain fatty acids, alcohols, hydrogen, and carbon dioxide. Finally, electricigenesis takes place, producing electricity, and carbon dioxide is carried through. Electricigenesis converts chemical energy to electrical energy by the catalytic reaction of microorganisms. The anode is anaerobic, and the anode chamber contains microbes and feedstock. The fuel is oxidized by microorganisms, which generate CO2, electrons, and protons. The cathode is the aerobic chamber, and just like other fuel cells, a proton exchange membrane separates the two chambers and allows only protons (H+ ions) to pass.
There are two types of microbial fuel cells (MFCs): mediator or mediator-less. The mediator type was demonstrated in the early 20th century and uses a mediator: a chemical that transfers electrons from the bacteria in the cell to the anode. Some of these chemicals include thionine, methyl viologen, methyl blue, humic acid, and neutral red. These chemicals are expensive and toxic. Mediator-less MFCs are a more recent development, from the 1970s. These types of cells have electrochemically active redox proteins such as cytochromes on their outer membrane that can transfer electrons directly to the anode. Some electrochemically active bacteria are Shewanella putrefaciens and Aeromomas hydrophila. Some bacteria have pili on the external membrane, which allows for electron production through the pili. They are beginning to find commercial use in the treatment of wastewater. I’ve included some YouTube videos explaining how the MFCs work. The first video is a brief but complete explanation of how an MFC works.
MudWatt Microbial Fuel Cell (2:03)
Transcript: MudWatt Microbial Fuel Cell (2:03)
[MUSIC PLAYING]
PRESENTER: The MudWatt Microbial Fuel Cell is a bio-electrical device that uses the natural metabolisms of microbes found within soil to produce electrical energy. Here's how it works.
The MudWatt is comprised of two graphite felt electrodes-- the anode and the cathode-- held within a durable airtight container. The piece of electronics on top is used for experimentation and also features an LED light which blinks using the power of the microbes within your soil. The user simply fills the MudWatt with wet soil, burying the anode while resting the cathode on top.
In this configuration, a healthy community of electricity-generating microbes will develop on the surface of the anode in a matter of days. These bacteria have unique metabolic abilities which enable them to respire the sugars and nutrients within the soil and deposit electrons onto the anode as part of their natural metabolism. Protons and carbon dioxide are released into the soil as metabolic byproducts and diffuse toward the cathode.
Once transferred to the anode, the electron then travels through the electrode wire, through the MudWatt electronics to the cathode. While passing through the electronics, this electrical current will light the LED light on top, giving you a visual indication that your microbes are healthy and happy.
At the cathode, the electron interacts with oxygen in the air, as well as protons coming from the anode, to form water. The carbon dioxide originating from the anode is released into the air. The cycle continues, limited only by the availability of nutrients within the soil and oxygen within the air.
[MUSIC PLAYING]
The next video is a little longer and goes into a little more depth of what was described above.
Microbial Fuel Cell (7:23)
Transcript: Microbial Fuel Cell (7:23)
[MUSIC PLAYING]
PRESENTER: Inspiration to build bio-electrochemical systems came from a discovery of certain microbes that live in soil. These bacteria swim up to the solid metal-- such as iron-- transfer electrons to the metal, dissolving it in process. This is similar to aerobic bacteria that transfer electrons to molecules of oxygen during respiration. The electron transfer generates electricity. To where there's electricity, there is power.
PRESENTER: To harvest the electricity, a bio-electrochemical fuel cell is used. This system consists of two compartments-- an anode compartment and a cathode compartment. These two compartments are separated by a membrane. A biofilm grows on the end of it.
[MUSIC PLAYING]
An organic feed stream, such as wastewater, enters the fuel cell, where it is oxidized by the biofilm. Simultaneously, oxidized products leave the fuel cell. The oxidation of organics-- for instance, acetate-- produces electrons and protons. This half-reaction releases a certain amount of energy.
Electrons are conducted over the wire while protons move through the membrane to the cathode to uphold electron neutrality. Oxygen is supplied to the cathode chamber. There accepts the electrons and reacts with the protons to form water. This half-reaction also releases a certain amount of energy.
[MUSIC PLAYING]
The theoretical maximum energy gain is determined by combining both half-reactions. However, resistances are found in multiple layers of the fuel cell.
[MUSIC PLAYING]
The Olmec losses are found in the electrical wire and in the proton transfer from the anode to the cathode. Concentration losses occur when the rate of mass transferred either to anode or cathode compartment limits the rate of product formation. Bacterial metabolic losses can be described by the amount of energy that is used by the microbes to grow.
The energy is harvested to form a protein gradient over the inner membrane. Activation losses are described by the capacity of the biofilm to transfer the electrons to the anode. Certain organisms can grow conductive nanowires-- called pili-- that directly interact with anode to transfer the electrons.
[MUSIC PLAYING]
[BIRDS CHIRPING]
PRESENTER: OK. Today, we're out in the wild. And we're looking for some sludge to power our bio-battery. I think this a nice spot. Ah, it's perfect.
PRESENTER: Another application of bio-electrochemical systems is the production of chemicals. In this case power must be applied to biofilm by external source. Electrons are produced by the oxidation of water. Now the biofilm grows on the cathode . The energy-rich electrons are used by organisms to fixate carbon dioxide.
[MUSIC PLAYING]
Carbon dioxide enters the cathode compartment and fuses to the cathode. There, to harvest energy from the electrons, CO2 is fixed. And acetate is formed.
PRESENTER: All right. Let's have a look at our bio-battery. We buried the anode in our soil. Make sure there are no air bubbles in the soil. It has to be anaerobic. On top of the soil, we placed the cathode, which is in direct contact with the oxygen in the air.
Now let's look at another application of microbial fuel cell. Desalination can be achieved by inserting an extra compartment in between the anode and the cathode. A forward osmosis membrane is placed at the anode. This allows transport on both positively and negatively charged ions.
At the cathode, a cation exchange membrane is placed, which permits only transport of positively charged ions. Saltwater is flowing through this compartment while negatively charged ions move to the anode, and positively charged ions moved to the cathode.
To finalize our bio-battery and to see the energy production, we have to connect the cathodes to the anodes. the electricity is stored in a transformer and used to power an LED light.
[MUSIC PLAYING]
The next short video has Dr. Bruce Logan, a professor in the Civil Engineering Dept. at PSU providing a brief explanation on using these MFCs for wastewater treatment facilities.
Electrifying Wastewater (3:05)
Transcript: Electrifying Wastewater (3:05)
PRESENTER: Clean water and electricity are essential for everyday life. But to get one, we often need the other. We generate electricity to purify water. And in many parts of the world, we use water to create energy.
In the United States, an average of 5% of the electricity we produce goes towards powering our water infrastructure. But what if we could use wastewater for energy? As it turns out, a decades' old technology known as microbial fuel cells can help extract the energy and wastewater to produce electricity.
BRUCE LOGAN: A microbial fuel cell is a device where we use bacteria to directly produce electrical current from something as simple as wastewater. Right now, we have wastewater treatment plants that consume electrical power. And we can imagine a time when these treatment plants are transformed into what we hope would be power plants.
PRESENTER: Deep in the sewers in wastewater treatment plants, there are billions of bacteria, or microbes, that break down organic matter to produce electrons. They surrender their electrons to oxygen molecules in exchange for energy. But in a microbial fuel cell, the electrons take a detour.
BRUCE LOGAN: This is a microbial fuel cell. It's really a very simple device. It's just a tube with electrodes on either side of that tube-- one which is sealed off, so the bacteria can't get at the oxygen, the other one which is exposed to oxygen.
The most important part of a microbial fuel cell are the microbes. The microbes grow on an electrode, which is oxygen-free so that they send off those electrons to an electrode rather than oxygen. The electrons flow through a circuit, so we extract that electrical current as electrical power.
PRESENTER: To complete the circuit, the electrons end up on the other side of the tube and combine with oxygen. The theory is simple. But putting it into practice is not so easy.
BRUCE LOGAN: We initially thought that the greatest challenge would be the bacteria. But as it turns out, it's actually everything but the bacteria that we've had the greatest challenges with. We have systems the size of this cube and maybe a little bit bigger, but we really haven't gone out and built 1,000-liter systems or 10,000-liter systems. And that's an engineering challenge that we need to address next.
PRESENTER: Despite these challenges, Logan is optimistic about microbial fuel cells.
BRUCE LOGAN: I am really excited about microbial fuel cells and these different technologies because it creates a truly sustainable way to produce energy and power our water infrastructure.
PRESENTER: In other words, if microbial fuel cells deliver on their promise, wastewater will be waste no longer.
[MUSIC PLAYING]
The last video, put together by Dr. Logan’s group at PSU, shows how to construct three different types of MFCs.
Several Types of Microbial Fuel Cells (4:26)
Transcript: Several Types of Microbial Fuel Cells (4:26)
[MUSIC PLAYING]
PRESENTER: Here we have three different microbial fuel cell reactor architectures. In front, we have cube reactors. This is a single-bottle MFC reactor. And this is a double-bottle reactor, also known as an H-type reactor.
[MUSIC PLAYING]
Here we have a cube reactor disassembled. I just want to be able to show you all the parts before I put them back into the reactor itself.
This is the body of the reactor. It's a Lexan cube with a 28-milliliter volume anode chamber; two holes drilled in the top for refilling and emptying of the substrate.
This is the cathode end plate, and this is the cathode. This is actually an air cathode made out of carbon cloth.
This side has the four diffusion layers of PTFE. This side has carbon black and platinum catalyst. This is the side that actually faces the interior of the MFC.
This is the other end plate. There's many different nanomaterials that can be used. In this example, we are using a carbon brush fiber anode.
Now I will demonstrate assembly of a cube reactor.
First place the cathode in, the platinum-- carbon black side facing in. We use gaskets to make sure that there is no leakage and good connection between the platinum side and the current collector, which is a titanium wire.
The cube reactor is held together just with all thread and wing nuts using compression to keep all the places in-- all the pieces in place.
So the front's done. Apply a gasket, O-ring; the end plate gets slid on.
There you have it-- a cube reactor.
[MUSIC PLAYING]
So here we have a single-bottle reactor. This is very similar to the cube reactors. In this setup, we have a brush anode as well as another air cathode.
Now I'll demonstrate how to assemble a bottle reactor. So this is just a standard media bottle with an arm attached to it. Once again, replace the cathode with the platinum and carbon black side facing into the reactor and the PTF diffusion layer side facing towards the air.
So all we're doing is placing the cathode, current collector, O-ring-- this is just a cap that will be used for compression to keep the cathode in place-- using just a regular arm clamp. All that remains to be done is placing of the brush anode into the bottle.
And that is a single-bottle reactor.
[MUSIC PLAYING]
OK. Now I'll demonstrate the assembly of two two-bottle MFC reactor architecture, or an H-type reactor.
In this situation, the anode and cathode are both the same size, and we're using the same material for the anode and cathode, which is carbon paper.
And it's just been attached to a titanium wire as the current collector. And once again, this is being used as both the anode and the cathode.
In this situation, the cation exchange membrane is placed in between the two chambers.
Use a clamp. Tighten the clamp if necessary.
And you have a two-chamber microbial fuel cell reactor.
MFCs can also be used in food processing plants and breweries, as well as being implanted as biomedical devices. There are technical challenges to MFCs. They have relatively low power densities, which means they don’t generate much power. Therefore research continues to improve power densities. These devices have an incredible future but still need more research to be commercialized at a large scale.
11.4 Final Thoughts on the Use of Biomass for Fuel Generation
11.4 Final Thoughts on the Use of Biomass for Fuel GenerationWe have explored many uses of biomass to generate fuels, from use in electricity generation through combustion, to several conversion technologies to make ethanol, biodiesel, and fuels that are very similar to petroleum-based fuels like gasoline, jet fuel, and diesel fuel. I also wanted you to have the opportunity to see what is still being researched and what has been commercialized. While currently, due to the cost of crude oil being low, biofuels may not be as competitive economically, they show great benefit environmentally, especially when renewable methods are used to harvest and generate the fuels. You looked up several very interesting articles related to biofuel generation and use. Read articles on biofuels with a critical eye; you now know enough about biofuels so that you can be a more critical reader. I hope that you enjoyed the class.
11.5 Assignments Overview
11.5 Assignments OverviewFinal Project Reminder
Remember that your Final Project will be due at the specified time in Canvas.
Quiz#5
You will complete Quiz #5.
11.6 Summary and Final Tasks
11.6 Summary and Final TasksSummary
This last lesson covered practical topics, such as anaerobic digestion (it is part of digestion), and also topics that are more research-oriented, such as syngas fermentation and microbial fuel cells. The best application for anaerobic digestion is on farms, as a way to utilize waste from animals. Syngas fermentation could be a lower energy-intensive process that could make gasification/syngas fermentation less expensive than using FT synthesis. And, finally, microbial fuel cells are a unique fuel cell that can take advantage of bacteria to make electricity or clean up wastewater inexpensively.
Lesson Objectives
By the end of this lesson, you should be able to:
- explain what anaerobic digestion is;
- explain what syngas fermentation is;
- utilize the information on each to supplement biofuel liquids conversion technologies;
- evaluate the best methods to date for biofuel liquids conversion technologies.
References
Jian Shi1, Ruihong Zhang2, Wei Liao 3, Conly L. Hansen4, Yebo Li1, * 1. Department of Food, Agricultural, and Biological Engineering, The Ohio State University, 2. Department of Biological and Agricultural Engineering, University of California-Davis. 3. Department of Biosystems and Agricultural Engineering, Michigan State University, 4. Department of Nutrition and Food Sciences, Utah State University, BEEMS Module B7, Anaerobic Digestion, USDA Higher Education Challenger Program, 2009-38411-19761. Contact: Yebo Li, li.851@osu.edu
Frigon and Guiot, 2010, Biofuels, Bioproducts & Biorefining, 4, 447-458.
On-Farm Anaerobic Digester Operator Handbook. M.C. Gould and M.F. Crook. 2010. Modified by D.M. Kirk. January 2010.
Hasan K. Atiyeh, Department of Biosystems and Agricultural Engineering, Oklahoma State University, Syngas Fermentation, BEEMS Module N1, USDA Higher Education Challenger Program, 2009-38411-19761, Contact: Hasan K. Atiyeh, hasan.atiyeh@okstate.edu.
Wilkins and Atiyeh. Current Opinion in Biotechnology 2011, 22:326–330.
Reminder - Complete all of the Lesson 11 tasks!
You have reached the end of Lesson 11! Double-check the Road Map on the Lesson 12 Overview page to make sure you have completed all of the activities listed there.
Questions?
If there is anything in the lesson materials that you would like to comment on, or don't quite understand, please post your thoughts and/or questions to our Throughout the Course Questions & Comments discussion forum and/or set up an appointment during office hours. While you are there, feel free to post responses to your classmates if you can help.