EGEE 102: Energy Conservation for Environmental Protection
EGEE 102: Energy Conservation for Environmental ProtectionCourse Overview

Olumide Ogunmodimu, Ph.D.
Assistant Professor of
Energy and Mineral Engineering
Licensed under CC BY-NC-SA 4.0
Description: Energy is a vital component of modern society. Much of the general population believes that the energy sources we depend on are perpetual. While people believe that energy use is the culprit for environmental damage, they are not aware of the methods and principles by which energy conversion devices operate. This general education course will provide you with the necessary knowledge and information on the main operating principles of devices/appliances that are in common use, and information on how to make the right decision in selecting the most energy-efficient and economical choice. These devices are day-to-day appliances such as refrigerators, washers and dryers, ovens, etc., and home heating or cooling and transportation choices. The course also provides necessary information on heating furnaces, insulation, doors and windows, lighting, and air conditioning principles. The objective of the course is to expose you to energy efficiency in day-to-day life in order to save money and energy and thereby protect the environment. I hope the information in this course will help you become an environmentally responsible individual of this Global Village.
Course Objectives
Welcome to EGEE 102: Energy Conservation for Environmental Protection!
This course is designed to help you:
- gain a basic understanding and appreciation of energy efficiency and environmental concepts;
- learn basic operating principles of day-to-day energy conversion devices;
- discuss various options to increase energy efficiency;
- examine ways to save energy and money; and
- explore ways to save the environment.
Course Outline
- Lesson 1: Energy Fundamentals
- Define energy using the physics definition: the capacity to do work or produce heat
- State the Law of Conservation of Energy and explain its significance in scientific analysis
- Identify the six key forms of energy: mechanical, chemical, thermal, electrical, radiant, and nuclear
- Describe the difference between kinetic energy (energy of motion) and potential energy (stored energy)
- Distinguish between renewable and nonrenewable energy sources with at least two examples of each
- Lesson 2: Energy, Power and Utility Bills
- Distinguish work, energy, and power using everyday examples
- Convert between units (joules ↔ kilowatt-hours) to connect physics class to your utility bill
- Calculate energy use: Energy = Power × Time (e.g., a 100 W bulb running 10 hours = 1 kWh)
- Interpret appliance labels to estimate real-world costs
- Decode an actual electricity bill—spotting how many kWh you used and why your cost per kWh isn't just the "supply rate"
- Lesson 3: Energy Supply and Demand
- Analyze historical trends to understand how the Industrial Revolution transformed global energy use
- Compare energy consumption patterns across countries and connect them to GDP, geography, and lifestyle
- Investigate interactive data visualizations to see how fossil fuels still dominate—and how renewables are rising
- Evaluate three potential energy futures from the International Energy Agency and consider what "Net Zero" really means
- Calculate real-world applications like energy doubling time to grasp the scale of future demand
- Lesson 4: Energy Efficiency
- Define and calculate efficiency of an energy conversion device;
- Explain why energy conversion devices cannot achieve 100% efficiency
- Convert temperatures between Celsius and Kelvin;
- Explain operating principles of a heat engine; and
- Calculate overall efficiency from step efficiencies.
- Lesson 5: Environmental Impacts of Energy Production
- Identify the primary environmental impacts associated with major energy sources (fossil fuels, nuclear, hydropower, wind, solar, and biomass).
- Compare the trade-offs between energy technologies across multiple dimensions: greenhouse gas emissions, air pollution, water consumption, land use and change, and waste generation.
- Explain how combustion of fossil fuels releases pollutants that affect human health, ecosystems, and climate—and describe the chemical processes behind key emissions (CO₂, NOₓ, SO₂, PM).
- Analyze the water-energy nexus by evaluating withdrawal vs. consumption across different electricity generation methods and assessing regional implications.
- Evaluate the challenges and strategies for managing high-level nuclear waste, including storage technologies and policy considerations.
- Recognize examples of successful environmental policy—such as the Montreal Protocol and the U.S. Acid Rain Program—and explain how science, technology, and international cooperation enabled positive change.
- Lesson 6: Appliances
- Read EnergyGuide Labels: Learn to interpret the yellow labels on appliances that estimate annual energy use and operating costs.
- Compare Models: Evaluate multiple options to determine which offers the best value.
- Calculate Life Cycle Cost (LCC): Learn to look beyond the purchase price. We will show you how to calculate the total cost of ownership—including energy use over the appliance's lifetime.
- Determine Simple Payback: Is it worth paying $500 more upfront for a model that saves $50 a month? We'll teach you the math to find out how long it takes to recover that extra cost.
- Lesson 7: Hot Water
- Identify the 6 main types of water heaters
- Calculate the energy consumption required to heat water
- Compare upfront cost vs. annual energy use of different types of hot water heaters
- Evaluate the life cycle cost of different types of hot water heaters
- Lesson 8: Lighting
- Explain how different lamp types (incandescent, halogen, fluorescent, HID, LED) produce light
- Compare lighting efficiency using lumens, watts, and lumens-per-watt
- Identify lighting controls that reduce waste without sacrificing comfort
- Perform a life-cycle cost analysis to compare total ownership costs
- Lesson 9: Heating
- Define the three mechanisms of heat transfer: conduction, convection, and radiation
- Explain what Heating Degree Days (HDD) are and why the base temperature is 65°F
- Describe how insulation works and what R-Value measures
- Identify common home heating fuels (natural gas, oil, propane, electricity) and their typical uses by region
- Calculate daily, monthly, and seasonal Heating Degree Days using average temperature data
- Compare insulation materials using R-Value and explain how layered construction improves thermal resistance
- Calculate simple payback periods for energy upgrades to determine if an investment is financially worthwhile
- Lesson 10: Home Cooling and Windows
- Explain the relationship between humidity and temperature;
- Describe how an air conditioner works;
- Describe different types of air conditioning systems;
- Calculate the monetary savings when the efficiency of an air conditioner is improved.
- Lesson 11: Transportation
- Identify the major types of transportation, including light-duty vehicles, trucks, rail, water transportation, and aircraft.
- Explain how internal combustion engines convert fuel into motion through the four-stroke cycle.
- Compare gasoline, diesel, hybrid, plug-in hybrid, and electric vehicles based on how they operate and the fuels they use.
- Describe several alternative and advanced transportation fuels, including biodiesel, ethanol, natural gas, hydrogen, and propane.
- Explain the purpose of vehicle efficiency standards such as CAFE standards.
- Calculate or compare vehicle cost to drive using fuel price and fuel efficiency information.
- Lesson 12: Home Energy Audit - The Building Envelope
- Explain how residential energy use connects to climate change, household budgets, and indoor comfort
- Identify the three primary pathways of energy loss in buildings (air leakage, insufficient insulation, inefficient equipment)
- Conduct a no-cost DIY energy audit of their current living space using household items
- Analyze a utility bill (real or sample) to establish energy consumption baselines
- Prioritize energy improvements using a simple cost-benefit framework
Materials
All the instructional material for EGEE 102 is presented online. As described above, EGEE 102 consists of 12 online lessons. These lessons include text, graphics, videos, animations, interactive activities, numerical problems, and electronic whiteboard discussions of numerical problems. Quizzes have been developed to test your understanding of the material covered in the 12 lessons.
This course is offered as part of the Repository of Open and Affordable Materials at Penn State. You are welcome to use and reuse materials that appear on this site (other than those copyrighted by others) subject to the licensing agreement linked to the bottom of this and every page.
Want to join us? Students who register for this Penn State course gain access to assignments and instructor feedback and earn academic credit. Official course descriptions and curricular details can be reviewed in the University Bulletin.
Lesson 1: Energy Fundamentals
Lesson 1: Energy FundamentalsThe links below provide an outline of the material for this lesson. Be sure to carefully read through the entire lesson before returning to Canvas to submit your assignments.
1.1 Lesson 1 Introduction
1.1 Lesson 1 IntroductionWelcome to Lesson 1
In this first module of our course, we begin with a question that seems simple but unlocks the workings of our entire universe: What is energy?
In physics, energy is defined as the capacity to do work or produce heat. You can’t hold energy in your hand like a rock—but you see its effects everywhere. It’s what lets your heartbeat, your phone light up, a wind turbine spin, and the sunshine. Energy isn’t a “thing” itself, it’s a property of systems that enables change, motion, and transformation.
Energy comes in many forms, and one of its most fascinating features is that it can change from one type to another, but it’s never created or destroyed. This is the Law of Conservation of Energy, a cornerstone of science.
We’ll explore six key forms of energy that shape our daily lives:
- Mechanical energy -the sum of kinetic energy (motion) and potential energy stored due to position or condition, like a roller coaster at the top of a hill or a spinning bicycle wheel.
- Chemical energy, stored in the bonds of molecules, found in food, gasoline, and batteries, and released when those bonds break.
- Thermal (heat) energy, the total microscopic kinetic and potential energy of vibrating atoms and molecules—felt in a warm cup of tea or the friction of brakes on a bike.
- Electrical energy, carried by moving electrons through wires powers everything from LED lights to electric cars.
- Radiant (or electromagnetic) energy, which travels as waves, from visible light and radio signals to X-rays and infrared heat.
- Nuclear energy released when atomic nuclei split (fission) or fuse (fusion), powering stars like our Sun and nuclear reactors on Earth.
But understanding energy isn’t just about naming its forms it’s about seeing how it flows and transforms. For example:
- Your body converts chemical energy from food into mechanical energy (to walk or type), thermal energy (to stay warm), and even electrical signals in your nerves.
- A car engine turns the chemical energy in gasoline into thermal energy through combustion, then into mechanical energy to move the wheels—though much is lost as waste heat.
- Solar panels capture radiant energy from the Sun and convert it directly into electrical energy to power homes.
Finally, we’ll examine where our energy comes from. Most of the world still relies on nonrenewable sources like coal, oil, and natural gas, fossil fuels formed over millions of years. But cleaner, sustainable renewable sources—such as sunlight, wind, water, and geothermal heat—are rapidly growing and offer a path toward a healthier planet.
By the end of this module, you’ll not only understand what energy is, you’ll be able to trace its journey through your morning routine, your city’s power grid, and even the core of the Sun. You’ll see energy not as an abstract concept, but as the invisible thread connecting physics, technology, biology, and environmental stewardship.
So let’s dive in—and start seeing the world through the lens of energy!
Lesson 1: Learning Objectives
Upon completing this lesson, you should be able to:
- Define energy using the physics definition: the capacity to do work or produce heat
- State the Law of Conservation of Energy and explain its significance in scientific analysis
- Identify the six key forms of energy: mechanical, chemical, thermal, electrical, radiant, and nuclear
- Describe the difference between kinetic energy (energy of motion) and potential energy (stored energy)
- Distinguish between renewable and nonrenewable energy sources with at least two examples of each
1.2 Introduction to Forms of Energy
1.2 Introduction to Forms of EnergyEnergy is the ability to do work or cause change. It’s what makes things happen—whether it’s a car moving, a phone lighting up, your heart beating, or the sun warming your skin.
Importantly, energy cannot be created or destroyed—only transformed from one form to another (this is the Law of Conservation of Energy). That means the energy in your morning coffee, your electric scooter, or even a lightning bolt all started somewhere else and changed forms along the way.
Scientists recognize many types of energy, but they all fall into a few fundamental categories. The U.S. Energy Information Administration (EIA) identifies six primary forms of energy that we use every day:
- Mechanical Energy
- Chemical Energy
- Thermal (Heat) Energy
- Electrical Energy
- Radiant (Light) Energy
- Nuclear Energy
Additionally, each energy source can be categorized as Kinetic Energy or Potential Energy. Kinetic Energy is the energy of motion. Potential Energy is stored energy, to be used later. We will discuss each of these forms of energy in the next sections.
1.3 Forms of Energy: Mechanical
1.3 Forms of Energy: MechanicalUnderstanding Mechanical Energy: The Energy of Motion and Position
Energy is the ability to do work—whether that means moving an object, heating a room, or powering a phone. In our everyday lives, we constantly use energy in many forms: electrical, chemical, thermal, nuclear, radiant, and mechanical. Over the next few pages, we are going to investigate these different energy forms. Among these, mechanical energy is especially intuitive because it involves things we can see and feel—like cars moving, balls flying, or roller coasters zooming down hills.
Mechanical energy comes in two main types: kinetic energy (energy of motion) and potential energy (stored energy due to position or condition). Together, they help us understand how objects move and interact in the physical world.
Kinetic Energy: Energy in Motion
Kinetic energy is the energy an object has because it’s moving. The faster something moves—or the more massive it is—the more kinetic energy it carries.
Real-World Examples:
- A baseball pitcher throwing a fastball: The ball gains kinetic energy as it leaves the pitcher’s hand. That energy is what allows it to travel toward home plate at high speed.
- A freight train hauling cargo across the country: Even though it may seem slow, its huge mass gives it enormous kinetic energy—so much that it takes miles to stop safely!
- Wind turbines spinning in a field: The moving air (wind) has kinetic energy, which turns the turbine blades and generates electricity.
- You riding a bicycle downhill: As you pick up speed, your kinetic energy increases—you can feel it in the rush of wind and the momentum carrying you forward.
In the United States, about one-third of all energy consumption goes toward transportation—cars, trucks, planes, and ships—all of which rely on converting other forms of energy (like chemical energy in gasoline) into mechanical kinetic energy to move people and goods.
Potential Energy: Stored Energy Ready to Be Used
Potential energy is stored energy based on an object’s position, shape, or state. In mechanics, we often talk about gravitational potential energy (due to height) and elastic potential energy (due to stretching or compressing).
Gravitational Potential Energy Examples:
- A book on a high shelf: It doesn’t seem to be doing anything—but if it falls, gravity pulls it down, turning that stored energy into motion. The higher the shelf, the more potential energy the book has.
- Hydropower dams: Water held behind a dam has gravitational potential energy. When released, it flows downward, spinning turbines to generate electricity—converting potential energy into kinetic, then into electrical energy.
- A roller coaster at the top of a hill: At the peak, it’s momentarily still but packed with potential energy. As it plunges down, that energy transforms into thrilling speed (kinetic energy)
Elastic Potential Energy Examples:
- A drawn bow in archery: Pulling back the string stores energy in the bent limbs of the bow. When released, that energy propels the arrow forward.
- A compressed spring in a toy car: Wind it up, and you store elastic potential energy. Let go, and the spring uncoils, making the car zoom across the floor.
- Trampolines: When you land on one, the mat stretches downward, storing energy. That energy is then returned to you as you bounce back up!
The Earth-Book System: Why Context Matters
It’s important to remember that potential energy isn’t just “in” the object—it belongs to the system. Take the book on the shelf again: by itself, the book doesn’t “have” gravitational potential energy. It’s the combination of the book and the Earth’s gravitational field that creates this stored energy. If there were no gravity (like in deep space), the book wouldn’t gain speed when “dropped”—because there’d be nothing pulling it down.
So, when the book falls:
- The Earth-book system loses gravitational potential energy.
- That energy is converted into kinetic energy as the book accelerates downward.
- Just before it hits the floor, almost all the original potential energy has become kinetic energy.
This idea—that energy can change forms but isn’t created or destroyed—is part of the Law of Conservation of Energy, a fundamental principle in physics.
Bringing It All Together: Mechanical Energy in Action
Many real-world systems rely on the continuous conversion between potential and kinetic energy:
- Pendulum clocks: At the highest point of its swing, the pendulum has maximum potential energy and zero kinetic energy. At the bottom of the swing, it’s moving fastest—maximum kinetic energy, minimum potential energy. This back-and-forth exchange keeps the clock ticking.
- Skateboarders in a half-pipe: They start by dropping from the top (high potential energy), speed up at the bottom (high kinetic energy), then rise up the other side, slowing down as kinetic energy turns back into potential energy.
- Bungee jumping: The jumper starts with gravitational potential energy at the platform. As they fall, it becomes kinetic energy—until the bungee cord stretches, converting that kinetic energy into elastic potential energy, which then pulls them back up.
By understanding mechanical energy—how it’s stored, how it moves, and how it transforms—we gain insight into everything from simple toys to complex engineering systems. And the best part? You’re already using these principles every time you throw a ball, ride a bike, or even walk downstairs!
1.4 Forms of Energy: Chemical Energy
1.4 Forms of Energy: Chemical EnergyChemical Energy: The Hidden Power in Molecules
Chemical energy is a form of potential energy stored in the bonds that hold atoms together inside molecules. Think of it like a coiled spring at the atomic level: even though nothing appears to be happening, a huge amount of energy is “locked away” until a chemical reaction unlocks it.
This energy exists because of the electromagnetic forces between electrons and nuclei in atoms. When atoms bond to form molecules (like glucose, gasoline, or methane), they settle into a stable arrangement that has a specific amount of stored energy. If those bonds are broken or rearranged during a chemical reaction—like burning, digesting, or discharging a battery—that stored energy can be released, often as heat, light, or mechanical work.
How Chemical Energy Becomes Useful Energy
Chemical energy rarely stays as chemical energy for long—it usually transforms into other forms we can use:
- Thermal energy (heat) – e.g., from burning wood
- Electrical energy – e.g., from a battery powering your phone
- Mechanical energy – e.g., your muscles contracting to lift a backpack
- Light energy – e.g., a glow stick or firefly
This transformation is what makes chemical energy so essential in both nature and technology.
Everyday Examples of Chemical Energy
- Batteries (Portable Power)
A AA battery doesn’t look like it’s doing much—but inside, a chemical reaction between zinc and manganese dioxide releases electrons. These electrons flow through a circuit, creating electrical energy that powers your remote, flashlight, or wireless mouse. Rechargeable batteries (like in phones or electric cars) reverse this process when plugged in, storing electrical energy back as chemical energy. Food = Fuel for Your Body
The glucose (a simple sugar) in your bloodstream is your body’s primary energy source. When you eat a banana or a slice of bread, your digestive system breaks it down into glucose. Inside your cells, glucose reacts with oxygen in a process called cellular respiration:This reaction releases chemical energy, which your muscles convert into mechanical energy (to walk, jump, or type) and thermal energy (to keep you warm). Without this stored chemical energy, you couldn’t move or even breathe!
- Burning Wood or Gasoline (Combustion)
When you light a campfire, the cellulose and other compounds in wood react with oxygen. The chemical bonds break and reform into new molecules (like CO₂ and H₂O), releasing heat and light. The same thing happens in your car engine: gasoline combusts, producing hot, expanding gases that push pistons—converting chemical energy → thermal energy → mechanical energy to turn the wheels. - Fossil Fuels: America’s Primary Energy Source
As of 2020, about 80% of U.S. energy came from fossil fuels—coal, oil, and natural gas. These fuels formed over millions of years from buried plants and microorganisms. Their molecules (like octane in gasoline or methane in natural gas) are packed with chemical energy.- In a power plant, coal is burned to heat water into steam, which spins turbines (chemical → thermal → mechanical → electrical).
- In a gas stove, natural gas (mostly methane) burns to produce a flame for cooking (chemical → thermal + light).
- In a jet engine, kerosene-based fuel combusts to create thrust (chemical → thermal → kinetic/mechanical).
- Photosynthesis: Nature’s Energy Storage
Plants do the opposite of combustion! They absorb sunlight and use it to build glucose from carbon dioxide and water. In this process, radiant (solar) energy is converted into chemical energy and stored in sugar molecules. This stored energy then moves through the food chain—when you eat a salad, you’re literally consuming sunlight that was captured and stored by plants! - Hand Warmers and Cold Packs
- Disposable hand warmers contain iron powder that slowly oxidizes (rusts) when exposed to air a chemical reaction that releases heat.
- Instant cold packs mix ammonium nitrate and water in a sealed bag. The dissolving process absorbs heat from the surroundings, making the pack feel cold. Both rely on changes in chemical potential energy!
Why Is Chemical Energy Considered “Potential”?
Just like a book on a shelf has gravitational potential energy because of its position, a molecule has chemical potential energy because of how its atoms are arranged. Until a reaction occurs, that energy stays hidden. But once the right conditions are met (like adding a spark, mixing chemicals, or activating an enzyme in your body), the energy is released—and often does useful work.
Importantly, the total energy is conserved. The “lost” chemical energy doesn’t vanish, it becomes heat, motion, light, or other forms. That’s why your laptop gets warm when charging (some energy becomes heat) or why you sweat during exercise (your body releases excess thermal energy from breaking down food).
Connecting Back to Mechanical Energy
One of the most important conversions in daily life is:
Chemical energy → Mechanical energy
- Your muscles convert glucose into motion.
- A car engine converts gasoline into wheel rotation.
- A rocket converts liquid hydrogen and oxygen into upward thrust.
In each case, stored molecular energy becomes macroscopic movement—linking the invisible world of atoms to the visible world of motion we experience every day.
Final Thought
From the food on your plate to the gas in your car, chemical energy is the silent powerhouse behind modern life. Understanding it helps us appreciate not just how things work—but also why energy choices (like switching from fossil fuels to biofuels or batteries) matter for our health, economy, and planet.
And remember: every time you take a step, send a text, or boil water for pasta—you’re tapping into the incredible power stored in chemical bonds!
1.5 Forms of Energy: Thermal Energy
1.5 Forms of Energy: Thermal EnergyThermal (Heat) Energy: The Energy of Jiggling Molecule
Thermal energy—often called heat energy is the total internal energy contained within a substance due to the random motion and interactions of its atoms and molecules. It includes both:
- Microscopic kinetic energy: the energy of molecules moving, rotating, and vibrating.
- Microscopic potential energy: the energy stored in the forces between molecules (like tiny springs pulling or pushing on each other).
Unlike temperature, which tells us how hot or cold something feels, thermal energy depends on three things:
- Temperature (how fast the molecules are jiggling),
- Mass (how much stuff is there), and
- Material (how tightly the molecules are bound, which affects how much energy they can store).
What Does “Hot” Really Mean?
When you say your coffee is “hot,” you’re really saying its molecules are moving and vibrating rapidly. In solids (like a metal spoon), atoms vibrate in place. In liquids (like soup), molecules slide past each other but still jiggle. In gases (like steam), molecules zip around freely at high speed.
The higher the temperature, the more intense this motion becomes—and the more microscopic kinetic energy the system has. At the same time, as molecules move farther apart (like when ice melts into water), their potential energy increases because they’re overcoming attractive forces—just like lifting a book off a shelf increases gravitational potential energy.
Thermal energy is a mix of tiny-scale kinetic and potential energy, all happening trillions of times per second!
Real-World Examples of Thermal Energy
- A Hot Cup of Coffee
Your morning coffee feels warm because its fast-moving water molecules collide with your skin, transferring energy. That warmth is thermal energy flowing from the coffee (high temperature) to your hand (lower temperature), a process called heat transfer. - Boiling Water on a Stove
As you heat water, its molecules gain kinetic energy and move faster. At 100°C (212°F) at sea level, they have enough energy to break free from liquid bonds and become steam (gas). The bubbling you see is thermal energy causing a phase change—from liquid to gas. - Car Engines and Power Plants
Most cars burn gasoline (chemical energy), which releases thermal energy through combustion. This heat causes gases to expand rapidly, pushing pistons → creating mechanical energy to turn the wheels.
Similarly, coal or natural gas power plants burn fuel to heat water into steam, which spins turbines to generate electricity. In both cases: Chemical → Thermal → Mechanical → Electrical - Your Body Produces Thermal Energy
When you exercise, your muscles convert chemical energy (from food) into mechanical work, but not all of it! About 60–70% is “lost” as thermal energy, which is why you sweat. Your body uses this heat to maintain a stable internal temperature (~37°C or 98.6°F).
Why Thermal Energy Matters
- Energy conversions: Most human-made energy systems (cars, power plants, rockets) rely on converting other forms of energy into thermal energy first, then into useful work.
- Efficiency limits: Not all thermal energy can be turned into work, some always “escapes” as waste heat (this is governed by the Second Law of Thermodynamics). We will discuss this more in Lesson 2!
- Climate and environment: Burning fossil fuels releases huge amounts of thermal energy into the atmosphere, contributing to global warming. Understanding thermal energy helps us design better insulation, engines, and renewable technologies.
Final Thought
Thermal energy is everywhere—in your breath on a cold day, in the warmth of sunlight, in the hum of your laptop. It’s the invisible dance of trillions of molecules, constantly moving, colliding, and storing energy. And while we can’t see it directly, we feel it, use it, and depend on it every single day.
So next time you sip hot chocolate or feel the sun on your skin, remember you’re experiencing the collective motion of countless tiny particles—doing their energetic, chaotic, essential dance!
1.6 Forms of Energy: Electrical Energy
1.6 Forms of Energy: Electrical EnergyElectrical Energy – The Power of Moving Electrons
What Is Electrical Energy?
Electrical energy is the energy carried by the flow of electric charge, usually in the form of moving electrons through a conductor (like a copper wire). It’s not electricity itself that is energy, but rather, the movement of charged particles transfers energy from one place to another.
Think of it like water flowing through a pipe:
- The water is like the electrons.
- The flow (current) carries energy.
- The pump or height difference that pushes the water is like the voltage (electrical “pressure”).
This energy can be easily converted into other useful forms: heat, light, sound, or motion making electricity one of the most versatile and controllable forms of energy we use.
The Atomic Basis of Electricity
All matter is made of atoms, and atoms contain three key subatomic particles:
•Protons (positive charge) — in the nucleus (center)
•Neutrons (no charge) — also in the nucleus
•Electrons (negative charge) — orbit the nucleus in "shells"
In most materials, electrons are tightly bound to their atoms. But in conductors—especially metals like copper, aluminum, or silver—some electrons in the outer shells are loosely held. These are called free electrons.
When a voltage (electrical potential difference) is applied—say, by connecting a battery to a wire—it creates an electric field that pushes these free electrons to drift in one direction. This organized flow of electrons is called an electric current, and it carries electrical energy through the circuit.
How Electrical Energy Powers Our World: Real-World Conversions
One of the greatest strengths of electrical energy is how easily it transforms into other forms. Here’s how it works in everyday devices:
- → Thermal Energy (Heat)
- Toaster: Electric current flows through a thin wire (heating element) with high resistance. Electrons collide with atoms, making them vibrate faster → heat!
- Electric stove, space heater, hair dryer: All use the same principle—resistive heating—to turn electricity into warmth.
- → Light Energy
- Incandescent bulb: Electricity heats a tungsten filament until it glows (also produces a lot of waste heat).
- LED bulb: Electrons move through a semiconductor material, releasing energy directly as light—much more efficient!
- Phone screen, traffic lights, holiday lights: All rely on controlled electrical-to-light conversion.
- → Sound Energy
- Stereo speakers: An electric signal causes a coil of wire to move back and forth inside a magnet. This vibrates a cone, creating sound waves.
- Doorbells, alarms, headphones: All convert electrical signals into audible vibrations.
- → Mechanical Energy (Motion)
- Electric fan, blender, washing machine: Contain an electric motor. Inside, electricity creates magnetic fields that push against each other, causing a shaft to spin → mechanical energy.
- Electric cars: Use powerful motors to turn electrical energy from batteries into wheel rotation—quiet, efficient, and zero emissions at the tailpipe!
- → Chemical Energy (Storage)
- Charging your phone: Electrical energy from the wall outlet drives a chemical reaction inside the lithium-ion battery, storing energy as chemical potential energy for later use.
- Electrolysis: Electricity can split water (H2O) into hydrogen and oxygen—storing energy in chemical bonds for future fuel.
Why Is Electrical Energy So Useful?
- Easy to transport: Wires can carry it miles with minimal loss.
- Instant control: Flip a switch: on or off in milliseconds.
- Highly convertible: Turns efficiently into light, heat, motion, etc.
- Clean at point of use: No smoke, noise, or fumes (even if the power plant isn’t clean).
That’s why everything from MRI machines to video game consoles relies on it!
Final Thought: You’re Part of the Circuit!
Your nervous system uses bioelectricity, tiny electrical signals created by the movement of ions (charged atoms) across nerve cells, to send messages from your brain to your toes. In a very real sense, you run on electrical energy too!
Next time you turn on a lamp, charge your phone, or ride an elevator, remember you’re harnessing the power of trillions of electrons on the move all working together to make modern life possible.
1.7 Forms of Energy: Radiation
1.7 Forms of Energy: RadiationWhat Is Radiation?
Radiation simply means energy that travels through space or matter in the form of waves or particles. Despite the word sometimes sounding alarming, most radiation is completely harmless—and essential to life!
There are two main types of radiation we encounter:
- Electromagnetic radiation (energy waves like light, radio, X-rays)
- Nuclear (or particle) radiation (tiny particles emitted from unstable atoms)
In this module, we’ll focus mostly on electromagnetic radiation—the kind that powers everything from sunlight to Wi-Fi—and briefly touch on everyday sources of low-level nuclear radiation.
⚡ Electromagnetic Radiation: Energy on the Move
Electromagnetic (EM) radiation is energy that travels as oscillating electric and magnetic fields moving together through space at the speed of light (about 300,000 km/s!). It doesn’t need air or water to travel—which is why sunlight reaches us across the vacuum of space.
This energy comes in tiny “packets” called photons. Photons have no mass, but they carry energy—and the more energy a photon has, the shorter its wavelength.
The Electromagnetic Spectrum: One Family, Many Forms
All electromagnetic radiation—from radio waves to gamma rays—is fundamentally the same phenomenon, just with different wavelengths and energies. Scientists organize these into the electromagnetic spectrum:

Text description of the figure 1.1.
The image illustrates the electromagnetic spectrum, comparing different types of radiation from radio waves to gamma rays. It is organized into several sections, each providing different details about the characteristics of these waves. At the top, a wavy red line represents the increasing frequency from left (radio waves) to right (gamma rays). Immediately below, a row of rectangles indicates whether each radiation type penetrates Earth's atmosphere, with "Y" for yes and "N" for no.
The wave types are listed with their corresponding wavelengths in meters: Radio (10³), Microwave (10⁻²), Infrared (10⁻⁵), Visible (0.5×10⁻⁶), Ultraviolet (10⁻⁸), X-ray (10⁻¹⁰), Gamma ray (10⁻¹²). Each type is accompanied by an image for approximate scale: Buildings for radio, humans for microwave, butterflies for infrared, needle points for visible, protozoans for ultraviolet, molecules for X-ray, atoms for gamma ray, and atomic nuclei for the smallest scales.
Below, the frequency range in Hertz (Hz) is shown, mapping the spectrum from 10⁴ for radio waves to 10²⁰ for gamma rays. A colored horizontal bar displays the visible spectrum from red at the left to violet at the right.
The lowest section describes the temperature of objects emitting the most intense wavelength, depicted with a gradient bar ranging from 1 Kelvin (-272°C) to 10,000,000 Kelvin (~10,000,000°C).
Real-World Examples of Electromagnetic Radiation
- Sunlight: A mix of visible light, UV, and infrared—powers photosynthesis, warms Earth, and gives you a tan (or sunburn!).
- Wi-Fi & Bluetooth: Use microwaves to send data between your phone and router.
- Remote controls: Send infrared signals to your TV.
- Night-vision goggles: Detect infrared radiation (heat) emitted by people and animals.
- Medical X-rays: Pass through soft tissue but are absorbed by bones—creating diagnostic images.
- Solar panels: Capture photons from sunlight and convert them directly into electricity.
Please watch the following 5:04 video about the electromagnetic spectrum:
Video: Tour of the Electro Magnetic Spectrum (5:03)
Transcript: Tour of the Electro Magnetic Spectrum
Introduction to EM Spectrum
Narrator: Something surrounds you. Bombards you some of which you can't see, touch, or even feel. Everyday. Everywhere you go. It is odorless and tasteless. Yet you use it and depend on it every hour of every day. Without it, the world you know could not exist. What is it? Electromagnetic radiation.
These waves spread across a spectrum from very short gamma rays, to x-rays, ultraviolet rays, visible light waves, even longer infrared waves, microwaves, to radio waves which can measure longer than a mountain range. This spectrum is the foundation of the information age and of our modern world.
Your radio, remote control, text message, television, microwave oven, even a doctor's x-ray, all depend on waves within the electromagnetic spectrum.
Properties of EM Waves
Electromagnetic waves (or EM waves) are similar to ocean waves in that both are energy waves - they transmit energy. EM waves are produced by the vibration of charged particles and have electrical and magnetic properties. But unlike ocean waves that require water, EM waves travel through the vacuum of space at the constant speed of light.
EM waves have crests and troughs like ocean waves. The distance between crests is the wavelength. While some EM wavelengths are very long and are measured in meters, many are tiny and are measured in billionths of a meter...nanometers. The number of these crests that pass a given point within one second is described as the frequency of the wave. One wave - or cycle - per second, is called a Hertz.
Long EM waves, such as radio waves, have the lowest frequency and carry less energy. Adding energy increases the frequency of the wave and makes the wavelength shorter. Gamma rays are the shortest, highest energy waves in the spectrum.
Visible Light and Human Eyes
So, as you sit watching TV, not only are there visible light waves from the TV striking your eyes...But also radio waves transmitting from a nearby station; and microwaves carrying cell phone calls and text messages; and waves from your neighbor's WiFi; and GPS units in the cars driving by. There is a chaos of waves from all across the spectrum passing through your room right now!
With all these waves around you, how can you possibly watch your TV show? Similar to tuning a radio to a specific radio station, our eyes are tuned to a specific region of the EM spectrum and can detect energy with wavelengths from 400 to 700 nanometers, the visible light region of the spectrum.
Objects appear to have color because EM waves interact with their molecules. Some wavelengths in the visible spectrum are reflected and other wavelengths are absorbed. This leaf looks green because EM waves interact with the chlorophyll molecules. Waves between 492 and 577 nanometers in length are reflected and our eye interprets this as the leaf being green.
Our eyes see the leaf as green but cannot tell us anything about how the leaf reflects ultraviolet, microwave, or infrared waves.
Scientific Applications
To learn more about the world around us, scientists and engineers have devised ways to enable us to 'see' beyond that sliver of the EM spectrum called visible light. Data from multiple wavelengths help scientists study all kinds of amazing phenomena on Earth, from seasonal change to specific habitats.
Everything around us emits, reflects and absorbs EM radiation differently based on its composition. A graph showing these interactions across a region of the EM spectrum is called a spectral signature. Characteristic patterns, like fingerprints within the spectra allow astronomers to identify an object's chemical composition and to determine such physical properties as temperature and density.
NASA's Spitzer space telescope observed the presence of water and organic molecules in a galaxy 3.2 billion light years away.
Viewing our Sun in multiple wavelengths with the SOHO satellite allows scientists to study and understand sunspots that are associated with solar flares and eruptions harmful to satellites, astronauts and communications here on Earth.
We are constantly learning more about our world and Universe by taking advantage of the unique information contained in the different waves across the EM spectrum.
1.8 Forms of Energy: Nuclear
1.8 Forms of Energy: NuclearWhat Is Nuclear Energy?
Nuclear energy is the enormous amount of energy stored in the nucleus (core) of an atom. Unlike chemical energy—which involves electrons orbiting the nucleus—nuclear energy comes from forces inside the nucleus itself. When the structure of a nucleus changes, a tiny bit of its mass can be converted directly into vast amounts of energy, as described by Einstein’s famous equation:
Because the speed of light (c) is so huge (about 300,000,000 meters per second), c2 is unimaginably large—meaning even a tiny amount of mass converts into a tremendous amount of energy.
There are two main ways to release nuclear energy: fission and fusion.
Two Paths to Nuclear Energy: Fission vs. Fusion
E = mc² in Action: Why So Much Energy?
Let’s put Einstein’s equation into perspective:
- If you could convert 1 gram of matter (about the mass of a paperclip) completely into energy, it would release:
- 90 trillion joules—enough to power the average U.S. home for over 2,000 years!
In reality, nuclear reactions convert only about 0.1% to 0.7% of mass into energy—but that’s still millions of times more than burning the same mass of coal or oil.
Comparison:
- Burning 1 kg of coal → ~30 million joules
- Fission of 1 kg of uranium → ~80 billion joules
- Fusion of 1 kg of hydrogen → ~300 billion joules
That’s the power of the nucleus!
Natural & Everyday Nuclear Energy
Nuclear processes aren’t just in reactors or stars—they’re part of our planet too:
- Earth’s interior heat: Partly comes from natural radioactive decay of uranium, thorium, and potassium in rocks—this drives plate tectonics and volcanoes.
- Geothermal energy: Harnesses this internal heat for clean electricity and heating.
- Carbon-14 dating: Uses natural radioactive decay to determine the age of ancient artifacts.
Final Thought: A Tiny Nucleus, Infinite Potential
Nuclear energy reminds us that the smallest things can have the biggest impact. From the sunlight that sustains life to the reactors that power cities, the energy locked inside atomic nuclei shapes our world.
While fission gives us clean electricity today, fusion offers hope for a nearly limitless, safe, and clean energy future. Understanding both helps us make informed choices about energy, climate, and innovation.
1.9 Identifying Forms of Energy
1.9 Identifying Forms of EnergyBelow is a comprehensive visual representation of the six fundamental forms of energy we have explored in the previous sections. This infographic organizes energy into its primary categories—Mechanical, Thermal, Electrical, Electromagnetic, Chemical, and Nuclear each illustrated with examples that demonstrate how energy forms appear in our daily lives and in nature. Note that in this particular visualization, Electromagnetic energy is presented as a single category that encompasses both visible light (radiant energy) and radio waves, highlighting how these phenomena are fundamentally the same type of energy differing only in wavelength and frequency.

Text description of the Types of Energy image.
The image is an educational infographic titled "Types of Energy." It features a central blue circle labeled "Forms of Energy" connected by arrows to smaller blue circles, each labeled with different forms of energy: Mechanical, Thermal, Electrical, Electromagnetic, Chemical, and Nuclear. Each form of energy is illustrated with an icon. Mechanical energy is shown with a hammer and nail, and a moving car. Thermal energy is depicted with melting ice and heating food in an oven. Electrical energy is exemplified by lightning and power lines. Electromagnetic energy is represented by visible light and radio waves. Chemical energy is illustrated with a battery and food people eat. Nuclear energy is shown with nuclear fusion and fission illustrations.
1.10 Energy Conversion
1.10 Energy ConversionWhat Is Energy Conversion?
Energy conversion (or energy transformation) is the process of changing energy from one form into another. This happens constantly—in nature, in technology, and even inside your own body!
Key Principle: Energy cannot be created or destroyed—only converted from one form to another.
This is the Law of Conservation of Energy, one of the most fundamental ideas in all of science.
That means the total amount of energy stays the same—it just changes “clothes” as it moves through a system.
Why Do We Care About Energy Conversion?
Almost every device or natural process we rely on works by converting energy into a more useful form. But no conversion is 100% efficient—some energy always “escapes” as waste heat (usually thermal energy). Understanding these conversions helps us be more energy efficient.
Real-World Examples of Energy Conversion
Let’s explore how energy transforms in everyday situations:
- Car Engine: Chemical → Thermal → Mechanical (+ Waste Heat)
- Gasoline contains chemical energy stored in its molecular bonds.
- When ignited in the engine, it burns (combustion), releasing thermal energy (heat).
- The hot, expanding gases push pistons → creating mechanical (kinetic) energy to turn the wheels.
- But… About 60–70% of the energy is lost as waste heat through the exhaust and radiator!
- Television: Electrical → Light + Sound + Heat
- When you plug in your TV, electrical energy flows into it.
- This powers:
- Light energy (pixels on the screen),
- Sound energy (speakers vibrating air),
- And thermal energy (your TV gets warm after hours of use—waste heat!).
- Even “off” TVs in standby mode use a tiny bit of electricity—called vampire energy!
- Incandescent Light Bulb: Electrical → Light + Heat
- Only about 10% of the electrical energy becomes visible light.
- The other 90% is “wasted” as heat—which is why these bulbs are being phased out.
- LED bulbs are far better: they convert ~90% of electricity into light, with minimal heat!
- Human Body: Chemical → Mechanical + Thermal
- The glucose in your food stores chemical energy.
- During cellular respiration, your cells convert it into:
- Mechanical energy (to move muscles, blink, type, walk),
- Thermal energy (to keep your body at 98.6°F / 37°C),
- And even electrical energy (nerve signals in your brain!).
- Efficiency? Only about 20–25% goes to useful work—the rest is heat (which is why you sweat when exercising!).
- Hydroelectric Dam: Gravitational Potential → Kinetic → Mechanical → Electrical
- Water held high behind a dam has gravitational potential energy.
- When released, it falls → gaining kinetic energy.
- Flowing water spins a turbine (mechanical energy).
- The turbine turns a generator, producing electrical energy.
- This clean, renewable process powers millions of homes—with very little waste!
- Solar Panel: Radiant (Light) → Electrical
- Photons from sunlight hit the solar panel.
- Their energy knocks electrons loose in silicon atoms → creating an electric current.
- This electrical energy can power your home, charge batteries, or feed into the grid.
- No moving parts, no emissions—just pure energy conversion from the Sun!
Visualizing Energy Chains
Many systems involve multiple steps of conversion. Here’s a full chain:
Sun → (nuclear fusion) → Radiant energy → (photosynthesis) → Chemical energy in plants → (eaten by cow) → Chemical energy in milk → (you drink it) → Chemical energy in your body → (you pedal a bike) → Mechanical energy → (bike dynamo) → Electrical energy → (powers a headlight) → Light + Heat
One journey—from the core of the Sun to your bike light—through six forms of energy!
Final Thought: You’re an Energy Converter Too!
Every time you eat, move, think, or even breathe, you’re part of Earth’s grand energy cycle. By understanding how energy changes form, you become a smarter consumer, a more informed citizen, and a better problem-solver for the planet’s energy future.
Activity Idea:
Think about the energy conversions in your morning routine!
Example:
- Alarm clock (electrical → sound)
- Shower (chemical in gas → thermal)
- Breakfast (chemical → body energy)
- Bus ride (chemical → mechanical)
What other examples of energy conversions can you find in your morning routine?
1.11 Sources of Energy
1.11 Sources of EnergyWhat Are Energy Sources?
In the last few pages, we talked about different forms of energy. But now we want to talk about the primary source of energy. Energy doesn’t just appear—it comes from sources found in nature. Some of these sources are limited, while others are constantly replenished. Scientists group them into two main categories:
- Renewable Energy Sources
- Nonrenewable Energy Sources
Understanding the difference helps us make smart choices about how we power our homes, schools, cars, and cities—now and in the future.
The Big Difference: Can It Be Replenished?
Renewable Energy Sources: Nature’s Endless Supply
Renewable energy comes from natural processes that are continuously renewed by the Earth or Sun. These sources won’t run out in our lifetime—or even in thousands of lifetimes!
Solar Energy
- Comes from the Sun’s radiation.
- Captured using solar panels (photovoltaic cells) or solar thermal systems.
- Used for: Electricity, heating water, powering satellites.
- Clean, abundant, silent
- Intermittent (only works when sunny); needs storage (like batteries)
Fun Fact: In just one hour, the Sun delivers more energy to Earth than humans use in an entire year!
- Wind Energy
- Uses moving air (kinetic energy) to spin turbine blades.
- Turbines generate electricity.
- Common in open plains, coastlines, and offshore.
- No fuel, no emissions
- Needs consistent wind; can affect birds
- Hydropower (Water Energy)
- Uses flowing or falling water (from rivers or dams) to spin turbines.
- One of the oldest and most reliable renewable sources.
- Highly efficient, can be stored (in reservoirs)
- Dams can disrupt ecosystems and displace communities
- Geothermal Energy
- Taps into heat from deep inside the Earth (from radioactive decay and leftover formation heat).
- Used to heat buildings or generate electricity (e.g., in Iceland or California).
- Always available, small land footprint
- Only practical in geologically active areas
- Biomass
- Organic material like wood, crop waste, or algae burned or converted to biofuels (e.g., ethanol).
- Stores chemical energy from the Sun (via photosynthesis).
- Renewable if sustainably grown
- Burning biomass still releases CO₂ (though less than fossil fuels)
Nonrenewable Energy Sources: Limited and Finite
Nonrenewable sources exist in fixed amounts. Once we extract and burn them, they’re gone for millions of years. Most of the world’s energy today still comes from these sources.
Fossil Fuels
Formed over 300–400 million years from buried plants and microorganisms under intense heat and pressure. That’s why they’re called “fossil” fuels—they come from ancient life!- Coal: Solid fuel from ancient forests. Used mostly in power plants.
- Oil (Petroleum): Liquid fuel refined into gasoline, diesel, and jet fuel.
- Natural Gas: Gaseous fuel (mostly methane); burns cleaner than coal or oil.
High energy density (great for transportation and industry)
Major source of CO2 emissions → climate change
Causes air pollution (smog, acid rain)
Fossil fuels are NOT evenly distributed:
- Middle East: Rich in oil
- USA, Russia, China: Large coal reserves
- Russia, Iran, Qatar: Hold most natural gas
- This uneven distribution affects global politics, trade, and conflict.
Nuclear Fission (Uranium)
- Uses uranium-235, a rare metal mined from the Earth.
- Atoms are split in a reactor, releasing huge heat → makes steam → generates electricity.
- No CO₂ during operation; very high energy output
- Produces radioactive waste that must be stored safely for thousands of years
- Risk of accidents (e.g., Chernobyl, Fukushima)
Important: While uranium is nonrenewable, a tiny amount produces massive energy—1 uranium pellet = 1 ton of coal!
Energy Use in the United States (as of recent data)
- About 80% of U.S. energy comes from nonrenewable sources (oil, coal, natural gas, nuclear fission).
- About 20% comes from renewables—and this share is growing fast thanks to solar and wind.
- Transportation (cars, planes, trucks) relies heavily on oil—making it hard to decarbonize quickly, although electric vehicle use is quickly increasing.
Why Concentration Matters: Solar vs. Oil
You might wonder: If the Sun gives us so much energy, why don’t we use it for everything?
The answer lies in energy density and concentration:
- Oil is a highly concentrated fuel. A single gallon contains enough chemical energy to drive a car 25+ miles.
- Sunlight, by contrast, is spread out. To match the energy in one barrel of oil, you’d need a large solar farm operating all day.
That’s why we often say:
“The problem isn’t the amount of solar energy—it’s capturing and storing it efficiently.”
Technologies like better batteries, smarter grids, and more efficient panels are solving this challenge every year!
1.12 Conclusion: Energy Fundamentals
1.12 Conclusion: Energy FundamentalsThroughout this lesson, we’ve explored how energy is never created or destroyed—but constantly changes form. From the kinetic energy of a rolling skateboard to the thermal energy in a hot cup of cocoa, from the radiant light of the Sun to the nuclear energy deep inside atoms, energy is always moving, shifting, and making things happen.
One of the most important transformations we rely on every day is the conversion of chemical energy into mechanical energy. The food you eat stores chemical energy in molecules like glucose. Your body breaks those bonds and converts that stored energy into motion—allowing you to walk, write, play sports, or even blink! Similarly, when gasoline (a concentrated chemical fuel) burns in a car engine, it releases heat that pushes pistons, ultimately turning the wheels. In both cases—your muscles and your car—stored potential energy becomes active kinetic energy, powering movement and work.
We’ve also seen that where our energy comes from matters deeply. While fossil fuels like oil and coal have provided high-density chemical energy for over a century, they are nonrenewable and harm the environment. Renewable sources like solar, wind, and hydropower offer cleaner pathways—but they often require technology to convert their energy into usable forms like electricity or motion.
Understanding these conversions—and the sources behind them—empowers you to think critically about energy use. Every time you ride a bike, charge a phone, or flip a light switch, you’re part of a chain of energy transformations that began long ago, perhaps in ancient sunlight stored in plants or in the core of a distant star.
So remember:
Energy may be invisible—but its journey through our world is full of change, connection, and consequence. And now, you have the knowledge to see it, use it wisely, and help shape its future.
Lesson 2: Energy, Power and Utility Bills
Lesson 2: Energy, Power and Utility BillsThe links below provide an outline of the material for this lesson. Be sure to carefully read through the entire lesson before returning to Canvas to submit your assignments.
2.1 Introduction
2.1 IntroductionWelcome to Lesson 2!
In our last lesson, we explored the forms and sources of energy—from the chemical energy in your breakfast to the radiant energy streaming from the Sun. We learned that energy is the capacity to do work or produce heat, and that it can change forms but is never created or destroyed.
Now, we're adding a crucial piece to that foundation. Have you ever noticed that your phone battery drains faster when you're streaming video versus just texting? Or that a 13-watt LED light bulb uses electricity differently than a 100-watt bulb?
These everyday observations point to a key distinction that scientists, engineers, and even your utility company rely on:
Energy and Power are related, but they are not the same thing.
Think of it this way:
- Energy is the total amount of "fuel" you use—like the total gallons of gas put in your car this month.
- Power is the rate at which you use it—like how fast you burn that gas while accelerating onto the highway.
In physics terms:
Energy (measured in joules or kilowatt-hours) = how much work gets done
Power (measured in watts) = how fast that work happens
In this unit, we will be looking at how to convert energy and power units as well as reading electric bills. We will also learn how to calculate how much energy our household devices use and how much that costs us.
Lesson 2: Learning Objectives
By the end of this lesson, you'll see physics in action every time you flip a switch—and understand exactly what you're paying for when that bill arrives.
- Distinguish work, energy, and power using everyday examples
- Convert between units (joules ↔ kilowatt-hours) to connect physics class to your utility bill
- Calculate energy use: Energy = Power × Time (e.g., a 100 W bulb running 10 hours = 1 kWh)
- Interpret appliance labels to estimate real-world costs
- Decode an actual electricity bill—spotting how many kWh you used and why your cost per kWh isn't just the "supply rate"
2.2 Work, Energy and Power
2.2 Work, Energy and PowerIn everyday life, we say we’re “working” when we study, carry groceries, or hold a heavy box. But in physics, the word work has a very specific meaning:
Work is done only when a force causes an object to move in the direction of the force.
That means three things must happen for work to occur:
- A force must be applied.
- The object must move (undergo displacement).
- The motion must have a component in the direction of the force.
The Formula for Work
Where:
- Force is measured in newtons (N)
- Distance is measured in meters (m)
- θ (theta) is the angle between the force and the direction of motion
- Work is measured in joules (J) → 1 J = 1 N·m
But don’t worry—you don’t need trigonometry here. You may get in much more detail in a physics class, but not here. When force and motion are in the same direction (like pushing a shopping cart forward), cos(0°) = 1, so:
Real Examples of Work Being Done
- Pushing a stalled car 5 meters down the road → you apply force, and it moves → work is done.
- Lifting a backpack from the floor to your desk → you apply upward force against gravity, and it moves up → work is done.
- Pedaling a bike uphill → you push on the pedals, and the bike moves upward against gravity → work is done.
Common Situations Where NO Work Is Done (in physics terms!)
- Holding a heavy suitcase while standing still: You’re applying force (to counteract gravity), but there’s no displacement → zero work.
- Pushing hard against a wall that doesn’t move: Force? Yes. Motion? No → zero work.
- Carrying a box horizontally across a room: You apply upward force to hold it, but motion is horizontal. Since force (up) and motion (sideways) are perpendicular, no work is done against gravity. (You might get tired—but that’s biology, not physics!)
Units for Work: Joule (J), Calorie (cal), British Thermal Unity (BTU), kilowatt-hour (kWh), foot-pound (foot-lb)
Energy – The “Ability” to Do Work
If work is the act of moving something with force, then energy is what enables you to do that work. As we learned in the last lesson,
Energy is the capacity to do work.
Think of energy as your “work potential.” You can store it, transfer it, or convert it—but you can’t create or destroy it (thanks to the Law of Conservation of Energy).
For example:
- A raised hammer has gravitational potential energy → when dropped, it does work on a nail.
- A charged battery has chemical energy → it can do work to light a bulb or spin a motor.
- A moving soccer ball has kinetic energy → it can do work by knocking over a cup.
Energy Units: Joule (J), Calorie (cal), British Thermal Unity (BTU), kilowatt-hour (kWh), foot-pound (foot-lb)
**Note: Energy and Work have the same units!
Power: The rate at which we work (or energy) is done.
Now, imagine two people lift identical boxes to the same shelf:
- Person A does it in 2 seconds.
- Person B takes 10 seconds.
Both did the same amount of work (same force, same distance).
Both used the same amount of energy.
But Person A delivered more power.
Power is the rate at which work is done or energy is transferred.
The Formula for Power
Measured in watts (W) → 1 W = 1 joule per second (J/s)
Bicycling Example
- Imagine two bicyclists pedal 10 miles uphill → same work, same energy (218 calories) **assuming the cyclists are approximately the same weight
- If Cyclist Y finishes in 30 minutes; while Cyclist Z the other finishes in 60 minutes
- The amount of energy used in both situation is the same, Cyclist’s Y power output is twice as high—not because he did more, but because he did it faster.
- Cyclist Y completed 10 miles in 30 minutes versus Cyclist Z 10 miles in 60 minutes
Common Units of Power: Watt (W), kilowatt (kW), horsepower (hp), British Thermal unit per hour (BTU/hr), Joule/sec (same as a Watt).
Video: Energy, Work, and Power (3:33)
Transcript: Energy, Work, and Power
Defining Energy
Narrator: Hi. It's Mr. Andersen and today I'm going to talk about energy, work and power. Now what is something that has energy? It's a pretty big term. So what things have energy? Well we would say something in motion or something due to its position. We could say that electricity is a form of energy. We could say that matter can contain energy within its chemical bonds. Or light has energy. Or sound has energy. So that's a lot of different things. What is energy? Energy therefore is the ability to do work.
Understanding Work
Well that's one of those definitions that requires us to dig a little bit deeper. What is work? Work in science is simply a force times a distance. So anything that can apply a force over a given distance is said to contain energy. And we measure that in joules. So work is measured in joules. And so let's give an example. Let's say for example that you want to take a can of Coke and you want to carry it to the top of a set of stairs. Well that can of Coke has 4.0 newtons of weight. And let's say that you have to climb up a set of stairs that is 3.0 meters high.
Now the interesting thing is that since the gravitational force is always acting down, it doesn't matter if you get to the top of the stairs by walking upstairs or get to a similar distance by climbing up a ladder. Or simply just throwing the can of Coke up to that point. If you've moved it up a certain amount of distance, we'll call that 3.0 meters, then you've done 4.0 newtons times 3.0 meters or 12 joules of work to get that to the top.
Now you could get that to the top in a couple of different ways. Let's say that we were to gradually make our way to the top of the stairs. Or we were to run up the stairs. Well we would be doing the same amount of work depending on if we were running or going slowly.
Calculating Power
And so, we need another term to figure out how fast we're doing that. And that's called power. And so power is defined as the amount of work in a given period of time. So let's say that you were to go up that set of stairs with that can of Coke. And you were to do that in 1.0 second. Well the amount of work we have is going to to be 12.0 joules. And the amount of time is going to be 1.0 second. And so the power of that is going to be 12 watts or w-a-t-t-s or watts is going to be the amount of power that we have. If you were to do that slower, so let's say we were to do that in 10 seconds, then the amount of watts would drop form 12 watts to 1.2 watts. So that's really not that much power. And so, the amount of power that we're actually used to dealing with here in the US is horsepower.
Power and Horsepower
And so, horsepower is measured, it measures the amount of work that we can do in a given period of time. We use it in engines for example. And so the conversion is 1 horsepower is roughly 746 watts. And so let's go back to that problem. If we're able to move a can of Coke to the top of the stairs in 1.0 second we say that that's 12 watts. So if we convert that to horsepower then we are at 0.0040 horsepower machine. So that's not a very powerful machine.
Now the one thing that you should realize is not only are we moving that can of Coke to the top of the stairs. But we're also moving our weight, our whole body to the top of the stairs. And so maybe we're a little more powerful than we think.
2.3 Mastering Unit Conversions with the Factor-Label Method
2.3 Mastering Unit Conversions with the Factor-Label MethodWhy Unit Conversion Matters
You convert units all the time—often without even thinking about it!
- You know that 1 foot = 12 inches, so you can quickly figure out that 4 feet = 48 inches.
- You might also know that 1 yard = 3 feet, or that 1 mile = 5,280 feet.
- Maybe you’ve even heard that 1 mile ≈ 1.609 kilometers—useful when traveling or watching international sports!
When you’re familiar with the units, conversions feel easy. But what if you need to convert something less familiar—like miles to meters, gallons to liters, or joules to calories? That’s where a powerful tool comes in: the factor-label method.
What Is the Factor-Label Method?
The factor-label method (also called dimensional analysis) is a step-by-step strategy that lets you convert any unit to any other unit—as long as you know the right conversion factor.
The best part?
You never have to guess whether to multiply or divide!
The units themselves guide you.
How It Works: A Simple Example
Let’s convert 7.5 miles to feet.
We know: 1 mile = 5,280 feet
Step 1: Write down what you’re starting with
Step 2: Multiply by a conversion factor written as a fraction
Choose the form that cancels the original unit (miles) and leaves the desired unit (feet):
Notice how “miles” cancels out (one in the numerator, one in the denominator), leaving only feet.
Step 3: Do the math
Why This Method Always Works
The key idea is this:
Any conversion factor is equal to 1—so multiplying by it doesn’t change the actual amount, just the units.
Since , multiplying by it is like multiplying by 1—you’re just changing how you express the quantity.
This works for any unit:
- Time: seconds ↔ minutes ↔ hours
- Distance: inches ↔ cm ↔ meters ↔ km
- Energy: joules ↔ calories ↔ kilowatt-hours
- Mass: grams ↔ kilograms ↔ pounds
Pro Tips for Success
- Always write units—even in calculations. They’re your roadmap!
- Set up the fraction so the old unit cancels.
- Chain multiple steps if needed (like hours → minutes → seconds).
- Double-check: Does your answer make sense? (e.g., 7.5 miles should be many feet—not just 7!)
Final Thought
Once you master the factor-label method, no unit conversion will ever stump you again. Whether you’re solving physics problems, following a recipe, or planning a road trip abroad, this skill will serve you for life.
Remember: Units are your friends. Let them guide you!
Want to see it in action?
Check out this helpful video tutorial:
Video: Unit Conversion the Easy Way (6:14)
Transcript: Unit Conversion the Easy Way
Narrator: Learn Unit Conversion the Easy Way. The method that we will be using to convert between units is known as dimensional analysis or the factor-label method or even the unit-factor method. But what we call it really doesn’t matter. What matters is the fact that this is a versatile and powerful problem solving technique. So, let’s just do this. We’re going to start with a simple unit conversion problem.
A weightlifter can lift 495 lbs. How many kilograms is that? In order to solve a unit conversion problem like this, we first need one more piece of information: the conversion factor. For pounds and kilograms, the conversion factor is 1 kg equals 2.2 pounds. Now, we’re ready to solve this.
The first thing you should always do is write down the quantity that you want to convert. This is the number from the question, not the conversion factor. Please also include the units. Next, we are going to multiply this number by a fraction. Inside the fraction we are going to write the two numbers from the conversion factor.
But, how do we know which one goes on the top, and which one goes on the bottom? To answer that question, all we need to do is look at the units, which is why we always include the units in the calculation itself. The quantity we are starting out with has the units of pounds, so we take 2.2 pounds from the conversion factor and write it on the bottom. Next, because we want to end up with kilograms, we take 1 kg from the conversion factor and write it on the top of the fraction.
Notice that now, the pounds that we started out with cancel out with the pounds on the bottom, and the units we have left on top are kilograms, which is exactly what we want to convert to. The only thing left to do now is plug the numbers in our calculator.
You could, of course, put this in your calculator exactly the way it appears here...but maybe you don’t have one of those fancy calculators that can do fractions, or maybe you’re like me, and you just want to find a short cut. Because the number on the top of the fraction is 1, this becomes a simple division problem. In your calculator, type 495 divided by 2.2, and your calculator should tell you the answer is 225. Our final answer, therefore, is 225 kg.
There is one more thing that we should notice about this problem. The fraction, 1 kg over 2.2 lbs. actually equals one because 1 kg equals 2.2 pounds. In fact, any time we do unit conversions, we are simply multiplying our initial quantity by a conversion factor fraction that equals one.
Okay, now that we are experts at this technique, let’s try a slightly harder problem. A certain car has a mass of 1920 kg. How many tons is that? Just like always, we need the conversion factor before we can solve this, but this time we need two conversion factors: one to convert from kg to lbs., and another to convert from lbs. to tons. So, this is going to be a two step problem.
We start the problem by writing down the quantity from the question, 1920 kilograms, and then we multiply this by a fraction. The two numbers that go in the fraction come from one of the conversion factors, but what goes on the bottom? Because we are starting with kilograms, we write 1 kg on the bottom of the fraction so that we can cancel out the kilograms. Next, the other half of that same conversion factor, 2.2 lbs. has to go on the top. The kilograms cancel out leaving us with pounds as the units of our answer.
When you do the math in your calculator, simply multiply 1920 by 2.2. This time we are multiplying the numbers because the 1 of the conversion factor is on the bottom of the fraction. Our calculator tells us that the answer is 4224 pounds...but, we’re not done yet. We still need to convert the pounds to tons.
The second step works exactly the same way. First, we write down the number that we want to convert, that is 4224 pounds, and then we multiply this by a fraction. We want to have pounds in the denominator of the fraction so that we can cancel out the pounds. But which pounds do we choose? 2.2 pounds or 2000 pounds? Remember that we want to convert to tons, so choose the conversion factor between pounds and tons. We write 2000 lbs. on the bottom, and 1 ton on the top.
Our pounds cancel out, and we are left with tons for the units of our answer. In our calculators, we type 4224 divided by 2000 because the one is in the numerator of the fraction. Our final answer works out to be 2.11 tons. If you are following in your calculator and wondering why I rounded my final answer, the reason is that I should have only 3 significant figures in my answer because the 1920 I started with has only 3 significant figures.
Okay, we got the correct answer, but it turns out that there is an even better way to solve problems that involve multiple conversion factors. Rather than solving this in two separate steps, we can combine those steps into one step with two conversion factors. Check this out.
Once again, start the problem by writing down the quantity that you want to convert. Multiply this by a conversion factor fraction, putting what you want to cancel out on the bottom and what you want to convert it to on the top. Notice that so far this is exactly the same as the first step we just did. However, instead of solving this as it is, we are going to multiply it by another conversion factor fraction.
We now need to cancel out the lbs. that are left on top, so we put 2000 lbs. on the bottom. We chose the 2000 lbs. rather than the 2.2 lbs. because we ultimately want to convert the quantity to tons. This gives us tons as our remaining units on top while all the other units cancel out.
We then proceed to calculate from left to right. If the one is on the bottom, we multiply. If the one is on the top, we divide. So, we multiply 1920 by 2.2 and then divide that answer by 2000. Our final answer is 2.11 tons, which is exactly what we got the first time.
But now we can see how powerful this method is. No matter how many conversions you need to do, putting the conversion factors in fraction form helps you to know when to multiply or divide. Thank you for watching. Please comment, vote, subscribe, or check me out at ketzbook.com.
2.4 Multi-Step Conversions
2.4 Multi-Step ConversionsNow that we learned the factor label method for conversions, we can now try more complex conversions. Sometimes we need to convert several items in one problem. We can do it the same, just follow the units.
Example: Convert 55 mph to m/s
We want to change miles → meters and hours → seconds.
That means we need two conversion factors:
- 1 mile = 1,609 meters
- 1 hour = 3,600 seconds
Though it’s two changes, we use the same factor-label method—just with two fractions!
Step-by-Step Using Factor-Label
Start with what you know:
Step 1: Convert miles → meters
Use the fraction that cancels "miles":
→ "Miles" cancels out. Now we have meters/hour.
Step 2: Convert hours → seconds
We have “hours” in the denominator, so we need a fraction with “hours” on top to cancel it:
→ Now “hours” cancels too!
Put it all together:
Here's another way to look at it:
Now multiply the numbers:
Final answer: 55 mph ≈ 24.6 meters/second
Key Tips for Multi-Step Conversions
- Treat compound units (like mph) as two separate units:
→ “miles per hour” = miles ÷ hours, so convert numerator and denominator separately. - Always arrange conversion fractions so unwanted units cancel:
- Want to cancel miles? Put miles in the denominator of your conversion factor.
- Want to cancel hours? Put hours in the numerator.
- You can chain as many steps as needed:
Example: gallons → liters → milliliters → cm3 → m3… just keep adding fractions!
Real-World Why It Matters
- Scientists and engineers always use metric units (like m/s), but speed limits are in mph in the U.S.
- Knowing how to convert helps you understand car safety data, physics problems, or even video game physics!
- 24.6 m/s is about how fast a major league fastball travels—so 55 mph is roughly fast-pitch softball speed!
Quick Check: Does the answer make sense?
- 1 m/s ≈ 2.24 mph
- So 55 mph ÷ 2.24 ≈ 24.5 m/s → matches our result!
When your estimate lines up, you know you’re on the right track.
Final Thought
Multi-step conversions might look intimidating at first—but with the factor-label method, you just add one fraction at a time, let the units cancel, and follow the math.
No memorizing “multiply or divide”—just let the units guide you!
2.5 Power vs. Energy in Everyday Life
2.5 Power vs. Energy in Everyday LifeSpot the Power Label!
Take a look around you right now. Chances are, you’re using a laptop, phone, or tablet—and it’s plugged into a charger. Flip that charger over (or look at the label), and you’ll likely see something like this:

Quick Check: Is Watt a unit of energy or power?
Remember from our earlier lesson:
- Power = how fast energy is used → measured in Watts (W)
- Energy = total amount used → measured in Watt-hours (Wh) or kilowatt-hours (kWh)
So Watt (W) is a unit of power—not energy!
Let’s Calculate: How Much Energy Does Your Laptop Use?
Suppose your laptop charger is rated at 65.0 W, and you use it for 10 hours each day.
But utility bills don’t use Watt-hours—they use kilowatt-hours (kWh).
Since kilo = 1,000, we convert:
So your laptop uses 0.65 kWh per day.
What Does That Cost?
If we estimate electricity to cost about $0.15 per kWh (check your bill for your exact rate!).
That’s just 10 cents a day—or about $3 per month to run your laptop!
Depending on how much your electricity costs, you can now determine how much that one day of laptop use costs you each day (or month or year).
2.6 Common Appliance Power Ratings
2.6 Common Appliance Power RatingsWe will discuss appliances in more depth in a later lesson, but here is a list of common household appliances and their power ratings. Again, they can vary greatly depending on the manufacturer and age. Some appliances are getting significantly more efficient over time. For the most up to date information, please check the manufacturers rating on the device you are interested in. The table below is just an estimate.
| Appliance | Wattage (range) |
|---|---|
| Clock Radio | 10 |
| Coffee Maker | 900 - 1200 |
| Clothes Washer | 350 - 500 |
| Clothes Dryer | 1800-5000 |
| Dishwasher | 1200-2400 |
| Hair Dryer | 1200-1875 |
| Microwave Oven | 750-1100 |
| Laptop | 50 |
| Refrigerator | 725 |
| 36" Television | 133 |
| Toaster | 800-1400 |
| Water Heater | 4500-5500 |
| Appliance | Wattage |
|---|---|
| Aquarium | 50 - 1210 |
| Clock Radio | 10 |
| Coffee Maker | 900 - 1200 |
| Clothes Washer | 350 - 500 |
| Clothes Dryer | 1500-5000 |
| Dishwasher | 1200 -2400 (using the drying feature greatly increases energy consumption) |
| Dehumidifier | 785 |
| Electric Blanket (Single/Double) | 60 / 100 |
| Fan - ceiling | 65 - 175 |
| Fan - window | 55 - 250 |
| Fan - furnace | 750 |
| Fan - whole house | 240 - 750 |
| Hair Dryer | 1200 - 1875 |
| Heater (portable) | 750 - 1500 |
| Clothes Iron | 1000 - 1800 |
| Microwave Oven | 750 - 1100 |
| Personal Computer - CPU (wake / asleep) | 120 / 30 or less |
| Personal Computer - Monitor (awake / asleep) | 150 / 30 or less |
| Laptop | 50 |
| Wifi - Router | 5-20 |
| Radio (stereo) | 70 - 400 |
| Refrigerator | 725 |
| 36" Television | 40-60 |
| Toaster | 800-1400 |
| Toaster Oven | 1225 |
| DVR box | 11-26 |
| Vacuum Cleaner | 1000 - 1440 |
| Water heater (40 gallon) | 4500 - 5500 |
| Water pump (deep well) | 250 - 1100 |
2.7 Beginners Guide to Reading your Electricity Bill
2.7 Beginners Guide to Reading your Electricity BillHow electricity companies charge you
Have you ever looked at a utility bill? Really looked at the bill? More than just looking at the amount due. If you can, I would encourage you all to look at the bill to see some of the numbers on there. For this lesson, we are going to look at this utility bill. This is from PPL for June 2024.
At the top of the bill, you will see basic information, including:
- Account Number
- Due Date
- Amount Due
- Service Address
- Billing Period
In terms of this class, we really want to understand the usage. As we have already discussed, kWh (kilowatt-hour) is the basic unit of electricity and a unit of energy. This should be the unit on any electric bill might read. (You might see some additional units on there, including kW or BTUs, especially if your utility provides both electricity and natural gas service to your home.)
Total Usage: The amount of electricity (energy) used in the billing period. For the example bill it is 1,,434 kWh
Supply Charge versus Delivery Charge
This may be the most confusing part. This bill contains different charges for both Supply and Delivery. So what's the difference?
Supply Charge is for generating the electricity, typically from a power plant. In this example, the supply charge is $141.82 (which is the electricity usage 1,434kWh × $0.09890/kWh).
Unfortunately, that is not the only charge in this bill. Here we see a Delivery Charge. The Delivery charge is to maintain the poles and wires to deliver the electricity to your home. In this case, the Delivery Charge is $82.31, which includes all customer charges and distribution fees. You might be surprised to see the delivery charge is nearly 1/3 of the total bill.
Depending on the provider, your bill may be more complicated or simpler than this bill. Not every utility separates out delivery and supply charges, however some companies may include additional charges like a demand charge.
So, looking at this example bill, what is the actual cost per kWh of usage?
This is much higher than the electric charge shown, because we included all the charges, taxes, and fees.
This bill also shows your usage over time. The chart on the first page of the bill shows the total electricity used between July 2023 and June 2024.
Take a look at this bill and try and answer the following questions.
- How much electricity was used in this time frame? (Answer: 12412 kWh)
- What is the average usage? (Answer: 1034 kWh)
- What month used the most electricity? (Answer: August)
Real-World Application
Your Turn: Grab your own (or a family member's) electricity bill and:
- Circle the account number and due date
- Calculate kWh used: (Current reading – Previous reading)
- Find the split between supply vs. delivery charges
- Note one thing that surprised you
Understanding your bill is the first step to managing energy costs wisely!
If you do not have access to an electric bill of your own, use this example electric bill from PPL Electric Utilities.
Basic Calculation
Your June bill shows:
- Supply charge: $90.00
- Delivery charge: $40.00
- Total kWh used: 875 kWh
Calculate:
Total bill = $90 + $40 = $130.00
Effective cost/kWh = $130 ÷ 875 = $0.1486/kWh
Compare Two Months
August (high usage): 1,500 kWh → $150 supply + $65 delivery = $215 total
September (low usage): 600 kWh → $75 supply + $30 delivery = $105 total
Calculate effective rates:
- August: $195 ÷ 1,500 = $0.130 /kWh
- September: $90 ÷ 600 = $0.150/kWh
Even with the same rates, September costs more per kWh because fixed delivery fees ($15–$20) get spread over fewer kWh.
2.8 Understanding Different Types of Electricity Bills
2.8 Understanding Different Types of Electricity BillsDemand Charges Versus Energy Charges
We saw in an earlier part of this lesson the difference between energy and power. For our electricity provider, our Energy use is how much kWh we use. But we can also talk about the rate at which we use electricity, which is Power.
For most homes, you only pay for energy (kWh). But businesses and some large facilities also pay a demand charge based on their highest power draw during the billing period. Why? Because the utility must build infrastructure (transformers, wires) sized for your peak demand not your average use.
Take for instance this example commercial bill. It is also from PPL in June 2024, however it is much bigger than what most homeowners would pay for one month.
PPL bill with demand charge: Commercial Bill
On the Bill we can see the following:
- Total Energy Used - 598,000 kWh
- Peak Demand - 1,095 kW
- Energy Charge
- Demand Charge - $2.54701/ kW
- Days in Billing Cycle - 2
- Supply Charge $ - $0.00
- Delivery Charge - $3,133.19
In this case, the energy charge is negligible, but the customer paid a lot in their demand charge. This customer could reduce their bill by reducing their electricity use when their draw is the highest. Why? Because the utility must build the infrastructure (wires and transformers) to account for your peak demand, not the average usage.
Time-of-Use Billing:
Some utility bills use time-of-use (TOU) pricing, which charges different rates depending on the time of day you consume electricity—similar to "surge pricing" for rideshares or toll roads. During peak periods (typically 4 PM–9 PM on weekdays), rates are highest because demand on the grid spikes as people return home, cook dinner, and turn on appliances. During off-peak hours (usually 10 PM–6 AM), rates drop significantly due to much lower overall demand.
Why Peak Times Cost More
Electricity must be generated the instant it's used. When millions of households draw power simultaneously during evening hours, utilities must activate expensive "peaker" power plants to meet demand. TOU pricing reflects this real cost—and incentivizes customers to shift flexible loads to times when the grid has excess capacity.
Sample TOU Rate Structure
Hypothetical residential plan (rates vary by utility)
Smart Shifts That Save Money
Because peak rates can be 2 to 3 times higher than off-peak rates, small timing changes yield real savings:
Where TOU Is Common
TOU billing is increasingly standard in high-demand regions like California, Arizona, and parts of the Northeast—especially for customers with solar panels or electric vehicles. Always check your utility's specific peak windows, as they can shift seasonally (e.g., summer afternoons may become peak due to air conditioning demand).
2.9 Conclusion: Energy and Power in Everyday Life
2.9 Conclusion: Energy and Power in Everyday LifeYou started this lesson distinguishing energy (the total "fuel" used) from power (how fast it's used). Now you can apply that knowledge to something you'll encounter for the rest of your life: your electricity bill.
In this lesson you learned to:
- Convert between physics units (joules) and billing units (kWh)
- Calculate appliance costs using Energy = Power × Time
- Decode a real bill—like identifying that 1,434 kWh used over 32 days equals a 45 kWh/day average
- Separate supply charges (the electricity itself, often shoppable) from delivery charges (grid maintenance, fixed by regulators)
- Recognize why your effective cost per kWh ($0.157 in our example) is higher than the supply rate alone ($0.099/kWh)—because delivery fees and fixed charges get added in
Most importantly, you now see physics not as abstract formulas, but as a lens for financial literacy. When you understand that a 1,500 W space heater running 4 hours costs about 6 kWh—and roughly 95¢ on a typical bill—you make smarter choices about energy use and costs.
This is energy literacy: the ability to translate classroom concepts into real-world decisions. Whether you're comparing electricity suppliers, sizing a solar panel system, or simply deciding whether to unplug that idle charger, the physics of energy and power puts you in control.
Lesson 3: Energy Supply and Demand
Lesson 3: Energy Supply and DemandThe links below provide an outline of the material for this lesson. Be sure to carefully read through the entire lesson before returning to Canvas to submit your assignments.
3.1 Lesson 3 Introduction
3.1 Lesson 3 IntroductionWelcome to Lesson 3!
Welcome to this exploration of world energy consumption. In 2024, humanity used approximately 186,000 terawatt-hours of energy that's enough to power every home, factory, vehicle, and data center on Earth. But where does this energy come from? How has our relationship with energy evolved since the days of wood fires? And what choices will determine whether we meet growing demand while protecting our climate?
In this lesson, we will be learning about the changes in energy supply and demand throughout history. We will be looking at both U.S. energy use and world energy use to understand patterns at multiple scales. While there are lots of numbers in this unit, it is important for us to remember trends and estimates, and not worry about the exact values. Energy data is complex and constantly updated—for example, the most recent energy data is available from the EIA U.S. Energy Facts Explained.
To illustrate this approach: In the latest U.S. data, we see that about 9% of U.S. energy comes from renewable sources. But what's most important to remember isn't the precise percentage—it's the bigger picture: petroleum and natural gas are the primary sources of U.S. energy use, and together those two sources account for nearly 75% of total U.S. energy consumption. That trend—fossil fuel dominance with renewables gradually growing—is the key takeaway.
Lesson 3: Learning Objectives
Upon completing this lesson, you should be able to:
- Analyze historical trends to understand how the Industrial Revolution transformed global energy use
- Compare energy consumption patterns across countries and connect them to GDP, geography, and lifestyle
- Investigate interactive data visualizations to see how fossil fuels still dominate—and how renewables are rising
- Evaluate three potential energy futures from the International Energy Agency and consider what "Net Zero" really means
- Calculate real-world applications like energy doubling time to grasp the scale of future demand
By the end, you'll not only understand the numbers behind global energy you'll be equipped to think critically about the policies, technologies, and personal choices that will power our shared future. Let's begin.
3.2 Global Energy Consumption
3.2 Global Energy ConsumptionIn 2024, the world wide energy consumption was about 186,000 TWhs (or 635 Quadrillion BTUs). The energy mix used by the whole world is shown below in the figure from Our World in Data. This figure is interactive, so you can slide the bar across and see how that information changes over time. The largest energy source for the whole world is Oil, followed by Natural Gas and Coal. This means most of the world's energy comes from fossil fuels. If you slide the bar around, you can see how renewable has begun to steadily increase in the past decade or more.
Energy consumption numbers are always reported a few years behind, so we are always looking into the past before we plan for the future. As of 2024, the world's total primary energy consumption was about 186,000 TWhs (635 Quadrillion Btus).
What is interesting to see in this chart, which goes all the way back to 1800, is that for the first 100 years, the main energy source was only biomass and relatively consistent. In that time, nearly all energy was from biomass in the form of wood. Do you know what happened in the late 1800’s to start the exponential growth of energy use?
The Industrial Revolution played a key role in human development and energy use. Some inventions in that time period include:
- Steam Engine- allowed for travel and transportation of goods
- Discovery of Oil- Titusville PA 1859
- Textile Machinery
- Internal Combustion Engine
- Electric Generator
- Electric Lighting
After the industrial revolution, we start to see an increase in coal use, followed by oil and finally natural gas. Recall from lesson 1, those three energy sources are called our Fossil Fuels. Those three energy sources also account for the majority (over 80%) of the world’s energy use.
Please use the interactive features of this figure (using the arrow next to the year 1800) to adjust the time frame and investigate this chart further.
Data table for the Global Primary Energy Consumption by Source chart.
Use the following link to downlaod the data (csv file) for the Global Primary Energy Consumption by Source graphic.
The figure below shows how energy use is used per person (or per capita). You can see which countries have the highest energy use per person, in the dark red. The US is one of the highest consumers (but not the highest). Which country do you think is the highest user of energy per capita?
You can also explore this data, to see how it has changed over time. One major change over time is with China, which starts the time-laspe as about 1,000 kWh/ per person and ends the time-lapse at over 30,000kWh/per person.
- Do you expect this number to steadily increase?
- What do you expect to happen to India in the next 10 years?
- Do you think US energy use has increased, decreased or stayed the same over time?
Please click on the "Explore the data" for more analysis of each country over time.
Data table for the Primary Energy Consumption Per Capita chart.
Use the following link to downlaod the data (csv file) for the Primary Energy Consumption Per Capita graphic.
3.3 World Energy Outlook
3.3 World Energy OutlookAccording to the International Energy Agency, the world energy outlook for 2025. This report is modeling three different potential energy futures, Current Policies Scenario, State Policies Scenario and Net Zero Emissions Scenario. Those three scenarios are shown below.
Three Scenarios, Three Futures
Please take a look at the World Energy Outlook 2025 Executive Summary of this latest report.
Key takeaways include:
- Energy demand is expected to grow through 2050, but that rate depends on the speed of which India and Southeast Asia grow.
- While coal will continue to decline, natural gas and petroleum and still expected to grow throughout the mid-century. Coal use is expected to peak somewhere around 2030.
- Global temperatures will continue to increase, expected to reach 3°C by 2100 if current policies remain. Under the Net Zero Emissions Scenario we can still expect an increase in global temperature of 1.65°C
- Electrification plays a growing role worldwide. Data Centers and AI account for 10% of world wide electricity consumption, however the US sees a larger share of these centers.
Nearly 9% of the world population still live without electricity, and nearly 2 billion people rely on polluting cooking methods such as open fires and charcoal.
Podcast: World Energy Outlook 2025 (32:17)
Transcript: World Energy Outlook 2025 podcast
Dan Hewitt: Welcome back to the IEA's podcast, Everything Energy. I'm Dan Hewitt.
This week, we're looking at the 2025 edition of the IEA's World Energy Outlook. It's widely viewed as the most authoritative source of energy analysis and projections. It uses the latest energy data, technology and market trends and government policies to explore a range of possible energy futures. And here to talk through some of the report's key findings are lead authors, Lara Kotze and Tim Gould.
Lara is the IEA's Director of Sustainability, Technology and Outlooks, and Tim is the IEA's Chief Energy Economist.
OK, Lara Kotze and Tim Gould, thank you so much for joining us. Now, to start with, I want to just remind people about the purpose or the aim of the World Energy Outlook. So, could you just boil it down into a couple of sentences, the key aims of it?
Lara Kotze: Yeah, thank you very much, Dan. So, every year for the past several years now, we produce and release the World Energy Outlook. And basically, as we know, there is no single storyline about the future of energy. We do present always multiple scenarios, none of which is a forecast. and we explore implications of policy, technology and market trends through 2050, actually. And the reason why we do this is that we intend to give all the possible data and consequences for policymakers, energy stakeholders at large, to take the best decision for the energy future.
Dan: OK, now there is another full commentary about some of the scenarios that you mentioned, but I think the best way to talk about the WEO is to look at the big themes. So, we're going to start with energy security. And the report said that energy is at the heart of today's geopolitical tension. So, Tim, I wonder if you can tell me a bit more about what's been driving that.
Tim Gould: Yeah, thanks, Tim. I think the thing that strikes us when we look at the energy landscape today is not just any individual aspect of energy security, but the fact that we have such a range of issues that cover pretty much all of the fuels and technologies that are out there. So, when you look at oil, there's an issue of sanctions. When you look at gas, there's obviously been the extreme tensions around Russian supplies to Europe or the cut to Russian supplies to Europe and what that's meant for global markets. But also, when you think of electricity, there's been a lot of strains on electricity systems in recent years that have become clear through blackouts and other operational incidents that also brought that into very much the political domain. But when you look also at new technologies coming into the system and particularly the supply chains for critical minerals, you've had very much in the news, the export controls on rare earth elements and battery-related technologies. So, the sense that that market concentration, the extreme level of market concentration that you have for some of those technologies and some of those critical minerals, that's also very much a feature of the energy security discussion. So, across all of those different elements, there are things that make a very complex landscape from our perspective and demand responses also from the energy policymakers who we're trying to communicate with also as part of this report.
Dan: And just staying with critical minerals for a second could you explain to us some of the vulnerabilities there specifically about China in terms of about the refining they do about the problems that happen if you have so much concentrated in one country.
Tim: So I think first of all we need to be clear that we're talking about a different category of threat when we when we when we refer to critical minerals and because these are not things that are used directly in the energy sector as fuels. So, it's not the same as a shortfall for oil, where everyone who uses oil feels the effect of a spike in prices. But these are extremely important inputs, these critical minerals, to a range of really important bits of the energy infrastructure. So, copper for wiring, for transmission lines, all of the battery metals like cobalt and nickel and lithium going into the batteries that then provide really important services in the energy sector. And rare earth elements that go into electric motors and other aspects of energy related technology. So, when you have a shortfall in those areas, they really affect your ability to bring those technologies into the system at scale. So that's a little bit the context. And when we look at the degree of concentration, so China has a very high share of the market for refined output of a lot of those products. It's also a huge user of those outputs. That's one of the reasons why it has this very strong position. But it does mean that one of the golden rules of energy security is diversification. So, whenever you see a high degree of market concentration in any part of the energy sector, that's a cause for looking carefully at what risks might emerge as a result. And that's very much the situation that we see at the moment for critical minerals.
Dan: Okay, staying with vulnerabilities, the report also mentions threats from weather and cyber-attacks. So, Laura, I wonder if you could just tell us a bit more about that. And how can you build in resilience to those threats?
Lara: Yeah, thank you very much, Dan. I think as Tim mentioned earlier, the key thread here is multiple threads throughout multiple fuels and technologies and what you have been seeing particularly for the electricity sector is that the risks that are concerning electricity and their security are multiplying and we have been trying to track data about what's happening and the two areas have particularly struck our attention one has been how quick cyber-attacks are increasing. And we find that over the past four years, the number of cyberattacks directed to energy utilities have tripled. This is clearly showing for us an increasing vulnerability towards electricity supplies. An interesting feature here is that AI is actually helping the cyber-attacks to happen on one hand, but on the other hand, we are also seeing that those utilities that that have AI embedded in their systems are the ones that are able to come out of the attack more quickly. So, at the same time, AI being a threat can help to security here. The other is really extreme weather, and now those are influencing the functioning of electricity systems. You can have very high temperature, therefore bringing up electricity demand, but at the same time, what would happen is that conventional generation such as hydro may be very low, you wouldn't probably have wind, so you have a supply that is constrained, demand that is very high, and in some cases very violent events that could be storms or others. So, we were simply trying to track and understand how serious is this problem, and for last year we have actually found that 200 million households were affected by blackouts that that were directly linked to extreme weather events. So, something that is large and that we should increasingly take into account when making sure that electricity is up at all times.
Dan: Okay, now another big theme is the world's thirst for energy and the shifting center of gravity of where that demand might come from. So, could you put into context the scale of that energy demand and the developing countries that could be driving it?
Lara: Yeah. So, I think that one area that we have been trying to highlight is the commonalities across all of the scenarios that we are portraying in the World Energy Outlook. And we need, first of all, to understand why do we need energy and who will need it. So, we are seeing important drivers that point to very clear directions. The first is, where is the economy growing? And the economy is growing most in the service sector, meaning digital, meaning financial services, meaning health care. And the service sector tends to be very electricity intensive. So, it's already an indication that we're moving towards an economy that is more dependent on electricity than before. The other big driver is, of course, where is population? And we are seeing some important shifts there happening. As we speak, actually, China is experiencing a big population, and in the next 10 years, we'll actually be seeing less people in China, 50 million less people living in China than today. We all know that China has been driving demand of energy, basically writing the history of energy for the past 10 years or so. And this is changing. This is changing as more people are living in other emerging countries and developing economies, in particular, India. Southeast Asia, but also Latin America and Africa. So, population there are becoming richer. They are requiring more energy for cooling needs, owning more refrigerators, owning more cars. And therefore, we are very clearly seeing across all of the scenarios that the increase in energy demand is coming mostly from this group of countries that are altogether, not in a single way, taking the baton from China that has driven and written the energy history for the past decades over to the next decade. Okay and let's move on to renewables because another big theme in the report is the rising role that renewables are going to play. So, could you put into context how fast they are growing compared with other fuels in other sectors? Yeah, I think the renewables growth has to be really put in the context of the electrification of the economy We only understand it through that, actually. Electricity is the fastest growing fuel, if we may say so. And we need to understand which fuel and technologies are going to provide all this additional electricity that the world will need. And we find that all low emission technologies are growing very, very fast, led by solar. And the reason why solar is leading this growth is a combination of three factors. First is a cost. Solar is becoming more and more cost competitive. Many countries around the world are still having policies in place that support the deployment of solar. A third, importantly, 80% of the increase in electricity demand is actually happening in places where the solar resources are excellent. This was not the case in the past, where most of the growth would be in the northern hemisphere, where you don't necessarily have the best solar resources. So, all these three things happening at the same time put Southern in a very good position. Nuclear is also growing very, very fast. We have been saying for the past several years that nuclear were experiencing a renaissance. And the data are very clear. 2025 is already seeing a record in terms of electricity generation for nuclear, growing another over 30% to 2035. and we're seeing the largest amount of new construction happening for the past 30 years. So, a very strong growth of all low emission fuels.
Dan: Okay, now staying with the energy mix, let's look at fossil fuels. So, what does the report say could happen to the consumption of oil and gas if we stay on our current path? So, one of the scenarios mentioned in the report.
Tim: So we do have, we've brought back this current policy scenario after a few years. It's back in the WEO 2025. And one of the findings from this year's World Energy Outlook is that if you just look at the policies that are in place, so enacted formally, and you also take a relatively cautious view on how quickly new technologies can be brought into the system, then that extends a horizon out for oil and natural gas growth beyond 2030 and towards mid-century. And so that's created a lot of interest and because when you look at another set of scenarios that we produce, the stated policy scenario, we have a different picture. We have oil flattening out around the end of this decade. And last time we did the stated policy scenario, gas also had a similar kind of trajectory. But this year, primarily because of policy changes in the United States and lower prices, because lots of new LNG coming to market, that period of gas growth extends out into the 2030s. So that's the broad picture for oil and gas demand in those two kind of more exploratory scenarios.
Dan: Okay, let's dig a little bit more into oil. What could change the different scenarios for the way the world uses oil, oil demand?
Tim: The thing that makes the biggest difference is EVs and electric mobility. There is a number of different ways in which you can approach the differences between that CPS trajectory that continues to grow and the flattening that we get in the stated policy scenario. Efficiency policies make a difference. The way that we collect and recycle plastics makes a difference and, but the single biggest factor is electric mobility because it's all about road transport and road transport is nearly half of oil demand. And in the the scenario that keeps rising. You know you have electric mobility continue to expand in in established markets notably in China, and but also in Europe where you have strong policies in place. But elsewhere doesn't really follow suit because you haven't followed through with putting the infrastructure in place and getting the incentives in place for consumers to buy electric. And that is one of the things that differentiates that outlook from a flattening outlook for oil demand, where you have outside of Europe, outside of China, particularly in emerging developing economies where car ownership rates are increasing quite strongly. You know, those choices switch also across much more so to electric in that stated policy scenario. And that's the key reason why you have that flattening.
Dan: Okay, well, let's talk about liquefied natural gas, LNG. It talks about a wave of it. So, who is going to be producing it and exporting it? And where is it going to go?
Tim: The growth is coming overwhelmingly from the United States, followed by Qatar. So, there's been this wave of new final investment decisions taken for LNG export capacity. And that wave has only grown stronger over the last 12 months since we last produced the World Energy Outlook because there's been a lot of new project approvals overwhelmingly in the United States that just make that wave even bigger than it already was in the last WEO. So that then extends out and some of it will come to Europe. Europe, domestic production is down, you know, and it's also moving away from pipeline gas from Russia, of course. So, it does need more LNG. China, in our view, will take some more LNG. But there's some new markets as well. And as prices come down for natural gas, there's potential then for countries like India or countries in Southeast Asia to also take in some of that LNG. And that's exactly what we see in our scenarios. It goes into industry. Some of it goes into power. Some of it goes into transport. You know, these are countries that by and large need cooling rather than heating. They have a very good solar resource. So, it's not going to be the same picture for gas use as you get in a place like Europe, where you have a large winter heating requirement. So, you need to be very conscious of those regional, you know, those regional factors and exactly where gas might come into the system.
Dan: And before we leave fossil fuels, I've got a question about coal. Coal demand is growing 50% faster than the next fossil fuel. I'm interested to know what's driving that.
Tim: So over the last few years, a lot of that has had to do with China. As Laura was mentioning that, you know, we've had a lot of electricity demand growth in different parts of the world, but China's been particularly strong. And where you also have peak demand increasing, you're bringing some of that backup capacity into the system, and a lot of that in many parts of the world has been coal. So that's one of the reasons why coal demand has been rising in recent years. But the future doesn't necessarily look like the recent past. And the speed at which countries like China are building out not just renewables, but also nuclear. In our view, it reduces the call on coal. How quickly that happens, you can see interesting variations across the different scenarios. But even with all of that extra electricity demand, at a certain point, if you continue the momentum behind solar, if you continue the momentum behind wind and nuclear and other technologies, that starts to have implications for coal too. And that's why we do see coal use going into decline before the end of this decade.
Dan: Okay, now, so we were talking about the energy mix there. So, I think it makes sense to talk about global emissions. Now, the report says there is less momentum than before behind national and international efforts to reduce emissions. And I just wonder if you could tell us a bit more about what's caused that momentum change, and really what it means for global emissions
Lara: Yeah, so, as we, as we mentioned at the very start then we, we are taking here a scenario approach and what we are doing is understanding and give really the consequences of each of the choices in front of all of energy professionals. So, in the current policy scenario that the team mentioned earlier that we reintroduced this year, we're actually seeing emissions remaining pretty high and rather flat to the 2050. In the stated policy scenario, we see a peak and a modest decline in emissions. And we have also, as we have been doing since 2021 now, also the net zero by 2050 scenario, which by design brings emissions down to zero in 2050. And what are the implications of each of those emission trajectory? The first, the current policy scenario would lead us to, by the end of the century, around 3 degrees warming, the stated policy scenario around 2.5 degrees warming, and the net zero by 2050 scenario, 1.5 degree warming. Something important to note that has happened for the first time this year is that across all of the scenarios, temperature, the 1 .5 degree temperature will be surpassed by 2030 in all of the scenarios and in all of the scenarios of course by different degrees we will stay above this threshold for several decades. This for us is another clear sign that the resilience measure within the energy sector will become ever more important.
Dan: And Lara I want to pick up on what you were saying earlier about electricity. Now the IEA has spoken in the past about the age of electricity coming soon, but now we're talking about its arrival. So, what are we pointing to? How has it moved from something expected to something we're living in today?
Lara: I think, first of all, we start from the data over the past few years. It has been very clear that electricity demand has grown much faster than energy demand, and this has happened sequentially over several years now. And for the reasons we have explained at the beginning, we are moving towards a society that is increasingly service based. Large parts of the population that are living in areas requiring cooling are becoming rich enough to actually buy air conditioners. And of course, the very big push of AI data centers and digital technologies are really pushing electricity demand very strongly up. So, there are a couple of pointers here. So, the fact that electricity demand is growing and growing stronger than energy demand is true across all of the scenarios that we have explored. And to give a sense of scale, the minimum amount that we're seeing being required from now to 2035 being additional is 10,000 terawatt hours, which is the entire amount of electricity that advanced economies are consuming today. This is huge. So, we often say that electricity accounts for around 20% of final energy uses but the reality is that sectors accounting for over 40% of the global economy use electricity as a primary input. So electricity has a disproportionate importance in the economy as we live in today and is only going to grow in the next 10 years That's why we're really saying we are here, it's the age of electricity, and it's becoming even stronger.
Dan: And just a question on potential roadblocks about electrification. Are we concerned that the grids are ready to meet that rising electricity demand? Not sure, Tim, if you want to answer that.
Tim: So we are concerned, yes. We've had a situation over the last 10 years that investments in generation have risen very substantially, up to around $1 trillion worth of investment each year. But if you look at the investment in grids, they've risen at less than half that pace, and there are around $400 billion each year. And what that means over the last 10 years is that 10 years ago we were spending, for every dollar going into generation, we were spending about 60 cents on infrastructure. Now that ratio has gone down to $1 for generation to 40 cents on infrastructure. And that is not where we need to be, because especially with the sorts of developments that Laura's been talking about, where you have new technologies coming into the system. You've got a lot of new demand. You need to be connecting up new loads. You need to be managing variability. You need your infrastructure to be working extremely well. And that's not the case in many countries. And so, there is this sense that investments in grid need to pick up very substantially in order to ensure the reliability, but also to make sure that we're using these new resources cost effectively. Because if you see lots of curtailment, that can be a way at the margin to manage some of these new resources, but too much of it, and you're just wasting a valuable asset. So, you need to make sure that the kit, the grid, is really fit for purpose, make sure that it's smart and that it's connecting new uses, connecting people who don't have access to electricity at the moment. So, I think it's a really important component of the future.
Lara: If I may come in here, I think Tim has brought in a very, very important point. We are seeing changes in the way electricity demand is coming in particular peak demand is growing very, very strongly and this growth in in peak demand that we're expecting over the next decade is larger than the increase we have had in what we call dispatchable sources over the past decade so we are going to be seeing increase in all dispatchable sources over, over the next decade being hydro, natural gas, coal but importantly, we're seeing very much a new star rising and this is batteries. Batteries is the fastest growing capacity of a dispatchable source out there. We're expecting to see a tenfold increase for a number of reasons because it can help being there at all times. It can help with the flexibility required by the amount of solar and cooling that are coming into the system. So, we have seen spectacular growth over the past couple of years, spectacular cost declines and we are seeing we are expecting to see a very, very big deployment of this technology.
Tim: Just coming back in, if i might, uh because there's I mean we've gone through this uh this conversation without mentioning the word uh efficiency and it's probably uh you know we would we would look back and regret if we didn't mention it because it's super important also in this on in this area. Um, you know there's a lot of new air conditioning units being bought around the world and the efficiency of those units is a really important factor in determining peak demand and in determining some of the strains that we might see in electricity systems. And one of the aspects of the new analysis that we put in this year's World Energy Outlook is to say, well, if the technical efficiency of those air conditioners was up at the level that we see in some of the leading countries of the world, I mean, Japan, for example. That would reduce overall consumption substantially for cooling. I mean, you could bring it down by roughly a quarter, but it would have particularly important implications for peak demand and some of those strains that you get on the systems. You know, at moments when you need to have as much flexibility as you can. So, there's a really important part of this debate is around improving those minimum energy performance standards and the ways that you can ensure that the efficiency of the appliances that we're buying is as good as it can be. And this is not a question of making stuff more expensive for consumers, because by and large, you can find more efficient appliances on the shelves in different countries around the world at really at minimal or no cost differential to the average that's being bought today.
Dan: Okay, another source of energy demand that's in the news a lot is data centers. And I just wonder if we can reflect on what the report says about the scale of investment in data centers and how much energy demand, they could potentially use.
Lara: So what's happening at data centers today is remarkable. We have been seeing over the past decade a doubling of data center servers and we are expecting these to actually double again by 2035. Investments that are going into data centers today are basically on par of what we're seeing in the oil sector. So, when we say data is the new oil, there is also some very clear economic figures that back that up. Data centers are very energy intensive. In fact, they're very electricity intensive. And currently they are concentrated in three areas of the world. They are in the US, China and the European Union. 85% of data centers are in these three locations. So, in certain regions of the world, in particular the US, they are going to mean a very significant change in electricity demand trends. We are coming out of a decade of electricity demand being flat in advanced economies. Data centers are changing actually this shape. So, electricity demand is returning to growth because of data centers. In the US, they will account for 50%. So, half of the electricity demand growth in the U.S. is going to be driven by data centers. So, this is very, very significant. But when you look at the step back in the global level, data centers today are around 1.5 percent of global electricity use. And in terms of growth, they will account for around 10 percent. So, a very significant part. But we mentioned earlier, demand for cooling, demand for appliances, demand for other types of uses is also growing very fast. So, at the global level, significant, but not huge. At local scale, it can have very, very big implications.
Dan: Now, bringing together some of these ideas that we've spoken about, and I'd love to hear both of your thoughts on this. And it says, to meet some of these challenges, policymakers need to show the spirit of 1973. And I'd just be interested to know what you think that means. What do we mean by that?
Tim: Well, I'll have a first go. Around the time, that's obviously around the time that the IEA was created, first oil shock, and the initiative that then led to countries coming together to resolve some of these pressing energy security issues that arose because of that spike in oil prices. So the first thing, the first association that we're looking for there is when we think about some of these new emerging energy security challenges, whether that's in the electricity sector, but particularly now in some of the supply chains for critical minerals and elsewhere, can we think about rallying around to find solutions there, to find mechanisms for cooperation that will allow us to address them in the same way that we did back then, 50 years ago, on oil security. And obviously that led to the creation of the IEA back in the day.
Lara: Yeah, I think that what we were putting together over the past year, the World Energy Outlook, we found through data, very much confirmation of a lot of the discussions that were held in London and the Future of Energy Security Summit. So multiple risks, risks multiplying across different fuels, across different technologies, across critical minerals. And we felt, and in particular the executive director mentioned that in an op-ed on critical minerals, it's a bit of 1973 moment, certainly for critical minerals, but for energy security at large. So, I think we are trying to ring an alarm bell to policymakers that those risks are there in a systemic way as never before. So, we would go back to the principles of energy security, try to work all together on diversification, predictability and cooperation. So, this is a bit the sense of the 1970 dream moment.
Tim: And this one sort of remark that also the executive director made with the launch of the World Energy Hourly, that it's very important to respond to these energy security threats, these risks that we've talked about. But you can't forget other policy goals. So, you need to think about, as he put it, the synergies and the trade-offs that might arise also with really important goals on affordability, on access, on competitiveness, but also on climate change.
Dan: Okay, well, Laura Kotze and Tim Gould, thanks so much for talking to me.
Lara: Thank you, Dan.
Tim: Thanks a lot, Dan.
3.4 Current and Future Energy Sources of the World
3.4 Current and Future Energy Sources of the WorldThe figure below shows the per capita energy consumption for each country. The energy sources are also split out by source, so you can see where each country gets their energy. The US consumes the most energy per person. Interact with the graph and answer the following questions.
- What country is #2 energy consumer per capita?
- What is the average energy consumption per capita for the average citizen of the world?
- What source of energy is the highest for a citizen of China?
- In 1965, which country was the second largest energy consumer in the world?
Data table for the Per Capita Primary Energy Consumption by Source, 2024 chart.
Use the following link to downlaod the data (csv file) for the Per Capita Primary Energy Consumption by Source, 2024 graphic.
The figure below shows the Global Primary energy consumption by source. This shows how the world wide energy sources have changed over time. As you explore the data, answer the following questions.
- What was the primary world-wide energy source prior to 1860s?
- What is the primary world-wide energy source today?
- In what year do you see Nuclear become an energy source?
- What renewable energy source is the largest percentage of world-wide energy?
Data table for the Global Primary Energy Consumption by Source chart.
Use the following link to downlaod the data (csv file) for the Global Primary Energy Consumption by Source graphic.
Energy Consumption and Electricity Projections
According to the International Energy Outlook (2023), global electricity generation will increase through 2025, however most of generation will be produced from renewable (zero-carbon) technologies. It is important to note that Net-Zero Carbon technologies are renewables, however, it can include nuclear power. Nuclear power plants do not emit any carbon emissions, so the figures below include nuclear as well as renewables. There has been increased discussion about nuclear power in recent years, including Small Modular Reactors (SMR), so it is possible to see a resurgence of nuclear power in the next 10-20 years.
In the IEA 2023 report, the combined share of fossil fuels (coal, petroleum and natural gas) is expected to decrease. They also predict that electric vehicles are expected to account for 29%-54% of all new vehicles sales by 2050. China and Western Europe are leading the switch to Electric Vehicles.
You can see in the figures below that the EIA predicts that world-wide electricity generation is expected to increase anywhere between 30-76% through 2050. The gray shaded area on the charts represents the level of uncertainty in development depending on a number of policy and economic factors. Renewables and nuclear are expected to produce most of the world’s electricity needs through 2050.

Note: Shaded regions represent maximum and minimum values for each projection year across the IEO2023 Reference case and side cases. Ref=Reference case.
Text description of the World Electricity Generation by Fuel Type image.
The image displays six line graphs representing global electricity generation projections by fuel type, measured in billion kilowatthours, from 2020 to 2050. The graphs include total electricity generation, coal, solar, natural gas, wind, and nuclear. Each graph features a black line depicting the reference scenario and a shaded area indicating projection uncertainty. The total electricity generation graph shows a steady increase. Coal remains relatively stable, while solar shows substantial growth. Natural gas and nuclear exhibit slight increases, and wind shows moderate growth. The top right corner features the EIA logo.
The figure below shows the expected electricity generation through 2050 from different areas of the world. China is expected to grow in all electricity generation, including fossil fuels, however their zero-carbon technologies are expected to account for most of their electricity generation through 2050. They are projected to have rapid growth in renewables through 2030 and start to level off as we get closer to 2050. Western Europe is expected to see nearly all of their increase in electricity generation to come from zero-carbon sources, while fossil fuel generation is decreasing. India shows a dramatic increase in electricity production from net zero-carbon sources, while fossil fuels remain plateaued through 2050. Africa shows an increase in electricity generation from all sources through 2050.

Note: Each line represents IEO2023 Reference case projections. Shaded regions represent maximum and minimum values for each projection year across the IEO2023 Reference case and side cases.
Text description of the electricity-generating capacity image.
The image is a multi-panel chart depicting projected electricity-generating capacity for zero-carbon and fossil fuel-based technologies across four different regions: China, Western Europe, India, and Africa, from 2020 to 2050. Each panel contains line graphs representing both types of technologies with area shading to show range variations.
- China - The graph shows a significant increase in zero-carbon technologies, represented by a blue line and shaded area expanding upwards from 2020 to 2050. The fossil fuel-based technologies, shown in black, remain relatively stable.
- Western Europe - The graph shows a moderate rise in zero-carbon technologies, with fossil fuel-based ones remaining relatively constant, similar to China's panel.
- India - The blue line for zero-carbon technologies shows strong growth, indicating a rising trend. Fossil fuel-based technologies shown in black remain mostly flat.
- Africa - Both zero-carbon technologies and fossil fuel-based technologies are projected to rise, but zero-carbon technologies are expected to increase at a faster rate.
Future energy use:
While no one has a crystal ball to predict where our future energy use may come from, estimates from both the EIA and IEA expect energy use to grow in the future. Most of this new electricity/energy production is expected to come from renewable or net-carbon zero sources.
3.5 Growth in Energy Demand
3.5 Growth in Energy DemandFor a long time, growth in the world and the U. S. energy consumption as a function of time, follow what is known as exponential function. Now it looks like we have switched to linear growth, but time will tell if this is a permanent change. The exponential increase is characterized as follows. The amount of change (increase in energy consumption) per unit time is proportional to the quantity (or consumption) at that time.
We can determine how long it takes for N0 to become 2N0 (twice its original number or double). That time period is called doubling time. After some mathematical steps it can be written as:
3.6 Energy Reserves and Resources
3.6 Energy Reserves and ResourcesFossil Fuels account for a large portion of the world's energy sources. These fossil fuels are non-renewable fuels with a finite lifetime. So, the question is: Will we have enough supply for future energy requirements?
The answer to this question depends on the quantity of fossil fuels we have in the ground. Energy sources that have been discovered but not produced cannot be easily measured. Trapped several feet below the surface, they cannot be measured with precision. There are several terms used to report the estimates of the energy resources. The most commonly used terms are “reserves” and “resources.”
- "Reserves" represent that portion of demonstrated resources that can be recovered economically with the application of extraction technology available currently or in the foreseeable future. Reserves include only recoverable energy.
- “Resources” represent that portion of the energy that is known to exist or even suspected to exist, irrespective of technical or economic viability. So reserves are a subset of resources.
| Source of Energy | U.S. Reserves | U.S. Annual Consumption | World Reserves | World Annual Consumption |
|---|---|---|---|---|
| Petroleum (billions of barrels) | 46.4 | 7.39 | 1650 | 35 |
| Natural gas (Wet) (Trillion Cu. Ft.) | 691 | 32.1 | 6922 | 132 |
| Coal (billions of short tons) | 469 | 0.51 | 1139 | 8.56 |
Coal
While much of the world has decreased their use of coal over the past two decades, both China and India have been increasing their use of coal. Push the play button below to show how coal usage has changed since 1900. The US was the #1 producer of coal until the 1980s, when China became #1. Since then, China's coal production has continued to increase with the exception of a small dip during COVID.
Data table for the Coal Production by Country graphic
Use the following link to downlaod the data (csv file) for the Coal Production by Country graphic.
As of 2025, total world proved recoverable reserves of coal were estimated at 1139 billion short tons. In many countries, such as the US, coal consumption has been decreasing. However, in China and India, coal use has increased significantly in the past decade.
Five countries have nearly 73% of the world's coal reserves:
- United States—28%
- Russia—18%
- China—13%
- Australia—9%
- India—7%
Petroluem
Based on data from OPEC (Oil Producing and Exporting Countries), the highest proved oil reserves including non-conventional oil deposits are shown in the graphic below. This shows which regions of the world have the highes amounts of oil reserves. You can interact with this figure to show the historical change of proven reserves or create different types of charts to separate by country.
Data Table for the Oil Proved Reserves chart
Use the following link to downlaod the data (csv file) for the Oil Proved Reserves graphic.
The top countries for oil resereves are Venezuela, Saudia Arabia, Canada Iran and Iraq. The US does have considerable about of oil resources and lands in the top 10 of oil producing countries.
Based on data from BP (British Petroleum), proved gas reserves were dominated by three countries: Russia, Iran and Qatar, which together held nearly half the world's proven reserves. According to the US CIA The World Factbook, the US has the 4th largest reserves of natural gas. Due to constant updates about the shale gas estimates, these are difficult to say with certainty.
How Long Will the Reserves Last?
How long these reserves do last depends on the rate at which we consume these reserves. For example, let’s assume that we have $100,000 in the bank (reserves) and if we draw 10,000 dollars every year (consumption) the reserve will last for 10 years (\$100,000/\$10,000 per year). However, in this case, we are assuming that we do not add any money to our deposit, and we do not increase our withdrawal.
This is generally not true in the case of life of an energy reserve. We may find new reserves, and our energy consumption or production can also increase. In the case of energy reserve, although we know that we might find new resources, we do not know how much we could find. But the consumption can be predicted with some accuracy based on the past rates.
Lifetime of current reserves at constant consumption
We can calculate the life of current petroleum reserves by dividing the current reserves by current consumption.
- At the current rate of consumption, the approximate lifetime of the world’s petroleum, natural gas, and coal reserves is 47.1 years, 52.4 years, and 133 years, respectively.
- At the current rate of consumption, the current U. S. petroleum, natural gas, and coal reserves will last approximately for 6.3 years, 21.5 years, and 919 years, respectively.
It is important to note that the entire U.S. petroleum consumption is not coming from the U.S. reserves because we import more than one half of the consumption. Because we import more than one half of the consumption, the petroleum reserves at the current rate will last about 11 years. If the consumption increases in the future, the life will be less. However, there is also a chance of adding more reserves with more exploration and discoveries. The increase in consumption can change depending on the price of petroleum and other alternative fuels. Likewise, us moving to electric cars and harnessing unconventional oil reserves can extend the lifetime of these reserves.
Therefore, these lifetimes are not carved in stone. It can be debated whether the U.S. reserves will last for 6 years or 10 years or even 20 years, or we may never run out! But there is increasing consensus that we must change our lifestyle. Even if we won't run out, the environmental consequences of continued use are pushing us to change anyway, but more on that later...
The R/P ratio can change from year to year, similar to our bank balance. We can add more if we make more or consume more. That changes the time we can draw on the balance.
Therefore, we must conserve, innovate (get more with less), or learn to live without these resources.
3.7 Current and Future Energy Sources of the USA
3.7 Current and Future Energy Sources of the USAThe current energy use in the US can be easily found by accessing the EIA US energy Facts Explained. Below there is some discussion about energy use in the US. While the values may change slightly from year to year, it is important to remember the trends and rough estimates for the values. For example, the latest chart from EIA might have renewables at 8.24 Quads and Petroleum at 38%. You will not be expected to remember the actual number, but roughly the amount. In the latest values from EIA, petroleum and natural gas account for 74% of the US’s total energy use. If we include coal, the fossil fuels account for over 80% of US energy use.
The chart below is a Sankey Diagram. This allows us to see where all of our energy use in the US is going. If we follow the blue box for Natural Gas, we can see we start with 33.4 Quads of Natural Gas. From that, 13.3 Quads of Natural Gas is used for Electricity Generation. Small amounts of Natural Gas go to Residential (home heating), Commercial and Industrial uses. Even a small amount of natural gas goes to transportation, which we will discuss more in lesson 12.
But lets go back to the Electricity Generation Block in orange. We can see a total of 32 Quads of energy goes into Electricity Generation. This comes from a variety of sources, actually a little bit from every sources on the left hand side. Of that 32 Quads coming into the Electricity generation, only 13.3 Quads leaves as electricity. Where does the rest of that energy go? Follow the Gray line to the right hand side.
Are you surprised? Of all the energy used in the US, approximate 65% of this is Rejected Energy! Only about 35% of our energy consumption in the US goes to useful energy use. We will discuss why in Lesson 4 on energy efficiency.

Image description: Estimated U.S. Energy Consumption in 2023
The image is a Sankey diagram illustrating the estimated U.S. energy consumption in 2023, totaling 93.6 quadrillion BTUs (Quads). It shows the flow of energy from various sources to different sectors and highlights the amount of energy that is ultimately rejected or used. Energy sources are color-coded and include solar (yellow, 0.89 Quads), nuclear (red, 8.1 Quads), hydro (blue, 0.82 Quads), wind (purple, 1.5 Quads), geothermal (brown, 0.12 Quads), natural gas (light blue, 33.4 Quads), coal (gray, 8.17 Quads), biomass (light green, 5 Quads), and petroleum (dark green, 35.4 Quads). The energy flows into categories such as electricity generation (orange, 32 Quads), residential (pink, 11.3 Quads), commercial (pink, 9.3 Quads), industrial (pink, 26.1 Quads), and transportation (dark green, 28 Quads). Finally, the diagram shows rejected energy (gray, 61.5 Quads) and energy services (gray, 32.1 Quads). The logo of Lawrence Livermore National Laboratory is in the top right corner.
[Transcribed text]
Source: LLNL October, 2024. Data is based on DOE/EIA SEDS (2024). If this information or a reproduction of it is used, credit must be given to the Lawrence Livermore National Laboratory and the Department of Energy, under whose auspices the work was performed. Distributed electricity represents only retail electricity sales and does not include self-generation. EIA reports consumption of renewable resources (i.e., hydro, wind, geothermal and solar) for electricity in BTU-equivalent values by assuming a typical fossil fuel plant heat rate. The efficiency of electricity production is calculated as the total retail electricity delivered divided by the primary energy input into electricity generation. End use efficiency is estimated as 65% for the residential sector, 65% for the commercial sector, 49% for the industrial sector, and 21% for the transportation sector. Totals may not equal sum of components due to independent rounding. LLNL-MI-410527
Fossil Fuels
Fossil Fuels still remain a major component of energy use in the US. As shown in the figure above, over 80% of US energy use is produced from fossil fuels. The three fossil fuels are coal, oil and natural gas.
As a result of innovations in oil and gas extraction, U.S. imports have dropped considerably. While the US still consumes a lot of oil for transportation, a lot more oil has been discovered and produced domestically.

Image description: U.S. energy net imports by major source, 1950-2023
The image is a line graph titled "U.S. energy net imports by major source, 1950-2023," measured in quadrillion British thermal units. The horizontal axis represents the years from 1950 to 2023, while the vertical axis measures energy quantities ranging from -10 to 25 quadrillion British thermal units. There are four colored lines, each representing a different energy source. The brown line shows crude oil imports, peaking around 2005 at over 15 units before declining to approximately 2 units by 2023. The maroon line indicates petroleum products, with fluctuations around 5 to 10 units until it declines to negative values in recent years. The blue line for natural gas remains relatively stable from the 1970s, eventually dipping below zero after 2000. The black line represents coal and coal coke, consistently near zero, slightly fluctuating around the mid-20th century. Each energy source is identified with corresponding colors in the legend below the graph. At the bottom left, the "eia" logo is visible, along with a text box citing the data source.
Looking at the U.S. Energy Profile, It can be seen from the imports profile that the US Crude oil imports have significantly reduced between 2005 and 2019 from a peak of 25 Quadrillion BTUs. Another significant change that can be noted is that the US is now exporting natural gas (below zero on the y axis) instead of importing it. Although crude oil is imported, US exports finished petroleum products resulting in less net imports. As a matter of fact, US total energy exports exceeded the imports in 2019 since 1950.
The top five countries (sources) of US total petroleum in 2019 were Canada (49%), Mexico (7%), Saudi Arabia (6%), Russia (6%) and Columbia (4%).
The U.S. also ranks:
- first in worldwide reserves of coal;
- sixth in worldwide reserves of natural gas;
- eleventh in worldwide reserves of oil.
US Energy Consumption by Source and the chart of the US Energy consumption by source and user sector shows each energy source and the amount of energy it supplies in British thermal units (BTU). Petroleum is the leading source of energy in the US in 2019 with 36.72 quadrillion BTUs. Next is natural gas with 32.10 quadrillion BTUs. Coal supplies 11.31 quadrillion BTUs of energy. Renewable energy and nuclear power are responsible for 11.46 and 8.46 quadrillion BTUs respectively. Of the total petroleum consumption, 72% is used for transportation and another 23% is used by the industrial sector. Similarly, 35% of the natural gas (largest fraction) is used for power generation. On the other hand, 76% of the residential and commercial energy needs are met by natural gas. The actual percentages are not required to be memorized but answers to the questions such as: Which fuel is most used by power plants for power generation? Which sector uses petroleum the most? Approximately what fraction of the electricity is generated by renewable energy? (10, 25, 50 or 90) What is the primary purpose of coal use? etc. need to be answered.
US Energy Consumption by Source and Sector
The graph shows how dependent the U.S. is on our petroleum supply, as it accounts for almost 37% of our energy. Our next two highest sources of energy, like petroleum, are non-renewable and include natural gas and coal. Only about 11% of our energy comes from renewable energy sources such as wood and water (hydroelectricity). According to Energy Information Administration, US renewable energy consumption surpassed coal for the first time in over 130 years in 2019. Of the 4.12 trillion kWh of electricity generated in the US, 38% was from natural gas, coal accounted for about 23% and nuclear adding another 20%. Renewable sources contributed to 17% of the total electricity generated.

Image description: U.S. Energy Consumption by Source and Sector, 2024
The flow diagram illustrates the U.S. energy consumption by source and sector for the year 2024, measured in quadrillion British thermal units (Btu). On the left, the energy sources are listed with corresponding percentages: petroleum (35.3, 38%), natural gas (34.2, 36%), renewable energy (8.6, 9%), nuclear (8.2, 9%), and coal (7.9, 8%), totaling 94.2 quadrillion Btu. The lines connect these sources to various end-use sectors on the right: transportation (28.1, 38%), industrial (26.1, 35%), residential (11.2, 15%), and commercial (9.5, 13%) with a total of 74.9 quadrillion Btu. In the center, a section is dedicated to the electric power sector, splitting into electricity sales (13.5, 41%) and energy losses (19.3, 59%), with a total of 32.8 quadrillion Btu. Different colored lines represent energy flow from each source to sectors, indicating the percentage allocation.
In 2023, fossil fuels made up 84% of total U.S. energy consumption, the lowest fossil fuel share. The greatest growth in renewables over the past decade has been in solar and wind electricity generation. Liquid biofuels have also increased in recent years, contributing to the growing renewable share of total energy consumption. 2020 was the first year that renewables surpassed coal consumption in the U.S.
US Energy Consumption Over Time

Image description: U.S. Primary Energy Consumption
The image is a line graph displaying energy consumption trends in the United States from 1950 to 2024, measured in quadrillion British thermal units (Btu). The horizontal axis represents years from 1950 to 2024, while the vertical axis represents energy consumption in quadrillion Btu, ranging from 0 to 50. Five colored lines represent different energy sources. The green line indicates petroleum consumption peaking around 40 quadrillion Btu in the early 2000s. The brown line, representing natural gas consumption, steadily rises, nearly intersecting petroleum consumption in 2020 and again in 2024. The blue line shows coal consumption, peaking around 1990 but sharply declining thereafter. The red line, depicting total renewable energy consumption, shows a gradual increase. The yellow line, representing nuclear electric power, rises sharply around 1970 and stabilizes. A legend at the bottom specifies the color coding for each energy type.
The most significant decline in recent years has been coal: US energy consumption from coal was at a high of 37% in 1950 to only 9% in 2023. Biomass, which includes wood as well as liquid biofuels like ethanol and biodiesel, remain relatively flat, as wood use declines and biofuel use increases slightly. In contrast, wind and solar are among the fastest-growing energy sources in the projection, ultimately surpassing biomass and nuclear.
US Energy Consumption History
The plot of US energy consumption shows the relative amounts of each type of energy that was consumed for each year. The history of the energy consumption profile of the United States indicates that petroleum makes the largest part of the energy demand over the past seven decades. Natural gas has taken the second over the past decade with the production of gas from shale. Coal has been replaced by renewable energy and natural gas for electricity generation. Among the renewable energy sources, biomass has the larger share followed by wind energy. Wind energy and solar energy are the fastest growing energy sources.


Answers to the following questions need to be looked for in the material presented above.
- Of all the renewable energy sources, which renewable source is used most?
- Which of the renewable sources is used most for transportation?
- Approximately what fraction of the electricity is generated by nuclear energy? (10, 20, 50 or 90)
Electricity
Electricity demand is expected to grow in the future. Visit the webpage US electricity explained - Sources and profiles
Examine for:
- Sources of U.S. electricity generation
- What are the notable changes in the major sources for electricity generation between 1950 and today?
- Role of renewable energy in the electricity generation.
Growth in electricity use for in the residential and commercial sectors is partially offset by improved efficiency. However, increases in demand from electric cars and data centers are causing a expected increase in electric demand. In 2023, Fossil Fuels accounted for 60% of US electricity generation, with natural gas accounting for most of that.
Most capacity additions over the next 10 years are expected to be renewables.
Did You Know?
Demand-side management programs address efficiency. By being more efficient, we can do more with less, and then reduce the demand for energy. This can include changing the time when higher use items are used, like dishwashers and EV charging to times when the demand on the grid is less.
3.8 Conclusion: Energy Supply and Demand
3.8 Conclusion: Energy Supply and DemandLesson 3 Review
Throughout this lesson, we've traced humanity's energy journey: from biomass-dependent societies before 1800, through the fossil-fueled explosion of the Industrial Revolution, to today's complex global system where over 80% of energy still comes from oil, coal, and natural gas. We've seen how energy use per person varies dramatically by country—and how factors like efficiency, climate, economic structure, and policy shape those differences far more than income alone.
Most importantly, we've looked ahead. The International Energy Agency presents us with three distinct pathways:
- Current Policies: ~3°C warming by 2100
- Stated Policies: ~2.5°C warming if promises are kept
- Net Zero by 2050: Limiting warming to ~1.65°C through rapid clean energy transition
The data is clear: global energy demand will continue to rise, especially in developing economies. But how we meet that demand is the defining question of our century. Renewable energy and electrification are accelerating. Nuclear power is being reconsidered. Efficiency gains offer immediate impact. And every nation—and every individual—has a role to play.
Your takeaway: Understanding energy isn't just about memorizing statistics. It's about recognizing connections—between history and innovation, between policy and personal choice, between today's consumption and tomorrow's climate. As you move forward, keep asking: What kind of energy future do we want to create—and what will it take to get there?
Lesson 4: Energy Efficiency
Lesson 4: Energy EfficiencyThe links below provide an outline of the material for this lesson. Be sure to carefully read through the entire lesson before returning to Canvas to submit your assignments.
4.1 Lesson 4 Introduction
4.1 Lesson 4 IntroductionWelcome to Lesson 4!
Every day, we rely on devices that convert energy from one form to another: your phone transforms electrical energy into light and sound, a car engine turns chemical energy from gasoline into motion, and a power plant converts heat from fuel or fission into the electricity that powers your dorm. But here's a critical question: how much of the original energy actually does the work we want? The answer lies in the concept of energy efficiency—a measure of how well a system converts input energy into useful output. In this lesson, we'll explore why no conversion is perfect, especially when thermal energy (the random motion of molecules) is involved, and how fundamental laws of physics set hard limits on what engineers can achieve.
In this lessons, we will look at the operating principle of a heat engine. A heat engine is a device that converts heat to work. Particularly, automobiles are all heat engines, and they are notoriously inefficient. We will see examples and calculations of why these automobiles are notoriously inefficient and learn how to calculate the theoretical maximum efficiency of any heat engine using the Carnot efficiency. For these calculations, we must make sure our temperatures are in the Kelvin, an absolute temperature scale.
We can also calculate the efficiency of a whole process from the step efficiencies. For example, if it involves 2 or 3 steps like in a relay race. You know you have 3 or 4 players taking the baton and one lap by each of the athletes. So, what is the overall or team efficiency if we know the efficiency of each of those steps or the efficiency of each of those players? This multiplicative effect explains why small improvements at each stage can lead to big gains in total performance—and why understanding these principles is essential for designing sustainable, high-performance technology. By the end of this lesson, you'll be able to analyze energy systems critically and appreciate why efficiency isn't just a number—it's a bridge between physics and the future of energy.
Lesson 4: Learning Objectives
Upon completing this lesson, you should be able to:
- define and calculate efficiency of an energy conversion device;
- explain why energy conversion devices cannot achieve 100% efficiency
- convert temperatures between Celsius and Kelvin;
- explain operating principles of a heat engine; and
- calculate overall efficiency from step efficiencies.
See the calendar in Canvas for due dates/times.
Questions?
If you have any questions, please post them to the General Course Questions forum in located in the Discussions tab in Canvas. I will check that discussion forum daily to respond. While you are visiting the discussion board, feel free to post your own responses to questions posted by others - this way, you might help a classmate!
4.2 Energy Conversion Devices
4.2 Energy Conversion DevicesIn the first lesson, we saw that energy can be transformed from one form to another, and during this conversion, all the energy that we put into a device comes out. However, all the energy that we put in may not come out in a useful form.
For example, we put electrical energy into a bulb and the bulb produces light (which is the desired form of output from a bulb), but we also get heat from the bulb (undesired form of energy from an electric bulb).

Text description of the Electrical energy conversion to light and heat image.
The image shows a chalkboard with a diagram illustrating the transformation of electrical energy. On the left side, the words "Electrical Energy" are written in yellow chalk. An arrow points right to a simple outline of a light bulb in the center, suggesting the conversion process. Two arrows extend from the light bulb to the right, each labeled; the upper arrow points to the word "Light," and the lower arrow points to "Heat."
Therefore, energy flow into and out of any energy conversion device can be summarized in the diagram below:
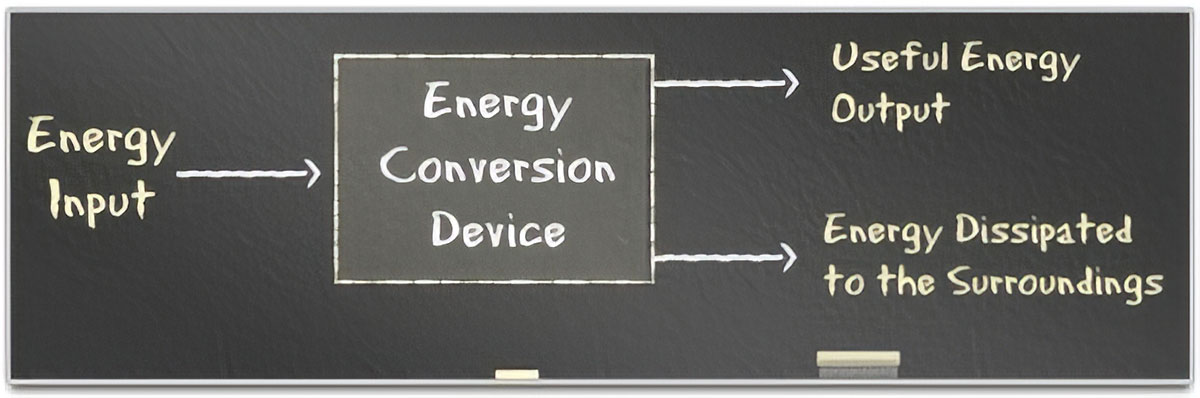
Text description of the Energy Flow Diagram for an Energy Conversion Device image.
The image is a diagram on a dark gray background resembling a chalkboard. The left side of the image shows the words "Energy Input" with an arrow that points towards a large rectangular box labeled "Energy Conversion Device." From the right side of the box, two arrows extend; one labeled "Useful Energy Output," and the other labeled "Energy Dissipated to the Surroundings."
When all forms of energy coming out of an energy conversion device are added up, it will be equal to the energy that is put into a device. Energy output must be equal to the input. This means that energy can not be destroyed or created. It can only change its form.
In the case of an electric bulb, the electrical energy is converted to light and heat.
The amount of electrical energy put into a bulb = the amount of light energy (desirable form) plus the heat energy that comes out of the bulb (undesirable form).
Self Check
Instructions: Identify the useful energy output(s) and undesirable energy output(s) in the energy conversion devices below. Enter your answers in the fields provided, and click the "Check" button to check your work.
Energy Conversion Self Check
Activity Description: Energy Conversion Self Check
Self Check: Energy Conversion Devices
For each of the following examples, determine the types of useful energy and undesired energy for the given energy converter.
Example 1: Lawnmower with a chemical energy input. (Hint: How do you know when your neighbor is mowing the lawn?)
Example 2: Car with a chemical energy input. (Hint: Think about mufflers, tires, and generator.)
Example 3: Television with an electrical energy input. (Hint: Have you ever felt the back of your TV after it has been on for a few hours?)
Example 4: Desktop computer with an electrical energy input. (Hint: What’s in your tower and why?)
Answers:
Example 1: The useful energy for a lawnmower is mechanical, while the undesired energy is thermal (heat) and radiation (noise).
Example 2: The useful energy for a car is mechanical, while the undesired energy is thermal or heat (tail pipe).
Example 3: The useful energy for a TV is radiation (light and sound) and the undesirable energy is heat (from circuits).
Example 4: The useful energy for a computer is radiation (light and sound) and the undesirable energy is heat (circuits – electrons moving through system) and mechanical (fan for cooling).
4.3 Efficiency of Energy Conversion Devices
4.3 Efficiency of Energy Conversion DevicesEfficiency is the useful output of energy. We can mathematically define energy efficiency as the ratio of useful energy output to total energy output. This will give us a value between 0-1. To get this as a percentage, you should multiply by 100%. To calculate efficiency, the following formula can be used:
This simple yet powerful equation allows us to express efficiency as a percentage, where 100% would represent a theoretically perfect device with no energy losses—a condition that, as we will explore, is impossible to achieve in practice due to the fundamental laws of thermodynamics.
NOTE: You can never have energy efficiency over 100%. If you get a value above 1 by using the formula above, make sure you have the USEFUL energy value on the top and TOTAL energy output on the bottom of the equation.
Example 1
An electric motor consumes 100 watts (a joule per second (J/s)) of power to obtain 90 watts of mechanical power. Determine its efficiency.
Solution:
Input to the electric motor is in the form of electrical energy, and the output is mechanical energy.
Using the efficiency equation:
Or efficiency is 90%.
Caution!
This is a simple example because both variables are measured in Watts. If the two variables were measured differently, you would need to convert them to equivalent forms before performing the calculation.
Test Yourself #1
An electric motor consumes 91 watts (a joule per second (J/s)) of power to obtain 83 watts of mechanical power. Determine its efficiency.
- Click to see the solution to Test Yourself #1
Solution:
Useful Energy = 83 Watts
Total Energy = 91 Watts
Efficiency = useful / total
= 83/91
= 0.912
= 91.2%
What if the units are not the same? You need to have the same units in order to determine efficiency.
Example 2
The United States' power plants consumed 39.5 quadrillion Btus of energy and produced 3.675 trillion kWh of electricity. What is the average efficiency of the power plants in the U.S.?
Solution:
Total Energy input = 39.5 x 10¹⁵ Btus and the Useful energy output is 3.675 x 10¹² kWh. Recall that both units have to be the same. So we need to convert kWh into Btus. Given that 1 kWh = 3412 Btus:
Step 1
Given:
Therefore:
Step 2
Use the formula for efficiency.
Test Yourself #2
The United States power plants consumed 35 quadrillion Btus of energy and produced 3 trillion kWh of electricity. What is the average efficiency of the power plants in the U.S.?
- Click to see the solution for Test Yourself #2
Solution:
The units don’t match, so you need to convert to the same units and we know that 1 kWh = 3,412 Btus.
Useful Energy Output = 3 trillion kWh
= 3 x 1012 kWh x 3,412 Btus / 1 kWh
= 10,236 x 1012 BtusTotal Energy Input = 35 quadrillion Btus
Efficiency = Useful Energy Output / Total Energy Input
= (10,236 x 1012) / (35 x 1015)
= 0.2925
= 29.25%
Energy Efficiencies
Energy efficiencies are not 100%, and sometimes they are pretty low. The table below shows typical efficiencies of some of the devices that are used in day to day life:
| Device | Efficiency |
|---|---|
| Electric Motor | 90 % |
| Home Gas Furnace | 95 % |
| Home Oil Furnace | 80 % |
| Home Coal Stove | 75 % |
| Steam Boiler in a Power Plant | 90 % |
| Overall Power Plant | 36 % |
| Automobile Engine (ICE) | 25 % |
| Electric Bulb: Incandescent | less than 10 % |
| Electric Bulb: Fluorescent | 60 % |
| Electric Bulb: LED | 90 % |
From our discussion on national and global energy usage patterns in Lesson 3, we have seen that:
- about 41% of the US energy is used in power generation;
- about 38% of the US energy is used for transportation.
Yet the energy efficiency of a power plant is about 35%, and the efficiency of automobiles is about 25%. Thus, over 62% of the total primary energy in the U.S. is used in relatively inefficient conversion processes.
Why are power plant and automobile design engineers allowing this? Can they do better?
There are some natural limitations when converting energy from heat to work.
4.4 Measuring Thermal Energy
4.4 Measuring Thermal EnergyThermal energy is energy associated with random motion of molecules. It is indicated by temperature, which is the measure of the relative warmth or coolness of an object.
A temperature scale is determined by choosing two reference temperatures and dividing the temperature difference between these two points into a certain number of degrees.
The two reference temperatures used for most common scales are the melting point of ice and the boiling point of water.
- On the Celsius temperature scale, or centigrade scale, the melting point is taken as 0°C and the boiling point as 100°C, with the difference between them being equal to 100 degrees.
- On the Fahrenheit temperature scale, the melting point is taken as 32°F and the boiling point as 212°F, with the difference between them being equal to 180 degrees.
It is important to realize, however, that the temperature of a substance is not a measure of its heat content, but rather, the average kinetic energy of its molecules resulting from their motions.
Try This!
Below is a 6-ounce cup with hot water and a 12-ounce cup with hot water at the same temperature.
- Do they have the same heat content?
- Do they have the same amount of energy?
Instructions: Click the play button to see what is happening in the two cups. Think about your answer to the two questions, and then click the video description link below the video to check your answer. (Note: The animation has no audio.)
Video: Measuring Thermal Activity (0:19)
Video Description: Measuring Thermal Activity
A six ounce cup and a twelve ounce cup are both filled with 85 degree water.
Conclusion: They do NOT have the same heat content or the same amount of energy. Since water in the two cups is at the same temperature, the average kinetic energy of the molecules in the cups is the same; however, the 12 ounce cup has twice as many molecules when compared with the 6 ounce cup and thus has the greater total motion or heat energy.
4.5 Kelvin Scale
4.5 Kelvin ScaleWhen water molecules freeze at 0°C, the molecules still have some energy compared to ice at -50°C. In both cases, the molecules are not moving, so there is no heat energy.
So what is the temperature at which all the molecules have absolutely zero energy? A temperature scale can be defined theoretically, for which zero degree corresponds to zero average kinetic energy. Such a point is called absolute zero, and such a scale is known as an absolute temperature scale. At absolute zero, the molecules do not have any energy.
The Kelvin temperature scale is an absolute scale having degrees the same size as those of the Celsius temperature scale. Therefore, all the temperature measurements related to energy measurements must be made on Kelvin scale.
4.6 Heat Engines
4.6 Heat EnginesAny device that converts thermal energy into mechanical energy—like a car engine, a jet turbine, or a coal-fired power plant—is called a heat engine. These machines work by taking in high-temperature heat (usually from burning fuel or nuclear reactions), using part of that energy to do useful work—such as turning wheels or generating electricity—and releasing the remaining energy as lower-temperature waste heat, often into the air or a nearby body of water. This "exhaust" isn't a flaw in engineering; it's a fundamental requirement of how nature works. Because heat naturally flows from hot to cold, a heat engine can only extract work while that flow is happening—and it can never capture all the energy in the process.

Text description of the Energy Conversions in an Automobile image.
The image is a blackboard with a diagram illustrating a process flow. Three rectangles are aligned horizontally across the board. The first rectangle on the left contains the text "Chemical Energy," the middle rectangle has the text "Thermal Energy," and the rectangle on the right displays "Mechanical Energy." Arrows connect the rectangles, showing a flow from left to right, indicating a progression from chemical to thermal to mechanical energy.
This limitation is described by the Second Law of Thermodynamics, which tells us that no heat engine can be 100% efficient. Efficiency is defined as the ratio of useful work output to the total heat energy input, and it's fundamentally limited by the temperatures of the heat source and the environment. In fact, the maximum possible efficiency (called the Carnot efficiency) depends directly on the absolute temperatures—measured in Kelvin—of the hot and cold reservoirs: the bigger the temperature difference, the more work you can extract. For example, a car engine operating between ~1500 K (combustion) and ~300 K (outside air) has a theoretical maximum efficiency around 80%, but real-world factors like friction and incomplete combustion bring actual efficiency down to just 20–30%. Power plants, which can operate at more controlled high temperatures, often reach 35–60% efficiency.
Understanding heat engines helps explain why energy conservation matters and why engineers constantly seek better materials and designs. Waste heat isn't just "lost"—it affects fuel economy, emissions, and even local ecosystems when warm water is discharged from power plants. By studying these systems, you'll see how core scientific principles—like absolute temperature, energy conservation, and entropy—directly shape the technology that powers our world. As you move forward in physics or engineering, you'll learn to analyze these cycles quantitatively, but for now, remember this key idea: heat engines don't create energy; they redirect it, and nature always takes a share.

Text description of the Heat Engine image.
The image depicts a schematic diagram of a heat engine. It consists of a gradient background transitioning from red, labeled "High T" at the top to yellow, labeled "Low T" at the bottom, representing temperature change. The top of the diagram is labeled "Heat" with a black arrow pointing downwards towards a yellow rectangular box labeled “HEAT ENGINE.” From this box, there is a black arrow pointing right to a label “Work.” Below the "Heat Engine" box is a gray arrow pointing downwards towards the bottom of the diagram labeled "(Waste) Heat." The arrows and labels illustrate the flow and conversion of heat energy within the engine.
4.7 The Carnot Efficiency
4.7 The Carnot EfficiencyA general expression for the efficiency of a heat engine can be written as:
We know that all the energy that is put into the engine has to come out either as work or waste heat. So work is equal to Heat at High temperature minus Heat rejected at Low temperature. Therefore, this expression becomes:
Where, QHot = Heat input at high temperature and QCold= Heat rejected at low temperature. The symbol (Greek letter eta) is often used for efficiency this expression can be rewritten as:
The above equation is multiplied by 100 to express the efficiency as percent.
French Engineer Sadi Carnot showed that the ratio of QHighT to QLowT must be the same as the ratio of temperatures of high temperature heat and the rejected low temperature heat. So this equation, also called Carnot Efficiency, can be simplified as:
Note: Unlike the earlier equations, the positions of Tcold and Thot are reversed.
The Carnot Efficiency is the theoretical maximum efficiency one can get when the heat engine is operating between two temperatures:
- The temperature at which the high temperature reservoir operates ( THot ).
- The temperature at which the low temperature reservoir operates ( TCold ).
In the case of an automobile, the two temperatures are:
- The temperature of the combustion gases inside the engine ( THot ).
- The temperature at which the gases are exhausted from the engine ( TCold ).
Below is a table showing two temperature scales. The scale labeled "HOT," shows the range of temperatures for the combustion of gases in a car engine. The scale labeled "COLD," shows the range of temperatures at which gases are exhausted from the car engine.

Instructions: Look carefully at the efficiency numbers in the body of the table. How do the Hot and Cold temperatures' effect on the efficiency.
| Hot Columns Cold Rows | Hot 500°C | Hot 600°C | Hot 700°C | Hot 800°C | Hot 900°C | Hot 1,000°C | Hot 1,500°C | Hot 2,000°C |
|---|---|---|---|---|---|---|---|---|
| Cold 150°C | 45 | 52 | 57 | 61 | 64 | 67 | 76 | 81 |
| Cold 125°C | 49 | 54 | 59 | 63 | 66 | 69 | 78 | 82 |
| Cold 100°C | 52 | 57 | 62 | 65 | 68 | 71 | 79 | 84 |
| Cold 75°C | 55 | 60 | 64 | 68 | 70 | 73 | 80 | 85 |
| Cold 50°C | 58 | 63 | 67 | 70 | 72 | 75 | 82 | 86 |
| Cold 25°C | 61 | 66 | 69 | 72 | 75 | 77 | 83 | 87 |
Answer the following questions based on the information in the Car Engine Efficiency table above.
Example
For a coal-fired utility boiler, the temperature of high pressure steam (Thot)would be about 540°C and Tcold, the cooling tower water temperature, would be about 20°C. Calculate the Carnot efficiency of the power plant:
Solution:
Carnot efficiency depends on high temperature and low temperatures between which the heat engine operates. We are given both temperatures. However, the temperatures need to be converted to Kelvin:
Practice
A solar thermal power plant uses concentrated sunlight to heat a working fluid. The high-temperature reservoir reaches 450°C, while the cooling system maintains the low-temperature reservoir at 90°C. Calculate the Carnot efficiency of this power plant. .
Step 1
Convert the high and low temperatures from Celsius to Kelvin:
Step 2
Determine the efficiency using the Carnot efficiency formula:
From the Carnot Efficiency formula, it can be inferred that a maximum of 49.8% of the fuel energy can go to generation. To make the Carnot efficiency as high as possible, either Thot should be increased or Tcold (temperature of heat rejection) should be decreased.
4.8 Examples of Heat Engines
4.8 Examples of Heat EnginesLet’s look at an example of how temperature differences are used to generate power. Power plants convert chemical energy into electrical power. Here is a video overviewing the operation of a geothermal energy system, a classic thermal power generation plant.
Transcript: Energy 101: Geothermal Energy
[Music]
Narrator: You may have relaxed in a natural hot springs pool.
Or seen the Old Faithful geyser blasting hot water into the air in yellowstone national park. But have you ever thought of where all that heat comes from?
Well, it comes from deep beneath the surface of the earth -- and it's called geothermal energy...
And we can use it to generate clean, renewable electricity. Ok, here's how geothermal works.
Heat from the Earth's crust warms water that has seeped into underground reservoirs. When water becomes hot enough, it can break through the earth's surface as steam or hot water. This usually happens where the earth's crust or 'plates' meet and shift.
In the past, taking advantage of geothermal energy was limited to areas where hot water flowed near the surface. But, as geothermal technologies advance, we can leverage even more of these natural renewable energy sources. Engineers have developed a few different ways to produce power from geothermal wells drilled into the ground.
Have a look at this. It's a dry steam geothermal power plant and it's the most common type of geothermal technology used today... Underground steam flows directly to a turbine to drive a generator that produces electricity. Pretty straightforward.
Another geothermal technology is called a flash steam power plant. A pump pushes hot fluid into a tank at the surface, where it cools. As it cools, the fluid quickly turns into vapor-- or "flash" vaporizes. The vapor then drives a turbine -- and powers a generator.
A binary cycle plant works differently.
It uses two types of fluid. Hot fluid from underground heats a second fluid, called a heat transfer fluid, in a giant heat exchanger. The second fluid has a much lower boiling point than the first fluid, and so it 'flashes' into vapor at a lower temperature. When the second fluid flashes... It spins a turbine that drives a generator.
The environmental benefits of this clean, round-the-clock renewable energy source are substantial: low emissions, small physical footprint, and minimal environmental impact. The few byproducts that can come up are often re-injected underground.
Geothermal energy can also help recycle wastewater. In California, wastewater from the city of Santa Rosa is injected into the ground to generate more geothermal energy.
Some plants do produce solid waste, but that solid waste may contain minerals that we can remove and sell... Which lowers the cost of this energy source.
The U.S. Geological Survey estimates that untapped geothermal resources in the United States, if developed, could supply the equivalent of 10% of today's energy needs. In fact, electricity generated by geothermal energy already provides about 60% of the power along the northern California coast...
From the Golden Gate Bridge to the Oregon state line.
Geothermal energy...helping to push America toward energy independence, and a clean, renewable way to meet our growing energy demands...
Below are two temperature scales. The scale labeled "HOT," shows the range of temperatures for the combustion of gases in a power plant. The scale, "COLD," shows the range of temperatures at which gases are exhausted from the power plant.

Text description of the Power Plant diagram.
The diagram is labeled "Power Plant." Below the label are two horizontal lines representing temperature scales, labeled "HOT" and "COLD." The "HOT" scale is at the top in dark red, starting at 350°C and marked at 400, 500, 600, 700, 800, 900, and ending at 1000. The "COLD" scale is in blue below, marked at 100°C, 200°C, and 300°C.
Look carefully at the efficiency numbers in the body of the table. How do the Hot and Cold temperatures' effect on the efficiency.
| Hot Columns Cold Rows | Hot 350°C | Hot 400°C | Hot 500°C | Hot 600°C | Hot 700°C | Hot 800°C | Hot 900°C | Hot 1,000°C |
|---|---|---|---|---|---|---|---|---|
| Cold 300°C | 8 | 15 | 26 | 34 | 41 | 47 | 51 | 55 |
| Cold 250°C | 16 | 22 | 32 | 40 | 46 | 51 | 55 | 59 |
| Cold 200°C | 24 | 30 | 39 | 46 | 51 | 56 | 60 | 63 |
| Cold 150°C | 32 | 37 | 45 | 52 | 57 | 61 | 64 | 67 |
| Cold 100°C | 40 | 45 | 52 | 57 | 62 | 65 | 68 | 71 |
4.9 Overall Efficiency
4.9 Overall EfficiencyCalculating Overall Efficiency
Using the energy efficiency concept, we can calculate the component and overall efficiency:
Here the electrical energy is given in Wh and Chemical Energy in Btus. So Wh can be converted to Btus knowing that there are 3.412 Wh in a Btu.
This overall efficiency can also be expressed in steps as follows:
Applying this method to the above power plant example:
It can be seen that the overall efficiency of a system is equal to the product of efficiencies of the individual subsystems or processes. What is the implication of this?
Steps of Overall Efficiency
Previously, we examined the efficiency of individual components, such as an automobile engine or a power plant. However, to understand true energy utilization, we must consider the entire chain of energy transformations. This chain ranges from extracting raw resources to the final use of energy, such as light from a bulb or sound from a stereo.
The process involves five key steps:
- Production: Mining the coal.
- Transportation: Moving coal to the power plant.
- Generation: Converting coal into electricity.
- Transmission: Sending electricity through power lines.
- End Use: Converting electricity into light or sound.
Tracking the Energy Flow To calculate the cumulative efficiency, let us trace the energy flow starting with 100 units of energy stored in the ground (measured in BTUs).
- Mining (95% Efficiency): Extracting coal requires energy to operate equipment. For every 100 units in the ground, only 95 units reach the surface.
- Transportation: Trucks consume fuel to move the coal. By the time the coal reaches the power plant, the energy value drops from 95 units to approximately 90 units.
- Electricity Generation (33% Efficiency): Power plants are roughly 33% efficient. When 90 units of coal energy enter the plant, only 30 units emerge as electricity.
- Transmission: High-voltage lines transport electricity to the user. While there are minor losses here, we will estimate that approximately 30 units reach the home.
- End Use (5% Efficiency): Traditional light bulbs are notoriously inefficient, operating at about 5% efficiency. Of the 30 units entering the bulb, only 1.5 units are converted into actual light.
Conclusion We started with 100 units of energy in the ground and ended with 1.5 units of light. Therefore, the overall efficiency is 1.5% (1.5 divided by 100).
This reveals a critical reality: to obtain 1.5 units of useful light, we extract 100 units from natural resources. Along the way, approximately 98.5 units of energy are lost as waste heat or friction during the various conversion processes.
Efficiency of a Light Bulb
If the efficiency of each step is known, we can calculate the overall efficiency of production of light from coal in the ground. The table below illustrates the calculation of overall efficiency of a light bulb.
| Step | Step Efficiency | Cumulative Efficiency or Overall Efficiency |
|---|---|---|
| Extraction of Coal | 96% | 96% |
| Transportation | 98% | 94% = (0.96 x 0.98) * 100 |
| Electricity Generation | 35% | 33% = (0.94 x 0.35) * 100 |
| Transmission of Electricity | 95% | 31% = (0.33 x 0.95) * 100 |
| Lighting: Incandescent Bulb | 5% | 1.6 % = (0.31 x 0.05) * 100 |
| Lighting: Fluorescent Bulb | 60% | 18 % = (0.31 x 0.60) * 100 |
Efficiency of an Automobile
A similar analysis on automobile efficiency is shown in the Figure below.

Text description of the Overall Automobile Efficiency image.
The image illustrates a flowchart titled "Overall Automobile Efficiency," depicting various stages in the lifecycle of automobile energy usage. The flowchart consists of six main stages, each represented by a distinct black and white icon.
- Production: An oil rig pumping oil, symbolizing the extraction phase.
- Transportation: A pipeline with flowing arrows indicates the movement of crude oil.
- Refining: A factory with smokestacks emits plumes of smoke, representing the refining process.
- Distribution: A fuel pump is shown, highlighting the distribution stage of refined fuel.
- Engine: Icons suggest acceleration and deceleration with associated mechanics, detailing the engine's efficiency.
- Transmission: Diagrams with arrows demonstrate the power transmission process in the automobile.
Each stage is connected with bold black arrows, illustrating the flow of energy from one phase to the next.
The table below shows that only about 10% of the energy in the crude oil in the ground is in fact turned into mechanical energy moving people.
| Step | Step Efficiency | Cumulative Efficiency or Overall Efficiency |
|---|---|---|
| Extraction of Crude | 96% | 96% |
| Refining | 87% | 84% |
| Transportation | 97% | 81% |
| Engine | 25% | 20% |
| Transmission | 50% | 10% |
4.10 Conculsions
4.10 ConculsionsIn this lesson, you explored one of the most fundamental—and humbling—principles in energy science: no energy conversion is perfect. Every device that transforms energy, from your smartphone to a power plant, loses some portion of its input to waste heat, friction, or other irreversibilities. Here's a synthesis of the core concepts you've mastered:
Heat Engines and the Limits of Efficiency
- Heat engines (like automobile engines, power plants, and even your body) convert thermal energy into mechanical work—but they must reject waste heat to a colder reservoir. This isn't an engineering flaw; it's a consequence of the Second Law of Thermodynamics.
- Carnot efficiency defines the theoretical maximum efficiency for any heat engine operating between two temperatures
Where:
- Kelvin is non-negotiable: Because Carnot efficiency depends on a ratio of temperatures, you must use the absolute Kelvin scale (K = °C + 273.15). Using Celsius yields dramatically incorrect (and impossible) results.
Cascading Efficiency: The Power of Multiplication
- Real-world energy pathways involve multiple sequential steps (e.g., fuel extraction → generation → transmission → end use).
- Losses compound: A system with five 90%-efficient steps has an overall efficiency of only 0.95 = 59%. This explains why small improvements at the least efficient step (e.g., replacing incandescent bulbs with LEDs) can yield outsized system-wide gains.
Test Yourself
The questions below are your chance to test and practice your understanding of the content covered in this lesson. In other words, you should be able to answer the following questions if you know the material that was just covered! If you have problems with any of the items, feel free to post your question on the unit message board so your classmates, and/or your instructor, can help you out!
- A heat engine has Carnot efficiency of 30%. Useful output from the engine is 1,000J. How much heat is wasted?
- How can we improve the Carnot efficiency of a heat engine by changing the hot and cold reservoir temperatures?
- Most of the energy conversion devices that we use in our day-to-day life can be classified as Heat Engines. Give two examples.
Lesson 5: Environmental Impacts of Energy Production
Lesson 5: Environmental Impacts of Energy ProductionThe links below provide an outline of the material for this lesson. Be sure to carefully read through the entire lesson before returning to Canvas to submit your assignments.
5.1 Lesson 5 Introduction
5.1 Lesson 5 IntroductionWelcome to Lesson 5
As we explored in Lesson 1, energy can be generated from many sources—fossil fuels, nuclear power, hydropower, wind, solar, and more. But here's a critical truth: no energy source is completely impact-free. Every method of producing energy affects the environment in some way, whether through emissions into the atmosphere, water use, land disruption, or waste generation. Understanding these trade-offs is essential for making informed decisions about our energy future.
In this lesson, we will examine the environmental consequences of our energy choices. We'll start by analyzing the major pollutants released when burning fossil fuels—including carbon dioxide, nitrogen oxides, sulfur dioxide, and particulate matter—and how these emissions affect air quality, human health, and climate. Next, we'll highlight historical environmental successes, such as global cooperation to reduce sulfur emissions and heal the ozone layer, demonstrating that science, policy, and innovation can drive meaningful progress. We'll also investigate the challenges of nuclear waste management and the long-term stewardship required for radioactive materials. Finally, we'll explore the water-energy nexus, comparing how much water different technologies consume and why that matters in water-stressed regions.
Learning Objectives
By the end of this lesson, you will be able to:
- Identify the primary environmental impacts associated with major energy sources (fossil fuels, nuclear, hydropower, wind, solar, and biomass).
- Compare the trade-offs between energy technologies across multiple dimensions: greenhouse gas emissions, air pollution, water consumption, land use and change, and waste generation.
- Explain how combustion of fossil fuels releases pollutants that affect human health, ecosystems, and climate—and describe the chemical processes behind key emissions (CO₂, NOₓ, SO₂, PM).
- Analyze the water-energy nexus by evaluating withdrawal vs. consumption across different electricity generation methods and assessing regional implications.
- Evaluate the challenges and strategies for managing high-level nuclear waste, including storage technologies and policy considerations.
- Recognize examples of successful environmental policy—such as the Montreal Protocol and the U.S. Acid Rain Program—and explain how science, technology, and international cooperation enabled positive change.
5.2 Fossil Fuels and Products of Combustion
5.2 Fossil Fuels and Products of CombustionIn Lesson 3 (Energy Supply and Demand), we explored how the United States and the world source their energy. One key takeaway: fossil fuels—petroleum, natural gas, and coal—still dominate the global energy mix.
Want the latest data? Check out the U.S. Energy Information Administration's U.S. Energy Facts Explained for up-to-date statistics. As of 2024, fossil fuels supply more than 80% of total U.S. energy consumption.
How Fossil Fuels Release Energy
When we use fossil fuels for energy, we typically burn (combust) them. This chemical reaction releases stored energy—but also emits substances into the atmosphere.
A simplified representation of hydrocarbon combustion looks like this:
Important note: The "air" in this reaction isn't just oxygen. Earth's atmosphere is ~78% nitrogen (N2), ~21% oxygen (O2), and ~1% argon and other gases. At high combustion temperatures, nitrogen can react to form nitrogen oxides (NOx)—a key pollutant we'll discuss shortly.
What's Actually in Fossil Fuels?
Fossil fuels are primarily made of carbon (C) and hydrogen (H)—the same building blocks found in all living things. That's no coincidence: fossil fuels formed over millions of years from ancient plants and microorganisms that were buried, compressed, and shielded from decay.
In addition to carbon and hydrogen, fossil fuels contain small amounts of:
- Sulfur (S) → can form SO2 (a contributor to acid rain)
- Nitrogen (N) → contributes to NOx formation
- Oxygen (O), trace metals, and mineral matter
Clarification: Not everything in the fuel is emitted unchanged. During combustion, chemical bonds break and reform, producing new compounds—some useful (like energy and water vapor), others harmful (like CO2, NOx, SO2, and particulates).
In this unit, we'll examine the major pollutants released from combustion, how they affect human health and the environment, and what strategies exist to reduce their impact.

Text description of the Fossil Fuel Composition image.
Natural gas is composed of carbon, hydrogen, nitrogen, sulfur, and oxygen.
Petroleum is composed of carbon, hydrogen, nitrogen, sulfur, oxygen, and minerals.
Coal is composed of carbon, hydrogen, nitrogen, sulfur, oxygen, and minerals.
Instructions: Click on the purple hot spot shown above the piece of coal below to determine what products are formed from each during combustion.
The most common products of combustion we will discuss in this module are as follows.
5.2.1 Carbon Dioxide
5.2.1 Carbon DioxideCarbon Dioxide (CO2)
Fossil fuels—coal, oil, and natural gas—are rich in carbon (C) and hydrogen (H). When we burn them for energy, carbon combines with oxygen from the air to form carbon dioxide (CO2). In fact, CO2 is the largest chemical product by mass released from fossil fuel combustion.
Fun connection: Yes, humans also exhale CO2 when we breathe! And plants need CO2 for photosynthesis—the process that powers life on Earth. So CO2 itself isn't "bad". The problem is scale and speed:
- Natural carbon cycle: Plants absorb ~120 billion tons of CO2/year; oceans and soils absorb more.
- Human addition: Burning fossil fuels adds ~38 billion tons of extra CO2 per year (as of 2024)—far more than natural systems can absorb quickly.
Use the “our world in data” interactive below to see which countries emit the most carbon emissions total.
5.2.2 Carbon Monoxide
5.2.2 Carbon MonoxideCarbon Monoxide (CO)
Carbon monoxide is a colorless, odorless, and tasteless gas formed when fossil fuels don't burn completely—a process called incomplete combustion. This happens when there isn't enough oxygen, the temperature is too low, or the fuel-air mixture isn't well mixed.
Video: Carbon dioxide & carbon monoxide (Chemistry) (4:04)
Transcript: Carbon dioxide & carbon monoxide (Chemistry)
[Music]
[Applause]
[Music]
Narrator: Most chemical reactions are pretty predictable. If we know what substances we start with, we know what substances will be formed, and we'll get the same result every time those substances react.
But sometimes the very same reactants can yield different products. There are reactions where the temperature can affect which substances are formed, and there are reactions where it matters whether we use a larger or smaller amount of one of the reactants.
That’s the case with the graphite and oxygen example. Usually, when there is plenty of oxygen, carbon and oxygen will form carbon dioxide when the graphite burns. When there is less available oxygen, like when the reaction takes place in an area with limited air supply, another reaction will occur as well, where another product is formed. In this substance, each carbon atom is attached to one oxygen atom instead of two. Instead of carbon dioxide, carbon monoxide is formed, where “mono” means one. The name of the compound is contracted from mono oxide to monoxide.
Carbon dioxide and carbon monoxide. They sound almost the same, and both are made up of carbon and oxygen, but there is an important difference between them. Carbon dioxide is naturally present in the atmosphere. There’s not much—only four hundredths of one percent—but it’s vital for all plant life. The air you exhale contains about a hundred times that amount, about four percent carbon dioxide. If there is a lot of carbon dioxide in a room, the air feels bad, but it is not dangerous to inhale.
Carbon monoxide, on the other hand, is poisonous for humans and animals. If the air you inhale contains as little as one percent carbon monoxide, that’s enough to kill you within minutes. Carbon monoxide is formed not only when pure graphite burns. Other combustible substances that contain carbon, such as petrol, oil, plastic, or wood, can also form carbon monoxide.
It’s called incomplete combustion and occurs as soon as the oxygen level gets too low. In a house fire, the carbon monoxide produced is particularly dangerous. It can make the people in the house unconscious before they have time to get out, or they can even die in their sleep without even noticing there is a fire. In a fire, there is a greater risk of dying from carbon monoxide poisoning than from the flames.
Good job they had a working smoke detector.
It’s a simplification to say that when carbon compounds burn, we get either carbon dioxide or carbon monoxide. In reality, both reactions take place at the same time. Less oxygen results in more carbon monoxide. Chemical reactions can give different products even though we start with the same reactants, and in this case, where carbon reacts with oxygen, this difference can mean life or death.
[Music]
Common sources include:
- Vehicles (cars, trucks, buses) — especially in idling or poorly tuned engines
- Home appliances: gas stoves, kerosene heaters, fireplaces, and portable generators
- Industrial processes: boilers, furnaces, and certain manufacturing operations
Why Is CO So Dangerous?
CO is extremely hazardous because it binds to hemoglobin in your blood ~200 times more tightly than oxygen does. When you inhale CO:
- It displaces oxygen in your bloodstream
- Your heart, brain, and other vital organs are starved of oxygen
- Symptoms progress rapidly:
→ Mild exposure: headache, dizziness, nausea, fatigue
→ Moderate exposure: confusion, blurred vision, difficulty breathing
→ Severe exposure: loss of consciousness, organ damage, death
Critical fact: Because CO has no smell or color, you can't detect it without a monitor. Poisoning can happen quickly—and silently.
How to Stay Safe: Prevention Saves Lives
Never run a vehicle inside a closed garage—even with the door open, fumes can accumulate dangerously.
Never use portable generators, grills, or camp stoves indoors (including garages, basements, or near windows).
Ensure proper ventilation for all fuel-burning appliances (heaters, fireplaces, water heaters).
Install battery-backed CO detectors on every level of your home and near sleeping areas. Test them monthly!
Schedule annual maintenance for furnaces, chimneys, and gas appliances to ensure clean, complete combustion.
While CO is primarily a local air quality and safety issue (unlike CO2, which affects global climate), it highlights an important principle in energy engineering: complete, efficient combustion isn't just about performance—it's about protecting human health. Modern engines, power plants, and appliances use advanced controls, catalytic converters, and sensors specifically to minimize CO emissions.
5.2.3 Sulfur Dioxide
5.2.3 Sulfur DioxideSulfur Dioxide (SO2)
Sulfur dioxide is a colorless gas with a sharp, irritating odor. It forms when sulfur (S) present in fossil fuels reacts with oxygen during combustion:
Why do coal and petroleum contain sulfur?
Fossil fuels formed from ancient organic matter that absorbed sulfur from seawater, sediments, and volcanic activity over millions of years. As a result:
- Coal: Often contains 0.5–5% sulfur by weight (varies by mine location)
- Petroleum: Contains sulfur compounds that are partially removed during refining ("sweet" vs. "sour" crude)
- Natural gas: Typically very low in sulfur (mostly removed before distribution)
The Chemistry of Acid Formation
SO₂ is highly soluble in water. When it mixes with atmospheric moisture, a cascade of reactions occurs:
- SO2 + H2O → H2SO3 (sulfurous acid — weak, but irritating)
- H2SO3 + ½O2 → H2SO4 (sulfuric acid — strong acid, major component of acid rain)
- SO2 also reacts with ammonia, metals, and other pollutants to form sulfate particles (aerosols)
These fine particles can:
- Remain suspended in air for days to weeks
- Travel hundreds of miles from the original source
- Scatter light → reduced visibility ("haze")
- Penetrate deep into lungs when inhaled
Global Context & Progress
- Historical peak: U.S. SO₂ emissions peaked in the 1970s (~26 million tons/year), largely from coal-fired power plants.
- Policy success: The 1990 Clean Air Act Amendments created a cap-and-trade program for SO2. Result? U.S. SO2 emissions dropped ~94% since 1990—one of environmental policy's biggest wins.
- Current challenges: SO2 remains a major issue in regions with heavy coal use and fewer emissions controls (e.g., parts of Asia, Eastern Europe). Satellite data now helps track global SO2 hotspots in near real-time.
How Do We Reduce SO2 Emissions?
| Strategy | How It Works | Example |
|---|---|---|
| Flue Gas Desulfurization (FGD) | "Scrubbers" spray limestone slurry into exhaust; SO2 reacts to form gypsum (usable in drywall) | >90% of U.S. coal plants now use scrubbers |
| Fuel Switching | Use low-sulfur coal, natural gas, or renewables instead of high-sulfur coal | U.S. shift from coal → gas cut SO2 dramatically |
| Fuel Desulfurization | Remove sulfur from petroleum during refining (hydrodesulfurization) | Ultra-low-sulfur diesel (ULSD) now standard in vehicles |
| Policy & Monitoring | Emissions caps, continuous monitoring, international agreements | Acid Rain Program; WHO air quality guidelines |
5.2.4 Nitrogen Oxides
5.2.4 Nitrogen OxidesNitrogen Oxides (NOx)
Nitrogen oxides is a generic term for a group of highly reactive gases containing nitrogen and oxygen. The two most important for air quality are:
- Nitric oxide (NO): Colorless, odorless, formed first during combustion
- Nitrogen dioxide (NO2): Reddish-brown gas with a sharp, biting odor; forms when NO reacts with oxygen in the air
How Is NOx Formed?
NOx forms primarily through high-temperature combustion—when nitrogen (N2) and oxygen (O2) from the air react under intense heat. This is called thermal NOx formation:
Key insight: Even if a fuel contains no nitrogen, NOx can still form because air itself is 78% nitrogen. The hotter the flame and the longer gases stay at high temperature, the more NOx is produced.
| Source Category | Examples | Why It Matters |
|---|---|---|
| Transportation | Cars, trucks, buses, ships, aircraft | High-temperature engines; major source in urban areas |
| Electric Power Generation | Coal, oil, and natural gas power plants | Large, continuous combustion sources |
| Industrial/Commercial | Boilers, furnaces, cement kilns, refineries | Often located near communities |
| Residential | Gas stoves, water heaters, fireplaces | Indoor air quality concern; cumulative urban impact |
Why You Can Sometimes See NOx
While NO and many NOx compounds are invisible, nitrogen dioxide (NO2) has a distinctive reddish-brown color. When mixed with other pollutants (like volatile organic compounds and fine particles), it contributes to:
- Photochemical smog: The hazy, brownish layer over cities on sunny days
- Urban haze: Reduced visibility in metropolitan areas and national parks

| Strategy | How It Works | Real-World Example |
|---|---|---|
| Catalytic Converters | Use platinum/palladium to convert NOx→ N2 + O2 in vehicle exhaust | Required on all U.S. gasoline vehicles since 1975 |
| Low-NOx Burners | Stage fuel/air injection to lower flame temperature and limit NOx formation | Standard in modern power plants and industrial boilers |
| Selective Catalytic Reduction (SCR) | Inject ammonia/urea into flue gas; catalyst converts NOx to harmless N2 + H2O | Used in >80% of U.S. coal plants and many diesel trucks |
| Electrification & Efficiency | Reduce combustion overall by switching to electric vehicles, heat pumps, renewables | Transportation electrification is the fastest-growing NOx reduction strategy |
| Policy Tools | Emissions standards, cap-and-trade programs, urban low-emission zones | California's Advanced Clean Cars program; EU Euro emissions standards |
5.2.5 Particulate Matter
5.2.5 Particulate MatterParticulate Matter (PM)
Particulate matter (PM) is a mixture of tiny solid particles and liquid droplets suspended in the air. Think of it as a "soup" of microscopic materials—from dust and soot to sulfates, nitrates, and organic compounds.
| Particle Type | Diameter | Visual Comparison | Can Reach... |
|---|---|---|---|
| Coarse PM (PM2.5-10) | 2.5–10 µm | Pollen, mold spores | Nose, throat, upper airways |
| Fine PM (PM2.5) | ≤ 2.5 µm | Smoke, bacteria | Deep lungs (alveoli), bloodstream |
| Ultrafine PM (PM0.1) | ≤ 0.1 µm | Viruses, combustion nanoparticles | Alveoli, potentially cross into blood |
Scale check: A human hair is ~70 µm wide. PM2.5 is 30× smaller—small enough to bypass your body's natural defenses.

Text description of the Size comparisons for PM particles image.
The image visually compares the size of different particles relative to a human hair. It features a large, detailed depiction of a human hair, shown horizontally in a gray hue with visible texture. Below the hair, there are three irregularly shaped particles labeled as "Fine Beach Sand" in various shades of green, orange, and yellow, with a diameter marked as 90 microns. Above and to the right of the hair, there are smaller, round particles in two groups. One group consists of pink spheres labeled "PM2.5," representing combustion particles, organic compounds, and metals, each less than 2.5 microns in diameter. The second group consists of blue spheres labeled "PM10," representing dust, pollen, mold, and other substances, each less than 10 microns in diameter. Arrows point from these groups to indicate their respective sizes relative to the human hair.
Where Does Particulate Matter Come From?
PM forms through two main pathways:
| Type | How It Forms | Common Energy-Related Sources |
|---|---|---|
| Primary PM | Emitted directly during combustion or physical processes | • Soot from diesel engines • Fly ash from coal plants • Dust from mining, construction, unpaved roads |
| Secondary PM | Forms in the atmosphere when gases react | • SO2 → sulfate particles • NOx + VOCs → nitrate particles + organic aerosols • Ammonia (from agriculture) + acids → ammonium salts |
Key insight: Even if a power plant installs filters to catch primary PM, it may still contribute to secondary PM downwind through gas emissions. This is why controlling SO2 and NOx also reduces particulate pollution.
How PM Affects Your Body: It's All About Size
Your respiratory system has natural filters—but PM can bypass them:
| Particle Size | Where It Deposits | Why It Matters |
|---|---|---|
| > 10 µm | Nasal passages, throat | Usually trapped and cleared by mucus/cilia |
| 2.5–10 µm | Upper airways, bronchi | Can irritate airways; trigger coughing, asthma |
| 0.1–2.5 µm | Deep lungs (alveoli) | Most dangerous: can cause inflammation, enter bloodstream |
| < 0.1 µm | Alveoli; may cross into blood | Emerging research links to cardiovascular effects |
| Strategy | How It Works | Real-World Example |
|---|---|---|
| Electrostatic Precipitators (ESPs) | Charge particles electrically; collect them on plates | Used in >90% of U.S. coal plants; >99% efficient for fly ash |
| Fabric Filters (Baghouses) | Force exhaust through fine fabric that traps particles | Common in cement plants, biomass facilities |
| Diesel Particulate Filters (DPFs) | Trap soot in vehicle exhaust; periodically burn it off | Required on modern diesel cars/trucks in U.S., EU |
| Fuel Switching & Efficiency | Reduce combustion overall: renewables, electrification, efficiency | Replacing coal with wind/solar cuts PM at the source |
| Policy & Monitoring | Air quality standards, emissions limits, public alerts | EPA's National Ambient Air Quality Standards (NAAQS) for PM2.5/PM10 |
Particulate matter (PM) is the general term used to describe a mixture of solid particles and liquid droplets found in the air. Some particles are large enough to be seen as dust or dirt. Others are so small they can be detected only with an electron microscope.
5.3 Green House Effect
5.3 Green House EffectThe greenhouse effect is the natural process in which gases in the atmosphere trap heat from the sun. This process was first identified by scientists in the 1800s. This process is what makes earth habitable for life.
How it works (simplified):
- Sunlight passes through the atmosphere and warms Earth's surface
- Earth radiates that heat back toward space as infrared radiation (invisible heat energy)
- Greenhouse gases (GHGs) absorb and re-emit some of that infrared radiation
- This trapped heat warms the lower atmosphere—like a blanket around the planet
Video: What is the Greenhouse Effect? (2:29)
Transcript: What is the Greenhouse Effect?
Narrator: What is the Greenhouse Effect?
Earth is a comfortable place for living things. It’s just the right temperatures for plants and animals – including humans – to thrive. Why is Earth so special? Well, one reason is: the greenhouse effect!
A greenhouse is a building with glass walls and a glass roof. The clear glass allows sunlight to shine into the greenhouse, while also trapping the Sun’s heat inside. This is how a greenhouse keeps plants warm, even at night and in the winter. The greenhouse effect keeps Earth warm in pretty much the same way.
Earth isn’t surrounded by glass, but it is surrounded by a jacket of gases called the atmosphere. In the daytime, the Sun shines through the atmosphere warming Earth’s surface. After the Sun goes down, Earth’s surface cools. This releases heat back into the air. But, some of that heat is trapped by the gases in the atmosphere. These heat-trapping gases are called greenhouse gases. Carbon dioxide, water vapor and methane are all examples of greenhouse gases.
Earth needs a balance of greenhouse gases to maintain just the right temperature for living things. But, some human activities are changing Earth’s natural greenhouse effect. For example, burning fossil fuels – like coal and oil – releases more carbon dioxide into our atmosphere. These extra greenhouse gases can cause the atmosphere to trap more and more heat, leading to a warmer Earth.
NASA satellites are constantly measuring the gases in our atmosphere from space. They have observed increases in the amount of carbon dioxide and other greenhouse gases. The information from NASA satellites can help scientists figure out where greenhouse gases are coming from and how they are ending up in our atmosphere. This information will help us better understand the impact that greenhouse gases have on our climate. And help us better understand this very special greenhouse that we call home. Find out more about our Earth at NASA Climate Kids!
5.3.1 Greenhouse Gases
5.3.1 Greenhouse GasesCarbon Dioxide (CO2): Carbon dioxide enters the atmosphere through burning fossil fuels, solid waste, trees, volcanos, and also as a result of certain chemical reactions (e.g., cement production). Carbon dioxide is removed from the atmosphere when it is absorbed by plants as part of the biological carbon cycle. Nearly 80% of all greenhouse gas emissions in the US is from carbon dioxide.
Methane (CH4): Methane is emitted during the production and transport of coal, natural gas, and oil. Methane emissions also result from livestock and other agricultural practices, land use, and by the decay of organic waste in municipal solid waste landfills. While methane emissions only account for about 11% of GHG emissions in the US, methane is more efficient at trapping radiation than carbon dioxide. Methane’s global warming potential is 28 times greater than carbon dioxide.
Nitrous Oxide (N2O): Nitrous oxide is emitted during agricultural, land use, and industrial activities; combustion of fossil fuels and solid waste; as well as during treatment of wastewater. Nitrous oxide oxide accounts for only 6% of GHG emissions in the US, but has a large impact because its global warming potential is 265 times that of carbon dioxide.
Water (H2O): Water is a naturally occurring greenhouse gas and most abundant. Water vapor amplifies global warming cause by other greenhouse gases. Water vapor has a very short lifespan in the atmosphere due to precipitation.
Fluorinated gases: Hydrofluorocarbons, perfluorocarbons, sulfur hexafluoride, and nitrogen trifluoride are synthetic, powerful greenhouse gases that are emitted from a variety of household, commercial, and industrial applications and processes. Fluorinated gases do have a natural cause, unlike the previous GHG discussed above. They are produced entirely from human related manufacturing and industrial processes.
The greenhouse effect is a natural process essential to life on Earth, maintaining a stable and hospitable climate for millions of years. However, human activities have significantly increased atmospheric greenhouse gas concentrations, disrupting this long-standing balance and driving a rapid rise in global temperatures. In the next page, we’ll explore how this warming translates into climate change—examining its real-world impacts, the science behind future projections, and the energy solutions that can help stabilize our planet’s climate.

Text description of the Greenhouse Effect image.
The image illustrates the greenhouse effect, divided into two sections: "Natural" and "Human-Enhanced." On the left, under "Natural," the atmosphere is shown as a curved line with "Greenhouse Gases" labeled. A large sun in the upper left corner emits an arrow labeled "Sun Energy" pointing towards Earth. Some of this energy is reflected as "Heat" back into space. The landscape includes small, subtle green shapes resembling hills and grass. The gases CH₄ and CO₂ are labeled above the line. On the right side, under "Human-Enhanced," the same concept is depicted, but with a denser layer of gases, labeled "More Greenhouse Gases." Additional visuals include industrial icons like factories. The arrows indicating heat reflection are more prominent, suggesting increased heat retention. The background is a gradient of blue, with text boxes providing explanations under each heading.
5.4 Climate Change
5.4 Climate ChangeClimate change refers to long-term shifts in global temperatures and weather patterns, typically measured over decades or longer. It's important to distinguish between weather the short-term conditions outside today, like rain, sunshine, or a cold snap and climate, which is the average of weather patterns over 30 years or more. Just because a particular day is cold or a region experiences a severe snowstorm does not mean climate change isn't happening or that the Earth isn't warming overall; climate is defined by long-term trends, not single events
Natural vs. Human-Caused Change
- Climate can change naturally (volcanic eruptions, solar activity)
- Since the 1800s, human activities have been the MAIN driver of recent climate change
- The primary cause? Burning fossil fuels: coal, oil, and natural gas
Humans are responsible for global warming
Climate scientists have showed that humans are responsible for virtually all global warming over the last 200 years. Human activities like the ones mentioned above are causing greenhouse gases that are warming the world faster than at any time in at least the last two thousand years.
The average temperature of the Earth’s surface is now about 1.42°C warmer than it was in the late 1800s-prior to the industrial revolution-and warmer than at any time in the last 100,000 years. Scientists can gather information on the environment going back hundreds of thousands of years through ice cores. Ice core samples trap small amounts of air bubbles which allow scientists to gather information on the environment at that time, including the amount of carbon dioxide in the atmosphere.
The last decade (2015-2024) was the warmest on record, and each of the last four decades has been warmer than any previous decade since 1850.
Video: How Ancient Ice Proves Climate Change Is Real (12:25)
Transcript: How Ancient Ice Proves Climate Change Is Real
Dr. Jeffrey Severinghaus: You can see the tiny air bubbles in there? Those are what we study. This is a piece of ice – about 20,000 years old – from Antarctica. And bubbles trap air from 20,000 years ago, so we can find out what air was like back then. Can figure out if carbon dioxide has gone up or down. And what we’ve learned from that is carbon dioxide is higher now than it’s been for at least the last million years, probably the last 20 million years, but that’s less certain. So it’s really quite a dramatic thing that we humans have done to the carbon dioxide.
[Music ]
Dr. Joe Hanson: Hey smart people. Joe here. Earth’s atmosphere and climate have changed in a big way, and they are continuing to change. There’s no doubt about that, and we’ve known it for decades. But Earth’s climate has always changed throughout its history. So how do we know this time is different? We know because at places like the Scripps Institution of Oceanography in southern California, we have freezers full of ancient ice that let us look into the past, thousands–even millions of years, and measure exactly what Earth’s atmosphere, and its climate, were like throughout deep history.
I recently stopped by to visit Dr. Jeffrey Severinghaus, who studies ice cores. He’s part of a team working to find the oldest ice on Earth. Each of these little blocks of frozen water can tell us something about our planet’s past, long before we existed – and where it’s heading, now that we do.
And inside these tiny bubbles in this ice, is old bubbles of air that existed on this planet as old as that ice is.
Severinghaus: Yeah.
Hanson: That’s the atmosphere of the planet, trapped in those little bubbles.
Severinghaus: What happens in the polar regions is it’s too cold to melt. So when snow falls it doesn’t melt, it just piles up and piles up, and eventually turns into ice under its own weight. But if you think about what snow is like, if you have a snowflake you have air in between the snowflake. As snow becomes more and more dense, it tends to squeeze out the air between snowflakes, but it turns out it doesn’t squeeze out all the air.
Hanson: As more layers of snow fall and condense, those tiny voids are literally frozen in time, layer upon layer. And, there are a lot of layers.
Severinghaus: Some ice cores have annual layers just like trees do, you know how you can count tree rings? So some graduate student sits there and counts 50,000 annual layers. Of course it has to be a graduate student! What a lot of work.
Hanson: But to study ancient ice, first you have to find ancient ice. Where are you doing this research? Where are you collecting these ice cores?
Severinghaus: This is from a place called Taylor Glacier in Antarctica.
Hanson: Taylor Glacier is a 54 kilometer stretch of ice and rock. People like Dr. Severinghaus can read it like a book–full of stories about our ancient climate. Taylor Glacier is special because it’s one of the few places on Earth where the ancient ice has risen to the surface.
Severinghaus: So, you only have to drill 5-10 meters to get the ice. Which is much easier than drilling a deep ice core which is 3,000 meters and costs 50 million dollars.
Hanson: It’s basically a cylinder that has little tiny teeth on the bottom. And when you rotate the barrel it carves out the ice, but only a little bit in a ring, and it leaves behind an ice core in the middle. Once the core is pulled up, it’s packed up and sent off, carrying a slice of history inside it.
Severinghaus: It’s a slow process, it takes like a month for the ship to get here.
Hanson: Whether you’re standing in the middle of the Amazon rainforest or at the North Pole, you’re breathing roughly the same air. Our atmosphere is pretty much the same everywhere. Which means that a tiny air bubble from that one spot is enough to paint a picture of what the entire planet’s atmosphere looked like so many years ago.
Severinghaus: This is the freezer. We won’t be in there long, so don’t worry about the cold. So this is what a typical ice core sample looks like. Now you’ll notice that there’s no bubbles. That’s because when you get down below 600-700 meters, the pressure is so high that the air turns into something called a clathrate which is an ice-like substance.
Hanson: Clathrates are crystals, where instead of bubbles, the molecules are trapped in a cage made by the bonds between frozen water molecules. There’s still gas in there.
Severinghaus: There’s still gas molecules but they’re not in a gas phase.
Hanson: Man the patterns are so cool, you must randomly see such cool ice phenomena. It’s cold in here! This cold!
Severinghaus: Funny how that works.
Hanson: Okay, but how do you get the ancient air out of the ice to measure it? I mean, without contaminating it with… all this air around us?
[Severinghaus] So this is how we actually extract the ancient air, if you will. We take a piece of ice and put it in a vacuum flask, and pump out all of the modern air, the air we’re breathing right now, using a vacuum line. This is a vacuum pump here. So we make a seal, and close this valve, and then you only have an ice cube and a little bit of water vapor, but no air. Then we melt the ice, and the melting of the ice releases those little air bubbles of ancient air.
Hanson: So because you already let out the “now air,” the only gasses that are coming out are the ones that are trapped inside the ice.
Severinghaus: Right, and then we can purify the gas a little bit by freezing the water.
Hanson: So they pump out all the modern air, melt the ice to let the ancient atmosphere vaporize, re-freeze the water, and pump that ancient atmosphere out so it can be measured. This is a liquid helium tank?
Severinghaus: It’s cold enough - it’s at 4 kelvin, 4 degrees about absolute zero. It’s cold enough that all the air actually condenses and turns into ice - air ice.
Hanson: Every gas, will freeze.
Severinghaus: Every gas except helium.
So then we take it over here. This is the analysis part of it. This tube is actually a bottle, a long skinny bottle that’s capable of dipping itself into the liquid helium.
Hanson: You wouldn’t want to be getting your own hands too close to 4 kelvin.
Severinghaus: No.
Hanson: The frozen air gets put into this, a mass spectrometer, which basically measures the masses of really tiny things.
We measure the chemical composition of the atmosphere using isotopes: they’re like different flavors of atomic elements. Isotopes, those flavors of elements, have unique masses, and the mixture of them in the air bubbles can tell us all kinds of things about ancient earth.
Severinghaus: We use the isotopes of nitrogen to tell ancient temperature at the time the snow was falling. Ordinary nitrogen has a mass of 14, but the rare isotope nitrogen 15 has a mass of 15. It turns out that relative proportions of N15 and N14 are sensitive to temperature.
Hanson: So, whatever the temperature is at a particular time, it’s creating different mixes of different flavors of gasses in the atmosphere, like a fingerprint for temperature.
Severinghaus: That’s right, and that’s trapped in air bubbles for posterity. So the sample here starts out waiting its turn and when its turn comes the sample opens and goes into this little tiny tube, which leads into the mass spectrometer, here, and it gets accelerated by a 3,000 volt electrical gradient, which makes the ions go really fast. And then they hit this magnet and they’re forced to make a 90-degree right turn, and in doing so, heavy things like N15 try to go straight, and lighter things like N14 get bent more.
Hanson: It’s like being in a car. You can’t turn as fast in a big heavy car. So they swing out, and then the detector is seeing what swung out farther.
So, you’re getting resolution of things that differ by a single neutron when they’re flying through that curve? That’s pretty cool.
The same idea can be used to find out more than just temperature. Labs all over the world use elements trapped in air, trapped in ice cores, to paint a map from our distant past to today. Oxygen isotopes can tell us how oceans changed, mineral dust tells us about how the atmosphere moved around, there are chemical clues about early volcanoes. But maybe most importantly, we can trace changing levels of carbon dioxide.
So the climate has changed before, how do we know that this time it’s us?
Severinghaus: The way we know, is just like we talked about with nitrogen, the carbon in carbon dioxide also has two flavors. There’s carbon 12, which is ordinary carbon, and then a very rare form of carbon, carbon 13. So, that’s how we know it’s human caused. The atmosphere, as it goes up in CO2 concentration, the carbon 13 of the atmosphere is taking a nosedive. And that’s not what would happen if it was natural CO2. Because fossil fuel CO2 is very depleted in carbon 13.
Hanson: This comes from the fact that plants prefer to eat CO2 made of carbon-12, and when we burn fossil fuels made from those ancient plants, the fraction of carbon-12 in the atmosphere goes up while carbon-13 goes down. We’ve only been measuring carbon dioxide in the atmosphere since 1957, but using the data from ice cores, we can trace levels back way farther. And this is what we see:
Severinghaus: CO2 was pretty flat for most of the past 1,000 years. All around 280 ppm. Now we’re going to add in the carbon 13 abundance, this gold line. And you can see that was also pretty constant for most of the last thousand years.
But then around 1850, right when carbon dioxide concentration started to rise, the carbon 13 abundance started taking a nosedive. And this kind of unambiguously tells you that humans did it. That’s why I call it the smoking gun of human causation. There are lots of other ways we know, but this is the simplest.
Hanson: We’re moving into uncharted territory. The last time something like this shows up in the ice record is around 55 million years ago, when a volcano popped up under an oil field and cooked basically everything.
Severinghaus: It sent all the carbon dioxide into the atmosphere. So, the carbon dioxide shot up, we think it nearly quadrupled, and the climate warmed by 6 degrees.
The most important thing is right away to solve this global warming problem. We don’t have much time left. We have to put aside all of our political differences, The health and wellbeing of the planet is so much more important than everything else. We can do this, I know we can.
Hanson: We can. But will we? I hope so. Stay curious.
Many people think that climate change means warmer temperatures. But increasing temperatures are only the beginning of the story. Because the Earth is a system where everything is connected, changes in one area can influence changes in all others.
The consequences of climate change include, among others, intense droughts, water scarcity, severe fires, rising sea levels, flooding, melting polar ice, catastrophic storms and declining biodiversity.
People are experiencing climate change in diverse ways
Climate change can affect our health, ability to grow food, housing, safety and work. Some of us are already more vulnerable to climate impacts, such as people living in small island nations and other developing countries. Conditions like sea-level rise and saltwater intrusion have advanced to the point where entire communities have had to relocate, while protracted droughts are putting people at risk of famine. In the future, the number of people displaced by weather-related events is expected to rise.
Read more about climate change on the United Nations What is Climate Change page.
Crash Course What is Climate Change
Video: What is Climate Change? (13:57)
Transcript: What is Climate Change?
Introduction to Climate Change
Dr. Sammy: Our planet has been draped in ice sheets, filled with boiling-hot oceans, and dimmed by volcanic ash – all before anything more complicated than a single-celled organism showed up. So climate change is nothing new around here… when it happens gradually, over millions of years.
But something new has happened in the last few centuries. People like us…except, wearing hats like this…began burning fossil fuels like coal, oil, and natural gas to make energy.
Text On Screen: Fossil Fuels: Coal, Oil, Natural Gass
Most of us aren’t wearing hats like those anymore. But we’re still powering our daily lives and industries with those fuels, releasing billions of tons of carbon dioxide every year. And that’s caused Earth’s climate to change in the span of just a few human lifetimes, the geological blink of an eye.
Hi! I'm Dr. Sammy, your friendly neighborhood entomologist, and this is Crash Course Biology! Hey, do you guys smell that? …smells like... theme music?
[Theme Music]
Dr. Sammy: Now, I know what you’re thinking. “Wait, isn’t this Crash Course Biology?” And yeah, this episode is heavy on the gases, low on the golgi bodies. And that might leave you wondering, what does climate change have to do with the science of life?
Here’s the thing: life and climate are tied together, like that tangled pair of headphones at the bottom of your backpack. You know, like you tug one end and then a knot tightens, which is looped around a paperclip, somehow snagged on that tiny notebook where you drew hearts around your crush’s name, which after several tugs is now lying open on the floor and…I’m breaking into a cold sweat just thinking about it.
But back to the point, we can’t talk about life without talking about climate —which doesn’t mean last week’s thunderstorm or a one-day temperature swing – that’s weather. Climate is long-term weather conditions averaged over many years. To understand the difference between them, just remember that knowing the weather will help you decide if you should grab an umbrella before you head out, but knowing the climate will help you decide if you should invest in a good air conditioner.
While the weather might impact your choice of clothing for the day, the climate directly impacts where and when different kinds of life can survive.
The Greenhouse Effect
We owe today’s climate to the fact that our little green-and-blue marble of a home isn’t just floating in space unprotected. It’s wrapped up in an atmosphere; a big, invisible, gassy jacket. Which, granted, sounds pretty weird when you put it that way. But without it, we wouldn’t exist.
This jacket is made of different kinds of gases. And a small fraction of them, known as greenhouse gases, absorb solar energy like, super well. We’re talking about gases like methane, water vapor, and most importantly carbon dioxide – also known as CO2. They account for less than half of one percent of our atmospheric jacket. But they’re a part of what makes it so good at trapping heat, sort of like all the little white feathers in your puffy coat.
When sunlight beams down from space, most of it travels through those gases with no problem. The energy from that sunlight gets absorbed as it strikes the
Earth, warming the surface. That type of warming is normal and seasonal. The Earth naturally bounces some of that solar energy back toward space. Where some of it exits the atmosphere and heads right back out into the inky ether.
But the rest of that energy gets trapped by the Earth’s gassy jacket. Specifically by those super absorbent greenhouse gases, which suck up heat and bounce itback down to us again. This warming process is called the greenhouse effect. Unsurprisingly, It works the same way as a greenhouse – using layers of glass to trap heat inside. And it keeps Earth at a nice, cozy, insulated average of 14 degrees Celsius.
Without it, our Earth would be a chilly average of -18 degrees Celsius. Great for storing ice cream! Not so good for rainforests, swimsuits, or us for that matter. So, the greenhouse effect is a natural, helpful process that makes Earth habitable for all of life!
But you can have too much of a good thing. When our atmospheric jacket contains more carbon dioxide, for example, it gets really good at trapping heat. Like, too good. And the hotter things get, the more water evaporates and joins the atmosphere—and remember, water vapor itself is a greenhouse gas, so that in turn absorbs even more heat, creating a looping system of cause-and-effect that just keeps reinforcing itself.
Measuring the Greenhouse Effect
And while dressing in layers is great if you’re hiking in the Alps, it’s really hard for our planet to shed its extra coats. So all of that heat gets stuck going from the ground to the atmosphere like the worst game of hot potato ever played.
When I learned about this, I was like, "Wow, what a revelation! I can’t believe we’ve only recently figured this out!" But it turns out that this isn’t new knowledge; we’ve known how, and why, this could happen for nearly 170 years.
Let’s pay a visit to the Theater of Life… [Inquisitive music] Back in 1856, Eunice Foote, an American scientist and suffragette, was thinking about how the Sun’s warmth affected different gases. In those days, the scientific community was a bit like a fort with a handmade “no girls allowed” sign out front. But Foote wasn’t deterred, and ran her experiments anyway.
She filled tubes with different combinations of gases, including carbon dioxide. After putting some tubes in the Sun and some in the shade, she compared their temperatures, trying to find the hottest gas. All the tubes in direct sunlight warmed up. But none as intensely as the tube that contained carbon dioxide. The temperature had soared to 51.7 degrees Celsius, hot enough to burn your fingers.
From that insight, Foote theorized that if our atmosphere ever contained more carbon dioxide, the whole planet would warm up as a result, which would mean a lot more than a few scalded fingers. And sure enough, today, that’s exactly the situation we’re in.
Foote was one of the first scientists to recognize carbon dioxide’s potential to affect Earth’s climate. But she wasn’t the only one to connect the dots. For example, just a few decades later, another scientist named Dr. Svante Arrhenius observed that burning coal releases carbon dioxide. As a fossil fuel, coal forms from the decomposed, carbon-based bodies of plants and animals that lived and died a long time ago. And I’m talking before the dinosaurs. So no, I’m afraid that means you aren’t gassing up your car with the remains of a T-Rex.
When we burn those fossil fuels—whether it’s in the form of coal, oil, or natural gas—carbon dioxide gets released into the atmosphere. When Arrhenius ran the numbers, he predicted that carbon dioxide released by burning fossil fuels could warm our climate within a few thousand years if we kept burning them at their current rate. But we’ve far outpaced his estimates.
Our emissions of carbon dioxide have grown and grown and grown — and so has the mountain of evidence that those emissions are warming our planet. Some oil and gas companies have worked to promote uncertainty around the existence of climate change and what’s causing it. While they have only very recently acknowledged its existence, as of 2023, they're still trying to deflect from what's causing it. But the scientific consensus on this is overwhelming. You can learn much more about that in our Climate & Energy series.
We’ve only been reliably taking direct measurements of Earth’s global temperature since the 19th century. But that measly slice of time shows a steady rise in temperature of about 1.1 degree Celsius since 1880. And we know that that’s unusual because we’ve learned to read Earth’s much longer climate diary, in the form of ice cores.
See, when snow hardens into ice, tiny bubbles of air remain trapped in the gaps between snowflakes. These gases and water molecules stay frozen, like entries in a frosty journal. So by drilling deep down into polar ice, we can snoop on what the atmosphere was like hundreds of thousands of years ago.
Carbon Sinks
Ice cores show us that carbon dioxide levels have fluctuated over the past 800,000 years. And temperatures have fallen and risen alongside them, too. But when people started burning fossil fuels, carbon dioxide levels began to spike quickly, like really, really quickly. And they haven’t stopped rising.
Before the Industrial Revolution, for every million molecules of air in our atmosphere, around 280 were carbon dioxide molecules. But by 2022, that number had increased to 422 —the highest concentration of CO2 our planet has seen in 4 million years.
And that surge in carbon dioxide affects more than just the temperature. As the amount of carbon dioxide in our atmosphere rises, it impacts all of Earth’s systems. Just like yanking on the end of that tangled mess of headphones impacted all of the other items in my bag (and eventually, everybody around us when stuff started falling out). It’s all connected, is what I’m saying.
For example, the ocean is our planet’s largest carbon sink. It’s sort of like a big storage container for carbon. In fact, the ocean holds 50 times more carbon than the air or soil do. But a chemical reaction happens when carbon dioxide meets water, it creates an acid. So that influx of carbon has already turned the ocean 30% more acidic since the 19th century.
As carbon dioxide and other greenhouse gases trap more heat, there’s more energy pouring into our planet than going out. That means more energy is pumped into the ocean, fueling hurricanes and typhoons to become more frequent and more intense.
Environmental Justice
As the whole planet gets hotter, that triggers all kinds of changes. Spring arrives earlier, leading to shorter winters and longer summers. Rising temperatures lead to double-whammy droughts and heatwaves. And that leaves forest floors full of dried-up plants that serve as fuel for wildfires to ignite—spreading faster, farther, and more often.
Plus, Earth’s polar ice caps are melting, transforming solid ice to slush and seawater. And that’s causing ocean levels to rise and encroach on land. So while some communities are already facing a problem of not enough water, others are facing a problem of too much.
And because these adverse changes layer on top of existing social inequalities, they disproportionately affect lower-income communities and people of color, making climate change not only a scientific issue, but a matter of environmental justice that has spurred some researchers to political action.
For example, climate scientist Nicole Hernandez Hammer witnessed first-hand, through her field research, the sea-level rise alongside Miami Beach’s Latino communities. But these communities were not included in conversations about climate change or the dangers of rising sea levels. So, Hammer took action, moving into environmental outreach and education.
And, while the threat is still there, these communities are now in conversation about climate change, and able to plan and advocate for the future of their environment. And the good news more broadly is we know exactly why these tangled, complex effects are happening.
The more we burn those fossil fuels, the more greenhouse gases we release —and that’s driving sweeping changes all over our planet. And these changes are impacting life at all levels from the tiniest bacterium, to the elephants of Botswana, to you and me.
We can slow these impacts by breaking up with fossil fuels. But we also have to invest in nature’s carbon sinks —such as soils and forests— which pull carbon out of the atmosphere and back into the land, where it can’t keep heating things up.
Review & Credits
It won’t be the easiest breakup. We’ve designed whole societies and global systems around fossil fuels. We should fully expect to be listening to Jazmine Sullivan on repeat with a gallon of Rocky Road. But this is one relationship we can't afford to stay in.
So, in order to halt emissions, we have to both invent new systems and work more efficiently within old ones, and to do that, we’ve got to get a whole planet’s worth of people on board. And if you’ve ever been part of a group project, you know that last part isn’t easy.
Thankfully, when faced with global crises, humans have one great thing going for us: we are creative. I mean, we’ve been to space, we’ve got electric cars, we made furbies for some reason. So yes, It’s going to take all of our creativity and cooperation to tackle. But the only way out is through, and the only way through is together.
In our next episode, we’ll tune back into the world of living things— and see how our rapidly changing climate involves much more than the atmosphere. It affects every living, breathing, organism on this planet— including you and me.
This series was produced in collaboration with HHMI BioInteractive. If you’re an educator, visit BioInteractive.org/CrashCourse for classroom resources and professional development related to the topics covered in this course.
Thanks for watching this episode of Crash Course Biology, which was filmed at our studio in Indianapolis, Indiana, and was made with the help of all these nice people. If you want to help keep Crash Course free for everyone, forever, you can join our community on Patreon.
Climate Change Solutions
Since climate change is a worldwide problem that requires international cooperation. It will affect everyone, although the impacts of climate change are more readily seen in island populations as sea levels rise.
Paris Agreement is an agreement signed in 2015 at the UN Climate Change Conference (COP 21) in Paris. This agreement set long term goals to guide all nations to
- Reduce Global Greenhouse Emissions to hold global temperatures to well below 2°C above pre-industrial levels.
- Periodically assess the collective progress towards meeting long term goals
- Provide financing to developing countries to mitigate climate change, strengthen resiliency and adapt to climate impacts
Video: What is the Paris Agreement (1:39)
Transcript: What is the Paris Agreement
Presenter: What is the Paris Agreement?
The Paris Agreement is a legally binding international treaty on climate change, to limit global warming to well below 2, preferably to 1.5 degrees Celsius compared to pre-industrial levels. This requires economic and social transformation to face the climate challenges now and moving into the future, based on the best available science.
The Paris Agreement works on a 5 year cycle of increasingly ambitious climate action. By 2020, countries communicate their plans, known as "nationally determined contributions". Countries communicate actions they will take to reduce the greenhouse gas emissions in order to reach the goals of the Paris Agreement. Countries also communicate actions they will take to build resilience to adapt to the impact of rising temperatures. This may include information on adaptation and finance flows.
The Paris Agreement also provides a framework for financial, technical, and capacity-building support to those countries who need it. Starting in 2024, Countries report transparently on actions taken. Collective progress under the Paris Agreement will be assessed through a global stocktake. This will lead to recommendations for countries to set more ambitious plans in the next round.
5.5 Past Pollutant Problems and Solutions
5.5 Past Pollutant Problems and SolutionsIt’s easy to feel overwhelmed by the environmental impacts of energy production, but history shows that meaningful progress is possible. Throughout the 20th century, scientists and policymakers collaborated to solve several major environmental crises; issues that once dominated the headlines but are rarely discussed today. These success stories demonstrate how science and policy, when working together, can drive real, lasting change.
5.5.1 Acid Rain
5.5.1 Acid RainAcid rain is a serious environmental problem around the world, particularly affecting Asia, Europe, and large parts of the U.S. and Canada. The acidic pollutants such as SO2 and NOx are emitted into the environment by combusting fossil fuels.
Most of the sulfur in any fuel combines with oxygen and forms SO2 in the combustion chamber. This SO2, when emitted into the atmosphere, slowly oxidizes to SO3. SO3 is readily soluble in water in the clouds and forms H2SO4 (sulfuric acid).
Most of the NOx that is emitted is in the form of NO. This NO is oxidized in the atmosphere to NO2. NO2 is soluble in water and forms HNO3 (nitric acid).
Pure water has a pH of 7.0. Normal rain is slightly acidic because carbon dioxide dissolves into it, so it has a pH of about 5.5. As of the year 2000, the most acidic rain falling in the US has a pH of about 4.3. By the 2020's most locations of the US have precipitation with pH of 5.0-5.5.
Below is a video demonstration that replicates the effect of acid rain on plant life. In this video, beans are placed in: a) water, b) slightly acidic water and c) acidic water, and their growth is observed over a period of three days. Please watch the following 5:35 video:
Acid rain looks, feels, and tastes just like clean rain. The harm to people from acid rain is not direct. Walking in acid rain, or even swimming in an acid lake, is no more dangerous than walking or swimming in clean water. However, the pollutants that cause acid rain also damage human health.
- Effects of Sulfur Dioxide (SO2): These gases interact in the atmosphere to form fine sulfate and nitrate particles that can be transported long distances by winds and inhaled deep into people's lungs. Fine particles can also penetrate indoors. Many scientific studies have identified a relationship between elevated levels of fine particles and increased illness and premature death from heart and lung disorders, such as asthma and bronchitis.
- Effects of Nitrogen Oxide (NOx): Decrease in nitrogen oxide emissions are also expected to have a beneficial impact on human health by reducing the nitrogen oxides available to react with volatile organic compounds and form ozone. Ozone impacts on human health include a number of morbidity and mortality risks associated with lung inflammation, including asthma and emphysema.

Text description of the Annual Wet Sulfate Deposition image.
The image is a comparison of two maps of the United States showing annual wet sulfate (SO₄²⁻) deposition over two different time periods, 1989-1991 and 2020-2022. Each map displays the continental U.S. with color gradients representing the levels of sulfate deposition.
On the left, the map from 1989-1991 shows high levels of sulfate deposition concentrated mostly in the eastern and central regions, especially pronounced in the Ohio Valley and surrounding areas, depicted in dark red and orange, indicating higher levels. The western regions are shown in lighter greens and yellows, indicating lower levels of deposition.
On the right, the map from 2020-2022 has a more uniform teal color across the entire country, suggesting significantly reduced sulfate deposition levels compared to the earlier period. This illustrates a substantial improvement in air quality over time.

Text description of the Annual Sulfur Dioxide Emissions image.
The image is a bar and line graph titled "Annual Sulfur Dioxide Emissions, 1990–2020." It displays data on sulfur dioxide emissions and gross electricity generation in the United States over the period of 1990 to 2020. The vertical axis on the left measures sulfur dioxide emissions in million short tons, ranging from 0 to 17.5, while the right vertical axis measures gross generation in billion megawatt-hours (MWh), ranging from 0 to 3.5. The bars in blue represent the sulfur dioxide emissions for each year, starting at 15.73 million short tons in 1990 and decreasing to 0.79 million short tons in 2020. The green line indicates gross generation, which shows a generally increasing trend from 1990 until around 2008, then slightly decreasing towards 2020. The graph includes a note that data for sulfur dioxide emissions from 1991 to 1994 are not available.
| Year | Sulfur Dioxide (million short tons) | Gross Generation (Billion MWh) |
|---|---|---|
| 1990 | 15.73 | n/a |
| 1991 | n/a | n/a |
| 1992 | n/a | n/a |
| 1993 | n/a | n/a |
| 1994 | n/a | n/a |
| 1995 | 11.83 | n/a |
| 1996 | 12.51 | n/a |
| 1997 | 12.94 | 2.25 |
| 1998 | 13.09 | 2.34 |
| 1999 | 12.45 | 2.39 |
| 2000 | 11.20 | 2.49 |
| 2001 | 10.64 | 2.46 |
| 2002 | 10.20 | 2.48 |
| 2003 | 10.59 | 2.53 |
| 2004 | 10.26 | 2.58 |
| 2005 | 10.22 | 2.74 |
| 2006 | 9.39 | 2.72 |
| 2007 | 8.93 | 2.83 |
| 2008 | 7.62 | 2.78 |
| 2009 | 5.82 | 2.65 |
| 2010 | 5.17 | 2.80 |
| 2011 | 4.55 | 2.73 |
| 2012 | 3.32 | 2.71 |
| 2013 | 3.24 | 2.69 |
| 2014 | 3.16 | 2.70 |
| 2015 | 2.22 | 2.66 |
| 2016 | 1.49 | 2.59 |
| 2017 | 1.34 | 2.49 |
| 2018 | 1.26 | 2.61 |
| 2019 | 0.97 | 2.53 |
| 2020 | 0.79 | 2.38 |
5.5.2 Hole in the Ozone Layer
5.5.2 Hole in the Ozone LayerThe earth’s ozone layer protects life from harmful radiation from the sun. Ozone is comprised of three oxygen molecules bonded together. Without this layer of protection, too much UV light would hit the earth’s surface, resulting in damage to crops and increased skin cancer and cataract rates in humans.
In the 1970’s scientists discovered that some chemicals such as: chlorofluorocarbons (CFCs), hydrochlorofluorocarbons (HCFCs), carbon tetrachloride, and methyl chloroform were depleting the ozone layer. These chemicals were often found in refrigerants, fire suppressants, foam insulation and aerosols.
In 1985 the Vienna Convention on the protection of the ozone layer formalized international cooperation to find a solution. The Montreal Protocol on Substances that Deplete the Ozone Layer was an international agreement signed in 1987 which phased out the use of these ozone depleting chemicals on a global scale. The positive impact of this international agreement is why many of you may have never heard of the hole in the ozone layer. For earlier generations (those born in 1970-1990s) would have grown up learning about this in environmental issue beginning in elementary school. Thanks to the Montreal Protocol and international cooperation, the hole in the ozone layer is on track to be fully recovered by 2040.
Video: 2025 Ozone Hole Update (No Narration, Set to Music) (0:48)
Note: The video has music in the background but no spoken words.
Transcript: 2025 Ozone Hole Update
[Music]
Text Onscreen: This year, the ozone hole over Antarctica reached its annual maximum extent on September 9th, 2025, with an area of 8.83 million square miles (22.86 million square kilometers.)
The average size of the ozone hole between September 7 and October 13 this year was the 5th-smallest since 1992— when the Montreal Protocol began to take effect.
NASA and NOAA previously ranked ozone hole severity using a time frame dating back to 1979, when scientists began tracking Antarctic ozone levels with satellites. Using that longer record, this year’s hole area ranked 14th smallest over 46 years of observations.
The annual maximum extent of the ozone hole can vary year to year due to weather, but the multi-decadal record shows that the ozone layer appears to be slowly recovering and is on track to rebound by later this century.
5.5.3 Lead (Pb)
5.5.3 Lead (Pb)Lead was added to gasoline in the 1920’s to reduce “knocking” and improved fuel efficiency. But lead proved to be a toxic pollutant, having a major effect on the cognitive development of children. Many countries began phasing out the use of leaded gasoline in the 1970s, which is why you still find signs indicating “unleaded gasoline” at the gasoline pump today. Japan was the first country to entirely ban leaded gasoline in 1986. The US and Canada banned it in 1996.
For more information on the phase of Lead in gasoline: Please read this article.
Did you know, Algeria was the last country to finally ban leaded gasoline, but it wasn’t until 2021!
Use the slider at the bottom of the Map to see how and when lead was phased out of on road fuels!
5.6 Nuclear Waste
5.6 Nuclear WasteNuclear power plays a significant role in the U.S. energy mix, providing about 18–19% of the US’s electricity in 2024, and roughly 9–10% of global electricity generation
Like coal or natural gas plants, nuclear facilities generate electricity by heating water to create steam that spins a turbine. The key difference is the heat source: nuclear plants use fission—splitting atoms of uranium or plutonium—rather than burning fossil fuels. This process produces no direct carbon emissions during operation, but it does generate radioactive waste, primarily in the form of spent nuclear fuel rods that remain hazardous for thousands of years.
In the United States and most countries, spent nuclear fuel is not recycled. While reprocessing—chemically separating usable materials from waste—is technically feasible and practiced in a few nations like France, the U.S. has maintained a policy against commercial reprocessing since 1977 due to cost, proliferation concerns, and technical challenges
As a result, spent fuel is treated as high-level waste and must be safely stored until its radioactivity decays to safe levels. Radioactive materials are classified by hazard: low-level waste (contaminated tools, clothing) requires minimal shielding, while high-level waste (spent fuel) demands robust, long-term isolation. Because some isotopes have half-lives spanning millennia—meaning it takes that long for half their radioactivity to decay—storage solutions must be secure for geological timescales.
Currently, all commercial nuclear waste in the U.S. is stored on-site at power plants. After removal from reactors, spent fuel rods are first cooled in water-filled pools for several years. Once sufficiently cooled, they are transferred to dry cask storage: sealed steel cylinders encased in concrete or steel structures, designed to withstand earthquakes, floods, and other hazards

These casks are monitored and maintained above ground, with the expectation that a permanent deep geological repository—such as the long-proposed Yucca Mountain site—will eventually provide a final solution. However, political and technical debates have delayed such a facility for decades, leaving interim storage as the de facto national strategy.
Even with secure containment, nuclear waste management raises important questions about intergenerational responsibility, environmental justice, and energy policy trade-offs. While nuclear power offers reliable, low-carbon electricity, its waste legacy requires careful planning, transparent decision-making, and sustained investment. As we evaluate energy options for a sustainable future, understanding both the benefits and challenges of nuclear power—including how we steward its waste—is essential for informed citizenship and engineering innovation.
5.7 Water Use in Energy Production
5.7 Water Use in Energy ProductionWater and energy are deeply interconnected in what scientists call the water-energy nexus. In the twentieth century alone, global energy use grew ten-fold while water use grew six-fold, and both continue to rise with population growth and increasing affluence. Understanding water use in electricity generation requires distinguishing between water withdrawal (water removed from a source) and water consumption (water that is evaporated, transpired, or otherwise not available for immediate reuse). Electricity is the fastest-growing form of energy, making water consumption across different generation methods—typically measured in liters per megawatt-hour (L/MWh)—a critical metric for sustainable energy planning.
The water intensity of electricity generation varies dramatically across different technologies. Wind and solar photovoltaic (PV) systems have the lowest water consumption because they require no cooling; their minimal water use occurs upstream during mining and manufacturing of components, plus occasional panel cleaning. In contrast, thermal power plants (coal, natural gas, nuclear, and biomass) require substantial water for cooling, depending on the cooling technology. Hydropower and biomass show the widest ranges: hydropower averages can appear high due to reservoir evaporation, while biomass water use depends heavily on whether feedstock crops are rain-fed or irrigated.
For thermal power plants, which account for over 70% of utility-scale electricity generation, the cooling system type is the primary determinant of water use. Once-through cooling draws water from rivers or lakes, passes it through the plant once, and returns it—resulting in high withdrawal but relatively low consumption. However, this method creates thermal pollution, returning water at higher temperatures that reduces oxygen levels and severely disrupts aquatic ecosystems. Wet cooling (recirculating) systems use cooling towers where heat dissipates through evaporation, reducing withdrawal but increasing consumption as water is lost to the atmosphere. Dry cooling systems use no water for cooling, relying instead on air conduction and convection, but they are more expensive and less efficient than wet systems.
Hydropower and biomass present unique water challenges. While water flowing through hydroelectric turbines isn't considered consumptive (it remains available downstream), large reservoirs significantly increase surface area and evaporation rates, creating consumptive losses that vary widely by location and climate. Similarly, biomass electricity consumes substantial water through crop irrigation, plant transpiration, and processing—with irrigated crops using dramatically more water than rain-fed alternatives. These site-specific factors make average water consumption estimates for both hydropower and biomass highly variable and context-dependent.
Even when water isn't consumed, energy production still impacts the environment. Thermal power plants using once-through cooling return warmed water to rivers and lakes, creating thermal pollution that degrades aquatic habitats. Nuclear plants are often sited near large water bodies specifically to access cooling water, concentrating environmental impacts in those ecosystems. As climate change intensifies droughts and water scarcity, the water-energy nexus becomes increasingly critical: choosing low-water technologies like wind and solar PV isn't just about reducing emissions—it's about building resilient energy systems that can operate sustainably in a water-constrained future.
5.8 Conclusion
5.8 ConclusionAs we’ve explored in this lesson, every energy source carries environmental trade-offs. Fossil fuel combustion releases pollutants that impact air quality, human health, and global climate. Thermal power plants draw and consume vast quantities of water, with cooling system choices dramatically shaping local ecosystems. Nuclear power offers reliable, low-carbon electricity but requires secure, long-term management of radioactive waste. And while renewables like wind and solar PV minimize operational water use and emissions, their manufacturing, land use, and material supply chains still carry environmental footprints. The key insight isn’t that any single technology is perfect, but rather that informed energy decisions require weighing impacts across multiple dimensions.
Yet this lesson also demonstrates that environmental challenges are not insurmountable. The successful global phaseout of ozone-depleting chemicals and the dramatic reduction of acid rain-causing sulfur emissions prove that science, technology, and coordinated policy can drive real progress. These achievements weren’t built on waiting for flawless solutions—they emerged from iterative innovation, regulatory frameworks, and public engagement. Today, that same collaborative approach is guiding efforts to decarbonize grids, deploy water-smart cooling systems, advance nuclear waste stewardship, and scale renewable integration.
As you move forward in this course, keep the water-energy-emissions-waste nexus in mind. Energy choices ripple through ecosystems, economies, and communities, and understanding those connections is essential for designing resilient, equitable systems. In our next unit, we’ll shift from assessing impacts to exploring energy efficiency and demand-side solutions—because the cleanest, most affordable, and lowest-impact energy is often the energy we never have to generate. Reflect on how the trade-offs we’ve discussed might shape infrastructure planning, policy debates, or your own career path in the evolving energy sector.
Lesson 6: Appliances
Lesson 6: AppliancesThe links below provide an outline of the material for this lesson. Be sure to carefully read through the entire lesson before returning to Canvas to submit your assignments.
6.1 Lesson 6 Introduction
6.1 Lesson 6 IntroductionWelcome to the Appliances Lesson
This lesson is one of the most impactful you'll complete in this course. Why? Because appliances are a major source of residential energy use, and unlike home insulation or heating systems, you have direct control over them every day. Your choices in purchasing and using appliances can significantly lower your energy bills and reduce your environmental footprint.
What We Will Cover
In this module, we will explore the basic operating principles and energy drivers of the major "big-ticket" appliances in your home:
- Refrigerators
- Clothes Washers and Dryers
- Dishwashers and Cooking Appliances
(Note: Water heaters are also a major energy user, but we will cover those in depth in Lesson 7.)
We won't just look at how to use these appliances; we'll examine how they work and what governs their energy consumption. Understanding the mechanics behind the machine is the first step to using it efficiently.
Key Skills: Making Smart Purchasing Decisions
When you are ready to buy your own appliances, how will you choose the best model? We will teach you how to:
- Read EnergyGuide Labels: Learn to interpret the yellow labels on appliances that estimate annual energy use and operating costs.
- Compare Models: Evaluate multiple options to determine which offers the best value.
- Calculate Life Cycle Cost (LCC): Learn to look beyond the purchase price. We will show you how to calculate the total cost of ownership—including energy use over the appliance's lifetime.
- Determine Simple Payback: Is it worth paying $500 more upfront for a model that saves $50 a month? We'll teach you the math to find out how long it takes to recover that extra cost.
What to Expect
Throughout this lesson, you will encounter specific energy efficiency terms and acronyms. Pay close attention to these, as they are essential for reading labels and performing cost-benefit analyses. The calculations for Life Cycle Cost and Payback Period are the core concepts of this module—and skills you will use for years to come.
By the end of this lesson, you will be equipped to choose appliances that are not only cheaper to operate but also friendlier to the environment. Let's get started.
Learning Objectives
By the end of this lesson, you will be able to:
- Explain the basic operating principles and primary energy drivers of major residential appliances, including refrigerators, clothes washers, dryers, dishwashers, and cooking appliances.
- Interpret EnergyGuide labels to extract and compare key information about annual energy consumption, estimated operating costs, and efficiency ratings across different appliance models.
- Calculate Life Cycle Cost (LCC) and Simple Payback period using purchase price, annual energy use, utility rates, and expected lifespan to determine the total cost of ownership for competing appliance models.
- Evaluate and compare multiple appliance models using efficiency metrics, energy consumption data, and cost-benefit analysis to make informed, economically sound purchasing decisions that balance upfront costs with long-term savings and environmental impact.
6.2 Appliance Energy Consumption
6.2 Appliance Energy ConsumptionWhat appliances in your home use the most energy?
Some appliances may use a lot of power but not a lot of energy? Some appliances use of lot of energy, but not so much power. How is that true?
Remember back to lesson 2 and the difference between power and energy. We saw some examples of looking at power ratings on a laptop charger at 100 Watts. Everything you plug in has a power rating, usually in Watts. Some items use a big power draw, like hair driers, toasters and microwaves, but we don’t use it for very long. Microwaves are typically rated in 800 -1500 Watts, but most of us only use them for a few minutes at time. So while their power draw may be large, the total energy used (in a day or week) may be rather small. Same is true for Toasters. How many minutes do you really use your toaster in any given week?
General rule: Things are designed to get hot tend to use a lot of power. Eg. Toaster, Microwave, Water Boiler, space heater ect.

Data Table for the Residential Electricity Consumption by End Use figure
The costs of the appliances in your home depend on how often they are used and what utility rates you pay. The average home in the US uses about 11,000 kWh of electricity per year.
Heating and cooling take on a large amount in most household’s energy use, so we will discuss them more in Lessons 9 and 10. Additionally, Water Heating is usually about 12% of an average household energy use, so we will discuss them specifically in Lesson 7.
6.3 Energy Guide Labels
6.3 Energy Guide LabelsAll major home appliances must meet the Appliance Standards Program set by the US Department of Energy (DOE). Manufacturers must use standard test procedures developed by DOE to prove the energy use and efficiency of their products. Test results are printed on yellow Energy Guide labels (pictured below) which manufacturers are required to display on many appliances. This label provides the necessary information to perform a Life Cycle Analysis when comparing different models.
Instructions: View detailed descriptions about the information found on Energy Guide labels.

Energy Guide Labels.
The image is a yellow rectangular energy guide label with black text, used to provide energy efficiency information. At the top, it features the heading "ENERGYGUIDE" with an arrow pointing downward, indicating important information about energy use. Below this are two sections: on the left, details such as “Refrigerator-Freezer,” “Automatic Defrost,” “Side-Mounted Freezer,” and “Through-the-Door Ice” are listed; on the right, “XYZ Corporation - Model ABC-L,” “Capacity: 23 Cubic Feet” is specified. In the center, a highlighted section titled “Estimated Yearly Operating Cost” shows a large bold figure of "$67," representing the annual cost. Below, a horizontal bar labeled “Cost Range of Similar Models” shows arange from $57 to $74. Below this section, “630 kWh Estimated Yearly Electricity Use” is prominently marked in bold with a white background. Additional notes surround the main content, explaining the details of the cost estimates, the significance of the cost range, and utility rates. A small ENERGY STAR logo is in the bottom right, indicating environmental benefits. Black dotted lines and text boxes aid in navigating the information.
The Federal Trade Commission's Appliance Labeling Rule requires appliance manufacturers to put these labels on refrigerators, freezers, dishwashers, clothes washers, water heaters, furnaces, boilers, central air conditioners, room air conditioners, heat pumps, and pool heaters. The law requires that the labels specify:
- the capacity of the particular model—for refrigerators, freezers, dishwashers, clothes washers, and water heaters;
- the energy efficiency rating and the estimated annual energy consumption of the model—for air conditioners, heat pumps, furnaces, boilers, and pool heaters;
- the range of estimated annual energy consumption, or energy efficiency ratings, of comparable appliances.
How to Use the Labels
A worksheet on how to use the labels in choosing a cost-effective and environmentally friendly appliance is given below.
| General Information | |
|---|---|
| 1. Are the appliances comparable in size and features? | Answer has to be yes |
| 2. What is the price of the more energy- efficient model? | $ ________ |
| 3. What is the price of the less energy-efficient model? | $ ________ |
| 4. What is the price of electricity in your region? | $ ________ / kWh |
| 5. How long do you expect to keep the appliance? What is the life of the Appliance? | ________ |
We will discuss more about using the Energy Guide labels when we cover Life Cycle Cost Analysis later in this lesson.
6.4 Refrigerators
6.4 RefrigeratorsIt might seem like your refrigerator works by "making things cold," but physically, it does the opposite. A refrigerator is a heat mover. Its job is to extract thermal energy from the cool interior and push it out into the warmer kitchen.
Because heat naturally wants to flow from hot to cold, moving it in the reverse direction requires work—and that work requires electricity

Text description of the Refrigeration Cycle image.
The image illustrates a diagram of the refrigeration cycle, divided into two sections representing low and high pressure. On the left, the blue section is labeled "Low Pressure" and depicts cool liquid flowing through a coiled tube, marked as the evaporator. Snowflake symbols and the text "COOL AIR" are included to signify cooling. On the right, the orange section is labeled "High Pressure" and shows hot liquid moving through a similar coiled tube, designated as the condenser, accompanied by red circles and the text "HOT AIR" to indicate heating. At the center of the diagram, a compressor connects the two sections, with arrows indicating the flow direction. An expansion valve is positioned between the evaporator and condenser, illustrating the complete cycle.
The principle of operation of a refrigerator is similar to an air conditioner. It moves the heat energy from inside to outside. There are four basic components in a refrigerator and their functions are as follows:
- The expansion valve acts like a nozzle. High-pressure liquid refrigerant squeezes through it and suddenly expands into a low-pressure zone. Key physics: When a fluid expands rapidly, its temperature drops. This is the same reason aerosol cans feel cold when sprayed. Now the refrigerant is cold and ready to absorb heat.
- Evaporator - These are the coils you might see inside the freezer or behind the back panel. The cold, low-pressure refrigerant flows through them and evaporates (turns from liquid to gas). Why this matters: Evaporation requires energy. The refrigerant steals that energy as heat from the air and food inside the fridge. Result: Your food cools down, and the refrigerant warms up as it carries that heat away.
- Compressor - This is the refrigerator's 'engine'—and the part that uses the most electricity. The compressor squeezes the now-warm refrigerant gas, increasing its pressure and temperature dramatically (think of pumping up a bike tire: the pump gets hot). This compression step requires significant electrical work. The refrigerant leaves the compressor hotter than the kitchen air, so it can now release its heat outward.
- Condenser - These are the black coils you might feel on the back or bottom of your fridge. The hot, high-pressure refrigerant flows through them. Because the refrigerant is now hotter than the kitchen air, heat naturally flows out of the coils and into the room. The refrigerant condenses back into a liquid, ready to repeat the cycle. Why you feel warmth: That heat you sometimes feel near your fridge? That's the heat originally taken from your food, plus the energy used by the compressor."
How Does a Refrigerator Work?
Video: How does a Refrigerator Work? (3D Animation) (4:10)
Transcript: How does a Refrigerator Work? (3D Animation)
Introduction to Cooling
Narrator: Have you wondered how the refrigerator in your home works? Refrigerators which have become an integral part of every household works on some simple and scientific principles starting from a simple and basic model this video will elaborate on the workings of a modern refrigerator and its High Energy Efficiency. Simply a cold liquid is continuously passed inside the refrigerator around the object to be cooled. Now, let's see how this continuously moving cold liquid is achieved inside the refrigerator.
Throttling and Evaporation
The most crucial component of the refrigerator is a device named throttling device. Here a capillary tube with a small diameter is taken as the throttling device and cold water is produced from the throttling phenomenon.
For effective throttling, the refrigerant should be in a liquid state at high pressure. The throttling device is a huge obstruction to the flow so a huge pressure drop occurs when liquid passes through the throttling device. Due to the drop in pressure, the boiling point of the liquid drops and turns it into vapor. The energy reuired for the refrigerant liquid to evaporate comes from the refrigerant so its temperature drops.
Now we have converted the room temperature liquid at high pressure to cold and low pressurized vapor but the thing to be noted is that only a small portion of the liquid is evaporated. Then the liquid is passed through the object to be cooled. During the heat absorption proces, the refrigerant further evaporates and all the remaining refrigerant turns into pure vapor.
Temperature Management
Since there is a change of phase in the period, the temperature of the liquid does not change. This heat exchange system is called evaporator.
The Refrigeration Cycle
By the clever use of evaporator fans inside the refrigerator, one can maintain different temperature levels inside the refrigerator so we have achieved the refrigeration effect inside of our refrigerator. Now, if we can convert the cold low pressure vapor into the state before that is high press liquid, we will be able to repeat the same process again.
Compression and Condensation
Now at first, we have to convert the low press vapor into high press vapor and for that we use a compressor as you can see that a reciprocating type compressor is used here. However, the compressor is also compressing gas with pressure so the temperature inevitably rises.
Now we've converted the refrigerant into high pressure vapor. To convert the vapor into a liquid state, we introduce another heat exchanger which is fitted outside of the refrigerator. Thus, it will liberate heat to the surroundings and its temperature will reach its normal level. This heat exchanger is known as a condenser.
Now the refrigerant is back in its normal state so it can be fed into the throttling device again. Just by repeating this process again and again we will be able to achieve a continuous cooling effect. This is the most basic refrigerator ever. This refrigerator will work perfectly in theory but in practice we will experience different sorts of issues.
Defrosting Mechanisms
Now, let's see what these issues are and how to overcome them. One major issue is the frost developed in the freezer compartment. The air in the compartment has moisture content which will turn into frost when it comes in contact with the evaporator coil.
Such ice coating prevents further heat exchange and the refrigerator becomes inefficient over time. To overcome this issue heating rods are used to remove the frost produced and the condensate is collected in the refrigerator somewhere near the compressor.
Modern Refrigerator Design
Moreover, in modern refrigerators you won't be able to see the condenser fins on the back of the refrigerator. Instead, they use a compact condenser system that uses a cooling fan and the same heat rejection system is achieved here. Cold air cools the hot high pressure vapor and returned to the throttling device.
In modern refrigerators, you may not see the throttling device as presented here because the throttling device can also have a long wire shape instead of a curly spring shape. A filter dryer is used to remove any moisture content present in the refrigerant that might become trapped in the compressor operation.
We hope this video gave you a clear insight into the workings of a modern refrigerator. Thanks for watching the video.
Did you know that different refrigerator styles have different energy efficiencies? For decades, the only common design was the top-freezer model. But is that design the most efficient?
Contrary to popular belief, the answer is no. The most efficient configuration is typically a refrigerator with the freezer on the bottom. This is because of how air moves: warm air rises and cold air sinks. A bottom-freezer design takes advantage of this natural behavior to conserve energy.
Below is an image of the most common types of refrigerators available, along with their relative efficiencies.

Text description of the Refrigerator Types image.
A horizontal infographic compares four refrigerator configurations by energy efficiency, from most to least efficient. Each refrigerator is shown as a simplified blue illustration above a black-to-gray horizontal bar and a two-line label.
From left to right:
- Bottom Freezer: A light-blue refrigerator with a darker blue freezer compartment across the bottom and a horizontal handle. It is labeled “Most efficient” and “Uses least energy.”
- Four Door: A refrigerator divided into four compartments, with two light-blue upper doors and two darker blue lower doors. Each door has a vertical handle. It is labeled “More efficient” and “Uses less energy.”
- Top Freezer: A refrigerator with a dark-blue freezer compartment across the top and a larger light-blue compartment below, each with a vertical handle. It is labeled “Less efficient” and “Uses more energy.”
- Side-by-side: A vertically divided refrigerator with a dark-blue compartment on the left and a light-blue compartment on the right, each with a vertical handle. It is labeled “Least efficient” and “Uses most energy.”
6.4.1 Energy Efficiency of a Refrigerator
6.4.1 Energy Efficiency of a RefrigeratorMost of the energy used by a refrigerator is used to pump heat out of the cabinet. A small amount is used to keep the cabinet from sweating, to defrost the refrigerator, and to illuminate the interior.
The efficiency of a refrigerator is based on the energy consumed per year for a given size. The efficiency of a refrigerator is expressed in volume cooled per unit electric energy per day. Volume is measured in cubic feet and electrical energy is measured in kilowatt-hours.
The energy efficiency of refrigerators and freezers has improved dramatically over the past three decades. The most energy efficient refrigerator of 2025 was a Samsung RS24T5202. It has the capacity of most other models (27.4 ft3), but uses only 546 kWh/year.
You can explore more types of energy efficient appliances on the energy star website. Also, Energy Star as a calculator to determine how much energy you could save by upgrading your current fridge to one that is more efficient!
Energy Guide Labels
Refrigerators now come with an EnergyGuide label that tells you in kilowatt-hours (kWh) how much electricity a particular model uses in a year. The smaller the number, the less energy the refrigerator uses and the less it will cost you to operate.
- Full-sized refrigerators that exceed the federal standard by 15% or more (and full-sized freezers that exceed it by 10%) qualify for the ENERGY STAR label.
- Compact refrigerators and freezers must exceed the standard by 20% to qualify for ENERGY STAR.
How to keep your refrigerator running efficiently
- Keep your refrigerator or freezer at the following temperatures: 37–40°F for the fresh food compartment of the refrigerator, 0–5°F for the freezer section. Use a thermometer to check inside temperatures.
- Regularly defrost manual-defrost refrigerators and freezers; don't allow frost to build up more than 1/4 inch.
- Make sure your refrigerator and freezer door seals are airtight. Check the seal on door gaskets periodically by closing the door on a dollar bill. If it pulls out easily, you may need a new gasket.
- Keep the doors closed as much as possible and make sure they are closed tightly.
- To ensure proper cooling of its contents, don't crowd food items. Too many dishes obstruct air circulation.
- Cover liquids and wrap foods stored in the refrigerator. Uncovered foods release moisture and make the compressor work harder.
- Replace paper wrappings on food items with aluminum foil or plastic wrap. Paper is an insulator.
- Placement of the refrigerator is very important. Direct sunlight and close contact with hot appliances will make the compressor work harder. More importantly, heat from the compressor and condensing coil must be able to escape freely, or it will cause the same problem. Don't suffocate the refrigerator by enclosing it tightly in cabinets or against the wall.
- Regularly brush off or vacuum the refrigerator coils on the back or bottom of the unit.
- Because most refrigerators reject heat from the bottom and/or back, they need adequate clearance to allow sufficient airflow. While no specific studies have been done to calculate the optimum clearance space, one general rule-of-thumb is to double the space recommended by manufacturers for refrigerator installation. Another rule-of-thumb is to allow 2 inches of air flow around the refrigerator.
- Don't keep that old, inefficient fridge running day and night in the garage for those few occasions when you need extra refreshments. A 15-year-old refrigerator could cost $100–$150 per year.
6.5 Clothes Washers
6.5 Clothes WashersEnergy Use in Clothes Washers and Dryers
Clothes washers and dryers together account for approximately 10 percent of residential energy consumption. However, the majority of this energy is consumed by the washer, specifically for heating water.
- Water Heating: An estimated 85–90 percent of the energy used by a clothes washer goes toward heating the water.
- Mechanical Operation: Only 10–15 percent of the energy is used by the washer's motor and controls to agitate and spin the clothes.
A typical household completes nearly 300–400 loads of laundry per year. A conventional washer uses approximately 40 gallons of water per load. Therefore, the most effective way to reduce energy consumption in laundry is to reduce hot water use.
How Clothes Washers Work
The basic principle of cleaning clothes has remained unchanged for centuries: wet the garment, agitate it to loosen dirt from the fibers, and rinse the dirt away with fresh water. While early methods involved pounding garments with stones, modern machines use mechanical agitation and heated water to improve cleaning efficiency.
What has changed over time is the method of agitation. Today, there are two primary types of clothes washers available to consumers:
- Vertical Axis (V-Axis): Commonly known as top-loading washers.
- Horizontal Axis (H-Axis): Commonly known as front-loading washers.
.png)
Text description of the Sketch of front-loading and top-loading washing machines.
The image features a comparison between two types of washing machines: a front-loading machine on the left, labeled "A," and a top-loading machine on the right, labeled "B."
On the left, "A" is a front-loading washer with a circular door and a view of the interior drum. The diagram indicates a "Tumble" action with a curved arrow encircling the drum. The water level reaches just below the laundry.
On the right, "B" is a top-loading washer shown as a cylinder filled over halfway with water, with laundry floating inside. An agitator is present in the center, indicated by arrows showing "Agitation." The water level is significantly higher compared to the front-loading washer.
Comparing Washer Types
Vertical Axis (Top-Loading) Most clothes washers historically produced for the U.S. market are vertical axis (V-axis) models with a central agitator. In these machines, clothes are suspended in a tub filled with water for both washing and rinsing. Because the tub must be filled completely to cover the clothes, these models generally use more water and, consequently, more energy to heat that water.
Horizontal Axis (Front-Loading) Horizontal axis (H-axis) washers are common in Europe and are becoming increasingly popular in the United States. Instead of an agitator, these machines tumble the load repeatedly through a small pool of water at the bottom of the drum.
- Efficiency: This tumbling action reduces the need for water, which directly reduces the energy required to heat it.
- Potential Savings: Estimates show that replacing conventional V-axis washers with H-axis designs could save a significant quantity of energy and water nationwide.
Features of Front-Loading Washers
Front-loading washers or tumble-action machines lift and drop clothes rather than moving them around a central axis. They often include advanced features to optimize energy and water use:
- Auto Temperature Control: The machine mixes hot and cold water to reach a preset "warm" or "cold" temperature. This ensures the water is warm enough for detergent to dissolve effectively, even when incoming tap water is very cold (such as during winter).
- Smart Water Levels: High-end models sense the load size and automatically adjust the water level. Most machines, even basic models, offer multiple water level settings to prevent waste.
- High-Pressure Rinses: To reduce water consumption, these machines often spray clothes with high-pressure rinses to remove soap residue rather than soaking them in a full tub of rinse water.
- Capacity: Front loaders generally hold more clothes than top loaders because they do not require space for a central agitator. This allows for larger loads, potentially reducing the total number of cycles needed per week.
Consumer Actions for Energy Conservation
Consumers have significant power to reduce energy use through their laundry habits and purchasing choices.
Operational Tips:
- Wash Full Loads: Washers are most efficient when operated at full capacity.
- Use Cold Water: Washing clothes in cold water conserves significant energy (by avoiding water heating) and is recommended for colored and delicate fabrics.
Purchasing Tips:
- Consider Front Loaders: Since they use less water, they require less energy to heat that water. The most efficient front loaders use less than half the amount of water used by average top loaders. These models use 45% less energy and 50% less water than top load impeller washers.
- Look for ENERGY STAR®: Purchase washing machines with the ENERGY STAR designation. ENERGY STAR certified clothes washers use 14 gallons of water per load versus 20 gallons in a standard machine.
6.6 Clothes Dryers
6.6 Clothes DryersA clothes dryer removes moisture from wet laundry by tumbling clothes in a rotating drum while circulating hot air. The process works in three simple steps:
- Heat: Air is heated and blown into the drum.
- Tumble: A motor rotates the drum at a slow speed, tumbling the clothes to expose all surfaces to the warm air.
- Vent: The hot, humid air picks up moisture from the clothes and is vented outside the house.
Types of Clothes Dryers
Clothes dryers are powered by one of two energy sources:
Understanding Dryer Efficiency: The Energy Factor
Unlike refrigerators or washing machines, clothes dryers are not required to display EnergyGuide labels, and energy consumption does not vary dramatically among comparable models. However, efficiency is still measured using a metric called the Energy Factor (EF).
- What is Energy Factor?
Think of it like "miles per gallon" for your car—but for dryers, it measures pounds of clothing dried per kilowatt-hour (kWh) of energy used. - Minimum Standards:
- Standard electric dryer: EF ≥ 3.01 lbs/kWh
- Standard gas dryer: EF ≥ 2.67 lbs/kWh
(Note: Gas dryer ratings are still expressed in kWh for comparison purposes, even though natural gas provides the heat.)
Because most energy goes to heating—not mechanics—two dryers with similar capacity and features will typically use similar amounts of energy. Your usage habits matter more than the model you choose.
Clothes Dryers: How to save Energy and Money
You can significantly reduce energy use through proper installation, maintenance, and smart laundry habits.
Installation & Venting
- Place your dryer in a conditioned space. Locating it in a cold, damp basement forces the dryer to work harder to heat incoming air.
- Vent properly. Use the shortest, straightest metal duct possible to exhaust air outside. Avoid flexible vinyl ducts—they restrict airflow, can crush easily, and may not withstand high temperatures.
- Seal the exterior vent. Check that the outdoor exhaust flap closes tightly. A loose vent lets cold air leak in (raising heating bills) or warm air escape (raising cooling bills).
Maintenance
- Clean the lint filter after every load. This improves airflow, reduces drying time, and lowers fire risk.
- Inspect the vent hood regularly. Remove lint buildup from the exterior vent to maintain proper airflow.
Smart Usage Habits
- Dry full loads—but don't overload. Full loads maximize efficiency; overloaded drums restrict airflow and extend drying time.
- Sort clothes by fabric type. Lightweight synthetics dry faster than heavy towels or denim. Drying similar items together prevents over-drying some items while waiting for others to finish.
- Dry consecutive loads. The dryer retains heat between cycles, so drying multiple loads in a row uses less energy than spreading them out.
- Use the cool-down (permanent press) cycle. This allows clothes to finish drying using residual heat, saving energy and reducing wrinkles.
- Air-dry when possible. In good weather, hang clothes outside or on an indoor rack. This is the ultimate energy saver—zero electricity or gas used.

6.7 Dishwashers
6.7 DishwashersA dishwasher is a machine that is used to clean dishware, cookware, and cutlery automatically. Unlike manual dishwashing, which relies on physical scrubbing to remove residue, the mechanical dishwasher cleans by spraying hot water with soap via rotating sprayers.
The Efficiency Revolution:
A common misconception is that hand-washing dishes is always more environmentally friendly than using a dishwasher. For modern dishwashers, this is no longer true. Advances in technology have dramatically reduced both water and energy consumption, making an efficient dishwasher the lower-impact choice for most households.
Age Matters: How Efficiency Has Improved
The age of your dishwasher is the single biggest factor in its energy consumption. Federal standards and ENERGY STAR certification have driven remarkable improvements:
| Dishwasher Age | Annual Energy Limit | Key Standard/Program |
|---|---|---|
| Pre-2004 Models | Up to 800 kWh/year | No federal efficiency standard |
| 2004–2012 Models | ≤ 467 kWh/year | DOE minimum standard implemented |
| 2013+ Models | ≤ 307 kWh/year | Updated DOE standards |
| ENERGY STAR Certified | ≤ 270 kWh/year | Voluntary certification (25%+ more efficient) |
Water Usage Comparison
Water use directly impacts energy consumption because heating water requires significant power. Here's how different methods compare for a full load of dishes:
| Method | Water Used | Energy for Water Heating* |
|---|---|---|
| Modern ENERGY STAR Dishwasher | 3–4 gallons | ~0.4 kWh |
| Older Dishwasher (pre-2004) | 10–15 gallons | ~1.5 kWh |
| Hand Washing (running tap) | Up to 27 gallons | ~2.8 kWh |
*Assumes water heated from 50°F to 140°F
Total Energy Consumption: The Full Picture
When we account for both appliance operation and water heating, the advantage of modern dishwashers becomes clear:
Result: Hand washing typically uses 25–30% more total energy than using an efficient modern dishwasher.
Purchasing for Efficiency: What to Look For
When shopping for a new dishwasher, the ENERGY STAR label is your best guide. These models are certified to use at least 25 percent less energy than the federal minimum standard.
Key Features for Maximum Efficiency
| Feature | Why It Matters |
|---|---|
| ENERGY STAR Certification | Guarantees ≤270 kWh/year; saves water and energy |
| Soil Sensors | Automatically adjust cycle length and water use based on how dirty dishes are |
| Eco/Normal Cycle Options | Eco cycles use 30–40% less energy than intensive cycles |
| Air-Dry or Fan-Dry Option | Eliminates energy used by electric heating element for drying |
| Delay-Start Timer | Run during off-peak hours to reduce electricity costs |
| Booster Heater | Allows home water heater to be set lower (120°F) while still achieving effective wash temperature |
Size Considerations
- Standard Capacity (24-inch): Best for households of 4+ people; most efficient per dish when fully loaded.
- Compact (18-inch): Uses less water per cycle but may require more frequent run, potentially increasing total energy use for larger households.
Your Power to Save: Smart Dishwasher Habits
Even the most efficient dishwasher can waste energy if used poorly. Your daily habits have a major impact on overall consumption.
Optimal Usage Timing
- Run During Off-Peak Hours: In areas with time-of-use electricity pricing, running your dishwasher between 9 PM and 7 AM can reduce energy costs by 20–40%. Many modern dishwashers have a “delayed start” button.
- Peak Hours to Avoid: Typically, 1–7 PM on weekdays, when electricity demand (and prices) are highest.
Loading Techniques for Maximum Efficiency
- Fill Completely, But Don't Overcrowd: Dishwashers use roughly the same energy regardless of load size. Maximize each cycle but ensure water can circulate freely around dishes.
- Skip Pre-Rinsing: Modern dishwashers and enzymatic detergents are designed to handle food residue. Scraping plates into the trash or compost is sufficient. Pre-rinsing under hot water can waste up to 20 gallons per load.
- Load Strategically: Place larger items on the sides or back to avoid blocking spray arms. Face soiled surfaces toward the water jets.
Cycle Selection Matters
- Use Eco or Light Cycles: For everyday dishes, these cycles use lower temperatures and less water, saving 30–40% energy versus heavy/pots cycles.
- Turn Off Heat-Dry: Select the air-dry option or simply prop the door open after the final rinse. This simple step saves 15–20% of total cycle energy.
- Avoid "Rinse-Hold": This feature uses extra water and energy to prevent food from drying on dishes. It's rarely necessary if you run full loads regularly.
Maintenance for Peak Performance
Regular maintenance keeps your dishwasher running efficiently and extends its lifespan. Proper care can improve efficiency by 10–15 percent.
Quick Reference: Dishwasher Energy-Saving Checklist
- Choose ENERGY STAR certified models when purchasing
- Run only full loads to maximize energy per dish
- Skip pre-rinsing; just scrape food scraps
- Use Eco or Light cycles for everyday loads
- Turn off heat-dry; use air-dry or open door to finish drying
- Schedule cycles during off-peak hours (if time-of-use pricing applies
- Clean the filter monthly and inspect spray arms quarterly
- Set home water heater to 120°F (if dishwasher has booster heater)
Conclusion
Modern dishwashers represent a significant advancement in home appliance efficiency. By using less water, heating it more effectively, and incorporating smart sensors, today's ENERGY STAR models use far less energy than their predecessors—and often less than hand-washing. However, technology alone isn't enough. Combining an efficient appliance with smart usage habits—like running full loads, skipping pre-rinsing, and selecting eco-cycles—maximizes both energy savings and cleaning performance. Over the lifetime of a dishwasher, these choices can save hundreds of dollars in utility bills and reduce your household's environmental footprint. Remember: the most efficient cycle is the one that cleans effectively without waste.
6.8 Cooking
6.8 CookingEnergy Use in Cooking Appliances
Cooking accounts for approximately 4–5 percent of residential energy consumption. While this is less than heating, cooling, or water heating, cooking habits and appliance choices still impact your household energy bill and environmental footprint.
Most home cooking is done using three primary appliances:
- Stovetop (Range)
- Oven
- Microwave
Understanding how each transfers heat helps you choose the right tool for the job and use less energy.
How Cooking Appliances Work
Different appliances use different methods to transfer energy to your food. Efficiency depends on how much of that energy actually reaches the food versus how much is lost to the kitchen air.
| Appliance | How It Works | Energy Efficiency |
|---|---|---|
| Gas Stovetop | Burns natural gas to create an open flame. Heat transfers to the pot via conduction. | ~40% Efficient. Much of the heat escapes around the sides of the pot. |
| Electric Coil | Electricity heats a metal coil, which transfers heat to the pot. | ~70% Efficient. Better than gas, but slows down when adjusting temperature. |
| Induction Cooktop | Uses magnetic fields to heat the pot directly (the stove surface stays cool). | ~85% Efficient. Fastest and most efficient electric option. |
| Conventional Oven | Heating elements warm the air inside an insulated box. | Moderate. Large volume of air must be heated; heat escapes when door opens. |
| Microwave | Electromagnetic waves excite water molecules in the food directly. | High (for small tasks). Heats food, not the container or air. Very fast. |
Key Features to Look For
- Induction Cooktops: If replacing an electric stove, choose induction. They heat faster and waste less energy than standard electric coils.
- Convection Ovens: These use a fan to circulate hot air. This cooks food more evenly and often allows you to lower the temperature by 25°F or reduce cooking time.
- Proper Size: Choose an oven size that matches your household needs. Heating a large oven for a single meal is inefficient.
- Self-Cleaning Features: Models with better insulation (required for self-cleaning cycles) often retain heat better during normal cooking, though they use extra energy during the cleaning cycle itself.
Your Power to Save Energy: Smart Cooking Habits
Because cooking efficiency relies heavily on how you use the appliance, your daily habits matter more than the model you buy.
Stovetop Efficiency
- Match Pot to Burner: Using a 6-inch pot on an 8-inch burner wastes over 40 percent of the heat. Match the cookware size to the heating element.
- Use Lids: Covering pots traps heat. Water boils faster and food cooks quicker, reducing energy use significantly.
- Flat Bottoms: Ensure pots and pans have flat bottoms so they make full contact with the heating element. Warped pans waste heat.
- Turn Down the Heat: Once water boils or food is hot, turn the burner down to low. High heat rarely cooks food faster once the target temperature is reached.
Oven Efficiency
- Minimize Door Opening: Every time you open the oven door, the temperature can drop by 25°F or more, forcing the heater to work harder. Use the oven light and window to check food.
- Use Residual Heat: Turn the oven off 5–10 minutes before cooking is finished. The remaining heat will finish the job.
- Batch Cooking: Bake multiple items at once (e.g., cookies and casseroles) to maximize the energy used to heat the oven.
- Avoid Preheating (When Possible): Many foods (like casseroles or roasted veggies) don't require a fully preheated oven. Check your recipe.
Appliance Selection (Use the Right Tool)
- Use Small Appliances: For small meals, use a microwave, toaster oven, or slow cooker instead of the full-sized oven. They use 50–75 percent less energy than a conventional oven.
- Microwave for Reheating: Always use the microwave for reheating leftovers or defrosting. It is the most energy-efficient option for these tasks.
- Pressure Cookers: These reduce cooking time for grains and meats by up to 70 percent, saving significant energy.
Quick Reference: Cooking Energy-Saving Checklist
- Match pot size to burner diameter
- Keep lids on pots while boiling
- Use microwave or toaster oven for small meals
- Avoid opening the oven door unnecessarily
- Turn off oven early to use residual heat
- Keep reflector pans (under electric coils) clean and shiny
- Defrost food in the fridge overnight instead of using the microwave
Conclusion
Cooking energy use is driven by heat transfer efficiency. By choosing the right appliance for the task (microwave vs. oven) and adopting simple habits like using lids and matching pot sizes, you can reduce the energy required to prepare meals. While cooking may be a smaller portion of your home energy bill than heating or cooling, these habits add up over time and contribute to a more efficient household.
6.9 Life Cycle Cost Analysis
6.9 Life Cycle Cost AnalysisMaking Smart Appliance Choices
When shopping for a new appliance, the price tag on the shelf isn't the whole story. A Life Cycle Cost (LCC) Analysis helps you compare appliances by looking at the total cost of ownership—not just what you pay today, but what you'll spend on energy over the appliance's entire life.
This simple calculation helps answer an important question: Is it worth paying more upfront for a more energy-efficient model? Often, the answer is yes.
Why Life Cycle Cost Matters
Many energy-efficient appliances cost more to buy—but they use less electricity or gas every day. Over time, those energy savings can add up to more than the extra amount you paid initially.
| Factor | Why It Matters |
|---|---|
| Initial Cost | The purchase price you pay at the store |
| Annual Energy Use | How many kWh (or therms) the appliance uses per year |
| Electricity/Gas Rate | Your local utility cost (e.g., $0.18/kWh) |
| Expected Lifespan | How many years the appliance will last (typically 10–15 years for major appliances) |
Comparison: Which Is the Better Value?
| Refrigerator Model | Initial Cost | 15-Year Energy Cost | Total Life Cycle Cost |
|---|---|---|---|
| Standard Efficient | $1,640 | $1,512 | $3,152.00 |
| Premium High-Efficiency | $1,899 | $950.40 | $2,849.40 |
| Difference | +$259 | –$561.60 | –$302.60 |
Conclusion: Even though the premium model costs $259 more upfront, it saves $561.60 in energy costs over 15 years. The result? A net savings of $302.60 over the appliance's lifetime.
Simple Payback: When Do You Start Saving?
Life Cycle Cost tells you the total savings. Simple Payback tells you when you start seeing those savings.
Simple Payback (years) = Extra Upfront Cost ÷ Annual Energy Savings
For our refrigerator example:
- Extra upfront cost:
$1,899 – $1,640 = $259 - Annual energy savings:
(560 – 352) kWh × $0.18/kWh = 208 kWh × $0.18 = $37.44/year - Simple Payback:
$259 ÷ $37.44/year ≈ 6.9 years
The more efficient refrigerator "pays for itself" in about 7 years. For the remaining 8 years of its lifespan, every dollar saved on energy is pure savings.
Quick Reference: Life Cycle Cost Checklist
Before you buy, ask:
- What is the appliance's annual energy use (check the EnergyGuide label)?
- What is my local utility rate? (Check your bill or utility website)
- What is the expected lifespan? (Typical ranges: refrigerators 10–15 yrs, washers 10–13 yrs, dishwashers 9–12 yrs)
Think long-term:
- A shorter payback period (<10 years) usually means the efficient model is a smart investment.
- Even with a longer payback, consider environmental benefits and rising energy costs.
Key Takeaways
- Life Cycle Cost = Purchase Price + Lifetime Energy Cost
- Energy-efficient appliances often save money over time, even with higher upfront costs
- Simple Payback tells you how many years until savings offset the extra cost
- Always check the EnergyGuide label for annual energy use estimates
- Your local electricity rate matters—higher rates make efficiency even more valuable
6.10 Final Review
6.10 Final ReviewThroughout this lesson, you've explored how the appliances in your home really work—and more importantly, how your choices about them impact both your wallet and the environment. Here are the key takeaways to remember:
- Appliances account for 25–30% of home energy use—and you control them every day.
- Understanding operating principles (like heat transfer, water heating, and compressor cycles) helps you use appliances more efficiently.
- EnergyGuide labels are your shopping tool: They provide standardized data on annual energy use and operating costs to compare models objectively.
- Life Cycle Cost (LCC) analysis reveals the true cost of ownership: Purchase Price + Lifetime Energy Cost. A higher upfront price can still save money long-term.
- Simple Payback tells you when an efficient model starts saving you money—often in just 5–10 years.
- Your habits matter: Running full loads, skipping pre-rinsing, using eco-cycles, and proper maintenance can reduce energy use by 15–40%, regardless of the model you own.
You now have the tools to be an informed consumer and an energy-literate citizen. Whether you're shopping for your first apartment or advising your family, these skills will serve you for years to come.
Lesson 7: Hot Water
Lesson 7: Hot WaterThe links below provide an outline of the material for this lesson. Be sure to carefully read through the entire lesson before returning to Canvas to submit your assignments.
7.1 Lesson 7 Introduction
7.1 Lesson 7 IntroductionWelcome to Lesson 7
Turning on the hot water tap is one of the most routine actions in your daily life, but behind that simple gesture lies a constant exchange of energy. Most homes rely on storage tank water heaters that work around the clock to keep water hot, ready for whenever you need it—even when you're asleep or away. While this convenience ensures you never have to wait for warm water, it also means your heater is constantly consuming fuel to maintain that temperature, contributing to the 12% of home energy use we discussed earlier. In this lesson we will learn about the different types of hot water heaters available on the market and compare their costs and efficiency. In this section, we'll move beyond the basic physics of heating water to understand how real-world usage, heater settings, and household habits directly impact energy consumption and cost. By connecting the formula Q = mcΔT to actual appliance operation, you'll learn how small changes in how you use hot water can lead to significant savings.
Lesson Objectives
- Identify the 6 main types of water heaters
- Calculate the energy consumption required to heat water
- Compare upfront cost vs. annual energy use of different types of hot water heaters
- Evaluate the life cycle cost of different types of hot water heaters
7.2 Water Heaters
7.2 Water HeatersThink about all the places you use hot water in your life. Every time you shower, or wash your hands you are using energy to make that water hot. In this lesson we will learn about the most common types of hot water heaters available on the market.
Types of Water Heaters
In this lesson, you will learn about the main types of Water Heaters on the Market today. Here is a quick rundown of those types.
| Type | Quick Description |
|---|---|
| Storage Tank | Heats and stores water in an insulated tank (most common) |
| On-Demand / Tankless | Heats water only when you need it—no storage |
| Heat Pump (Hybrid) | Moves heat from the air into water (like a fridge in reverse) |
| Tankless Coil | Uses your home's boiler to heat water on-the-fly |
| Indirect | Uses a boiler + separate storage tank for higher efficiency |
| Solar | Uses sunlight + collectors to heat water (with backup system) |
Costs of Water Heaters
Just like other appliances, there are two costs associated with water heaters - initial purchase price and operating costs. Water heaters typically last for about 7-13 years, after which they need to be replaced. Also, each month, you pay for the fuel you use. An energy-efficient model could save hundreds of dollars in the long run in the energy costs and may offset the higher initial purchase price.
It can be compared to automobile mileage—some cars get 15 miles to a gallon, while other, more efficient, vehicles can go 30 miles or more on a gallon of gas. In the same way, some water heaters use energy more efficiently.
One should buy an energy-efficient water heater and spend less money each month to get the same amount of hot water. In this lesson, we will be recalling our "Life Cycle Cost Calculations" that we learned back in Lesson 5 to compare the actual cost of heating hot water in our home.
Typical Water Use at Home
The table below shows typical water use for various purposes at home.
| Use | Gallons per use |
|---|---|
| Shower | 7-10 |
| Bath (standard tub) | 15-20 |
| Bath (whirlpool tub) | 35-50 |
| Clothes washer (hot water wash, warm rinse)** | 7-25 |
| Automatic dishwasher ** | 3-5 |
| Food preparation and cleanup | 5 |
| Personal (hand-washing, etc.) | 2 |
Energy costs increase with water temperature. Dishwashers require the hottest water of all household uses, typically 135ºF to 140ºF. However, these devices are usually equipped with booster heaters to increase the incoming water temperature by 15ºF to 20ºF. Setting the water heater between 120ºF and 125ºF and turning the dishwasher’s booster on should provide sufficiently hot water while reducing the chances for scalding.
**This is for modern (2020s) based appliances. If you are using an older dishwasher or clothes washer, your hot water usage may be much higher!
7.3 Energy Required for Water Heating
7.3 Energy Required for Water HeatingYou use hot water for many things in your daily life, including cooking and bathing. Remember back from Lesson 6, heating water accounted for about 12% of the energy use in your home. So now we are going to calculate how much energy it takes to heat each gallon of water. The amount of energy required depends on what temperature you started with and what temperature you want the water to be, which is our temperature difference. All substances have a heat capacity, which is like it thermal inertia, which tells us how it resists temperature changes. This is why some substances seem to get hot quicker (like a metal spoon versus a wooden spoon.)
For water, the heat capacity, Cp, is 1 BTU/lb oF.
In other words, it takes 1 BTU of energy to raise a pound of water one degree Fahrenheit. (In metric this is 4.184 J/g oC. or 4.184 Joules of energy to raise one gram of water one degree Celcius.)
So the only thing left to know is how much a gallon of water weighs. For reference, one gallon weighs 8.3 pounds. One liter of water weighs 1000 grams.
To calculate the Heat Required to heat water, use the equation below:
Where …
= mass of water heated
= the heat capacity of water (1 BTU / lb ºF)
= temperature difference

Remember to make your units of measurements consistent. Since Cp is measured in pounds, your mass of water heated should be measured in pounds as well. Thus, if you only know the number of gallons, you must convert it into pounds. One gallon of water = about 8.3 pounds, so multiply number of gallons by 8.3 to determine the weight in pounds.
Example 1
It is estimated by the United States Department of Energy that a family of four, each showering for 10 minutes a day, consumes about 700 gal of hot water a week. Water for the showers comes into the home at 55ºF and needs to be heated to 120ºF.
To calculate the heat required, determine the variables:
m = mass of water heated = 700 gallons = 5810 lbs
Cp is the heat capacity of water = 1 BTU/lb ºF (given)
ΔT = temperature difference = 120 ºF – 55 °F
Heat energy required to heat 700 gal can be calculated as follows:
Heat Required = 5,810 lbs × 1 BTU/lb ºF × (120 ºF – 55 ºF)
Heat Required = 5,810 lbs × 65 ºF
Heat Required = 377,650 BTU/week
The heat requirement for one year is :
377,650 BTU/Week × 52 Weeks/Year = 19,637,800 BTU/year
or 5,755 kWh/year. (Remember 1kWh = 3412 BTUs)
Assuming that the natural gas costs $3.5 /MMBTU (1 MMBTU = 1,000,000 BTU) and electricity costs 0.145 per kWh, the annual natural gas costs would be $68.73 while annual electric costs would be $834.54. Clearly, electric hot water is much more expensive than natural gas.
Example 2
Estimate the % energy savings of an electric water heater that heats 100 gallons of per day when the temperature is set back at 110° instead of 120°F. The basement is heated and is at 65°F. The life of the water heater is expected to be about 10 years. Use an appropriate cost for electricity and compare the operating expenses.
Heat required (BTU) = m × Cp × (Temperature Difference)
Where Cp is the heat capacity of water (1 BTU/lb ºF) and m is the mass of the water (Assume 1 gal has 8.3 lb of water and the 3,412 BTU = 1 kWh)
Solution:
Energy required for heating the water to 120°F:
In a year the energy required is:
In a 10-year period, the energy required is 166,622,500 BTU which is equal to 48,834 kWh.
Operating cost over its lifetime is:
Energy required for heating the water to 110°F:
In a year, the energy required is:
In a 10-year period, the energy required is 136,327,500 BTU which is equal to 39,995 kWh .
Operating cost over its lifetime is:
Estimated % Energy Savings:
7.4 Storage Tank Hot Water Heaters
7.4 Storage Tank Hot Water HeatersThe most common type of water heaters use a storage tank type. If you have this type of hot water heater, it is often found in the basement or tucked away in a closet. This about how silly it is to keep your hot water tank in the basement, where it usually coldest in the home. This means the hot water heater has to work harder to heat up the water. Traditionally, they were located in the basement in case of leak, for easy clean up.
Storage or tank-type water heaters are relatively simple devices and by far the most common type of residential water heater used in the United States. They range in size from 20 to 80 gallons, and can be fueled by electricity, natural gas, propane, or oil.
Parts of an Electric Hot Water Heater

Text description of the Electric Hot Water Heater image.
The image is a labeled diagram of a vertical cylindrical water heater with various components numbered and listed. The main body of the heater is shown in a cross-sectional view, revealing the internal parts. The outer shell is gray, with the top and bottom ends colored in blue. On top, component 1 is the cold water valve, and component 3 is the temperature and pressure relief valve. Component 2, labeled as the electric supply, is depicted with wires entering from above. Component 4 is the overflow pipe extending to the side. A vertical yellow pipe inside the cylinder represents component 5, the anti-corrosion anode. Another vertical pipe, component 6, labeled as the dip tube, runs alongside it. Two red rectangular zones within the heater represent the upper and lower heating elements, components 7 and 8, respectively. Component 9, the drain valve, is located near the bottom right side of the heater. Components 10 and 11, the upper and lower thermostats, are indicated on the side next to the heating elements.
Transcribed Text:
- Cold Water Valve
- Electric Supply
- Temperature and pressure relief valve
- Overflow pipe
- Anti-corrosion anode
- Dip tube
- Upper Element
- Lower Element
- Drain valve
- Upper thermostat
- Lower thermostat
Parts of a Gas Hot Water Heater

Text description of the Gas Hot Water Heater image.
The image is a labeled diagram of a water heater, illustrating various parts and their functions. The heater is depicted in a vertical cutaway view, showing interior and exterior components. At the top, an outlet to the chimney is connected to a flue, allowing exhaust gases to escape. A cold water valve is situated at the top left, feeding into the dip tube which runs vertically along the side. Below the flue is a draft-diverter. The body of the heater contains a temperature and pressure relief valve and an overflow pipe, positioned on the left. Inside, an anti-corrosion anode runs along the vertical length. On the right, externally mounted, is an on/off pilot, shutoff valve, temperature control, and gas supply line leading to the burner at the base. A drain valve is also placed towards the bottom right. The thermocouple and air shutter are positioned near the burner to regulate gas flow and ensure safe operation.
Transcribed Text:
- Outlet to chimney
- Flue
- Cold water valve
- Draft-diverter
- Temperature and pressure relief valve
- Overflow pipe
- Anti-Corrosion anode
- Dip tube
- On/Off pilot
- Shutoff valve
- Temperature control
- Gas supply
- Drain valve
- Thermocouple
- Burner
- Air shutter
How a Gas Hot Water Heater Works
When you turn on a hot water faucet or use hot water in a dishwasher or clothes washer, water pipes draw hot water from the tank. To replace that hot water, cold water enters the bottom of the tank, ensuring that the tank is always full. Depending on the type of fuel that is used, either electrical heating elements or a natural gas burner is used to heat the water.
Please watch just the first two minutes of the following video about gas hot water heaters.
How Do Gas Hot Water Heaters Work? (8:18)
Transcript: How Does a Gas Hot Water Heater Work?
Intro
Vance: Hi, I'm Vance and welcome to Repair and Replace. Your water heater works hard to give you a steady supply of hot water. In this episode we'll learn how gas water heaters work and then we'll look at some of the differences between standing pilot and power vent models. Lets begin.
How it Works
A standard water heater burns gas to heat the water stored inside the insulated tank. When hot water is used, cold water enters through a dip tube and fills the bottom of the tank. The gas control valve uses a built in thermostat to monitor the water temperature. When the thermostat senses the cold water, it opens up the main gas valve. Air is drawn from below the tank and mixes with the gas. The main burner ignites, and the exhaust fumes rise up through the flue vent. The burner continues to heat the water until the set temperature is reached.
Protection
The temperature and pressure relief valve is by far the most important safety device in water heaters. If the pressure or temperature inside the tank gets to high, the relief valve will open and release water, preventing the tank from exploding. Additionally every water heater has a drain valve at the bottom which can be used to flush the tank of sediment. If too much sediment builds up it will act as an insulator reducing the efficiency. This is why its best to flush the tank once a year during regular maintenance. Regardless of the type, all water heaters need protection against corrosion and rust. The tank is coated with a thin glass lining but it doesn't always cover 100% of the tank. Also the glass can become cracked, exposing more of the tank walls. On the top of the tank sits the anode rod. Like a lighting rod the anode attracts the corrosive elements in the water, sacrificing itself to protect the tank. If the anode dissolves completely, or if the rod is completly incased in calcium, then the corrosive elements will start attacking the exposed metal. Most anode rods will last 4 - 6 years, but this depends on the pH and purity of the water. This is why its best to check the anode rod during regular maintenance. All water heaters have a relief valve, drain valve and an anode rod, but ignition and venting is different in Standing Pilot, and power vent models
Standing Pilot Water Heaters
Older homes will generally have a standing pilot water heater, with an atmospheric vent. They use a small pilot flame that burns continuously, igniting the main burner when heat is needed. This is the standard design that has been used for decades and is easily identified by the metal exhaust pipe. Since its the pressure from combustion that pushes the exhaust upwards, these heaters must be vented vertically. Any restriction in the airflow might cause backdrafting, which can extinguish the pilot flame. These tanks are generally replaced with newer standing pilot models, since connecting to the existing vents keeps replacement costs low. Standing pilot water heaters will either use a conventional or an electronic gas valve.
Conventional Gas Valves
Conventional gas valves are powered by a thermocouple. The thermocouple sits in the pilot flame, and generates a small amount of electricity when heated. About 20 - 30 millivolts. This produces enough electricity to power the gas valve. The thermocouple also acts as a safety switch. If the pilot light goes out, then the thermocouple will cool down, the voltage will drop and the gas valve will shut off. This prevents unburnt gas from being released into your home.
Electronic Gas Valves
Electronic valves require more power as they have additional circuitry and diagnostics. These valves are powered by a thermopile, which is a pile of thermocouples bundled together. When heated by the pilot flame thermopiles generate around 600 - 750 millivolts. Electronic valves will also flash an error code when something goes wrong. And these are often listed on the valve.
Common Problems
Now if the pilot isn't staying lit, then it's most likely a problem with the thermocouple or thermopile. Alternatively it could be an issue with the thermal cutoff switch. The thermal switch protects against overheating. If the temperature in the combustion chamber gets too high, the thermal switch will shut off the gas valve. The thermocouple, thermopile and thermal switch can all be tested. You can learn more in the troubleshooting videos linked in the description.
Power Vent Water Heaters
Unlike standing pilot heaters, power vent models don't rely on atmospheric pressure. Instead they use a draft inducer blower to push the exhaust through the vent. This makes them useful in newly constructed homes as they can be placed virtually anywhere. When the thermostat detects cold water, the draft inducer pulls fresh air into the burner. The pressure switch then verifies that there's enough airflow for combustion. Next the hot surface ignitor heats up and ignites the burner. The flame sensor monitors the burner to confirm that there is a flame. The burner runs until the water in the tank reaches the set temperature. After the burner shuts off, the inducer will stay on for several minutes to purge the system of exhaust gases.
Common Problems
Power vent water heaters are similar to high efficiency furnaces. If any one of the safety switches trips or is faulty, then the water heater will shut down. It will attempt ignition several times before going into a hard lockout. The water heater will use flashing lights as codes to describe the source of the error. It's best to check your manual to see what these codes mean. You can learn more in the videos linked in the description. Hopefully this has given you a better understanding of how water heaters work. For more troubleshooting on water heaters, furnaces and appliances then subscribe to our channel. And if you need help, you can call or visit an AMRE location to talk with our knowledgeable staff. Thanks for watching.
Electric water heaters are generally less expensive to install (purchase price) than gas-fired types because they don't require gas lines and vents to let the combustion products out of the house.
Storage tank-type water heaters raise and maintain the water temperature to the temperature setting on the tank (usually between 120°–140°F). Because the water is constantly heated and kept ready for use in the tank, heat energy can be lost even when no faucet is on. This is called standby heat loss. These standby losses represent 10 to 20 percent of a household's annual water heating costs. Newer, more energy-efficient storage models can significantly reduce the amount of standby heat loss, making them much less expensive to operate.
Advantages and Disadvantages of Tank Water Heaters
| Advantages | Disadvantages |
|---|---|
|
|
7.5 Demand Water Heaters
7.5 Demand Water HeatersDemand Water Heaters do not have storage tanks, so there is no standby heat loss from the tank, and energy consumption is reduced by 10 to 30 percent depending on your hot water usage. Demand water heaters are available in propane (LP), natural gas, or electric models.
In these types of water heaters, cold water travels through a pipe into the unit, and either a gas burner or an electric element heats the water only when needed. With these systems, you never run out of hot water. However, the flow rate is limited by the outlet temperature.
The appeal of demand water heaters is the elimination of the tank standby losses, the resulting lower operating costs, and the fact that the heater delivers hot water continuously, so you will never run out!
How a Demand Water Heater works
Video: How Tankless Water Heaters Work (1:08)
Transcript: How Tankless Water Heaters Work
Traditional Water Heaters
Narrator: Conventional hot water heaters heat and store hot water 24 hours a day. That constant heating and reheating of water is an enormous waste of energy and money.
Tankless System Benefits
A tankless water heating system is the energy efficient way to meet all your hot water needs. These compact units can produce and supply endless hot water at a constant temperature.
How Tankless Systems Work
Once a hot water faucet is turned on, cold water enters the tankless system. The system starts operation mode. The burners ignite as the cold water is heated in the heat exchanger. The hot water then flows to the fixtures. When the hot water faucet is shut off, your tankless system goes into standby mode.
Installation and Savings
You save energy by heating water only when you need it. Replace your inefficient conventional water heater with one of our tankless systems today, and start enjoying the convenience of endless hot water and greater energy savings. We're the area's specialists and tankless technology. Call today, and we'll provide expert answers to all your questions and help you determine which tankless system is perfect for your needs. The future in hot water heating is here today.
Typically, demand heaters provide hot water at a rate of 2 to 5 gallons per minute. This flow rate might meet the requirements of a household's hot water needs as long as the hot water is not needed in more than one location at a time (e.g., one cannot shower and do the laundry simultaneously). To meet hot water demand when multiple faucets are being used, demand heaters can be installed in parallel sequence.
Although gas-fired demand heaters tend to have higher flow rates than electric ones, they can waste energy even when no water is being heated if their pilot lights stay on. However, the amount of energy consumed by a pilot light is quite small. Thus, in most cases, gas demand water heaters will cost less to operate than electric water heaters.
Demand water heaters cost more than conventional storage tank-type units and often have more complicated installation. On demand hot water heaters are sized by how much hot water it can produce per minute (gallons/minute). This can be anywhere from 2-5 gallons/minute, so you need to consider how much hot water use your home will need at the same time. The more hot water the unit produces, the higher the cost.
Advantages and Disadvantages of Demand Water Heaters
| Advantages | Disadvantages |
|---|---|
|
|
7.6 Solar Water Heaters
7.6 Solar Water HeatersThe most efficient type of hot water heater is a solar hot water heater. These can sometimes be called solar domestic hot water systems. This uses the energy from the sun to heat water for use in your home. The collector is usually mounted on the roof of the home.

Collector Types
Circulation Systems
How a Solar Water Heater Works
Video: Comparing Active and Passive Hot Water Heaters (8:05)
Transcript: Comparing active and passive hot water heaters
Introduction
Narrator: In this video, we'll explain the inner workings of both Active and Passive Solar Water Heaters, examining their advantages, disadvantages, and real-world applications.
Active Solar Water Heaters are a marvel of engineering that relies on fluid circulation, advanced controls, and the tireless power of pumps to efficiently warm water for diverse applications in commercial and residential buildings. On the flip side, the Passive Solar Water Heater takes a more elegant, simplified approach, using nature's thermosyphon principle to create a self-sustaining flow of warm water.
Solar water heaters are described by the type of solar collector and circulation system that they use.
Active Solar Water Heaters
Active solar water heaters come in two main types: direct circulation systems and indirect circulation systems. These systems harness solar energy to heat water for various applications, such as domestic hot water, space heating, or industrial processes. Let's delve into the specifics of each type:
Direct Circulation Systems
Direct circulation systems, also known as open-loop systems, involve the direct transfer of water from the collector to the end-use application without an intermediate heat transfer fluid. This simplicity makes them suitable for regions with mild climates where freezing is not a concern.
Indirect Circulation Systems
Indirect circulation systems, also known as closed-loop systems, use an intermediate heat transfer fluid to transfer thermal energy from the solar collectors to the water in the storage tank. This allows them to operate in colder climates without the risk of freezing.
Passive Solar Water Heater
A Passive Solar Water Heater operates without the need for mechanical pumps or electrical components. These systems are less expensive than Active systems but are usually not as efficient. Without the need for moving parts, these systems can be more reliable and last longer.
Thermosyphon Systems
Like an active system, a passive system relies on a solar collector to absorb sunlight. This collector is often a dark-colored, heat-absorbing material like metal or special coatings on a surface. In a passive system, the sunlight heats the water directly without the use of a separate fluid. The collector absorbs the solar energy, and this heat is transferred directly to the water circulating through or stored in the system.
Thermosyphon Principle
The core principle behind passive solar water heaters is thermosiphon. As water absorbs heat, it becomes lighter and rises. Simultaneously, colder, denser water descends to replace it. This creates a natural circulation of water through the system.
The heated water typically rises from the collector to a storage tank located at a higher elevation. This tank is positioned above the collector to facilitate the thermosiphon effect. The warm water is stored in this tank until it is needed.
When hot water is required, it is drawn from the storage tank. The cold water that enters the collector to replace it completes the natural circulation loop, creating a continuous flow of warm water if there is sunlight.
Passive solar water heaters are characterized by their simplicity and reliance on natural processes. They are often used in residential and small-scale applications, providing a cost-effective and energy-efficient way to obtain hot water. While they may not be as suitable for large-scale commercial projects, the principles of passive solar design can still be applied to aspects of building construction to enhance energy efficiency and reduce reliance on traditional heating systems.
Storage Tanks and Solar Collectors
Most solar water heaters require a properly insulated storage tank. These tanks typically feature an extra outlet and inlet that are linked to the collector. In two-tank configurations, the solar water heater heats the water in advance of it entering the standard water heater. Conversely, in one-tank setups, the backup heater is integrated with the solar storage within a single tank.
Collector Types
Solar water heaters for residential properties usually use three different types of collectors to capture sunlight and convert it into heat for heating water. These collectors are critical components that determine the efficiency and performance of the system. Here are the main types of collectors used in solar water heaters:
Flat-Plate Collectors
Flat-plate collectors are the most common type and consist of a flat, insulated box with a transparent cover, usually glass, on top. Inside the box is a dark absorber plate, typically made of metal or other materials with high thermal conductivity. Sunlight passes through the transparent cover and strikes the absorber plate, which absorbs the solar energy and converts it into heat. The heat is then transferred to a fluid, usually water or a heat transfer fluid, flowing through tubes attached to the absorber plate.
Flat-plate collectors are versatile and used in both residential and commercial solar water heating systems. They are suitable for moderate climates and are effective for domestic hot water applications.
Evacuated Tube Collectors
Evacuated tube collectors consist of rows of glass tubes with an outer and inner tube. The air is evacuated from the space between the tubes to create a vacuum, reducing heat loss through conduction and convection. Like flat-plate collectors, sunlight passes through the outer glass tube and strikes an absorber within the inner tube. The absorber transfers the heat to a fluid circulating within the tube.
Evacuated tube collectors are more efficient than flat-plate collectors, especially in colder climates. The vacuum insulation minimizes heat loss, allowing them to capture solar energy even on cloudy days.
Evacuated tube collectors are commonly used in colder climates and are suitable for both residential and commercial applications.
Integral Collector Storage (ICS) Systems (Passive System)
ICS systems, also known as batch or breadbox collectors, integrate the solar collector and the storage tank into one unit. The collector is a black tank with a transparent cover, or dark tubes in an insulated tank. Water is heated directly in the collector, eliminating the need for separate pipes or heat exchangers. The heated water is stored in the same unit until it is used.
ICS systems are simple and cost-effective, often used in residential settings for domestic hot water applications. There should be a tempering valve that allows cold water to be mixed with the hot water coming from the tank.
They are used in open loop systems and aren’t suitable for cold climates.
The choice of collector depends on factors such as climate, available space, and the specific requirements of the solar water heating system. Each type of collector has its advantages and disadvantages, and the selection is often tailored to meet the needs of the project.
By reducing the amount of heat that must be provided by conventional water heating, solar water-heating systems directly substitute renewable energy for conventional energy, reducing the use of electricity or fossil fuels by as much as 80%.
Today's solar water-heating systems are proven reliable when correctly matched to climate and load. The current market consists of a relatively small number of manufacturers and installers that provide reliable equipment and quality system design.
A quality assurance and performance-rating program for solar water-heating systems, instituted by a voluntary association of the solar industry and various consumer groups, makes it easier to select reliable equipment with confidence.
Building owners should investigate installing solar hot water-heating systems to reduce energy use. However, before sizing a solar system, water-use reduction strategies should be put into practice.
Advantages and Disadvantages of Solar Hot Water Heaters
| Advantages | Disadvantages |
|---|---|
|
|
7.7 Heat Pump Water Heaters
7.7 Heat Pump Water HeatersHeat pumps are a well-established technology for space heating. The same principle of transferring heat is at work in heat pump water heaters (HPWHs) except that they extract heat from air (indoor, exhaust, or outdoor air) and deliver it to water. Some models come as a complete package, including tank and back-up resistance heating elements, while others work as an adjunct to a conventional water heater.
The simplest HPWH is the ambient air-source unit, which removes heat from surrounding air, providing the additional benefit of space cooling. Exhaust air units extract heat from a continuously exhausted air stream and work better in heating-dominated climates because they do not cool ambient air. Some units can even be converted between the two modes of operation for optimum operation in either summer or winter.
In mild climates, you can place ambient air-source units in unheated but protected spaces such as garages, essentially using outdoor air as a heat source.
Because it extracts heat from air, the HPWH delivers about twice the heat for the same electricity cost as a conventional electric resistance water heater.
Parts of a Heat Pump Water Heater (HPWH)

Text description of the IMAGE_NAME image.
A vertical cutaway of a heat pump water heater shows the tank, insulation, and internal components. At the top, the fan (1), compressor (2), and evaporator (3) sit in the heat-pump assembly. On the right side, the hot water outlet (4) and temperature/pressure release valve (5) are near the top; the cold water inlet (8) and drain (9) are lower down. Inside the tank, the upper thermostat (6) and lower thermostat (7) are on the left side. The anode (10) runs vertically through the center, and the condenser (11) is shown as a ribbed section around its lower part. Insulation (12) surrounds the tank.
Desuperheaters
The Desuperheater feature is available on some central air conditioners and is a variation of the stand-alone HPWH. It provides economical supplemental water heating as a byproduct of air conditioning.
Desuperheater water heating can be part of an integrated package with a heat pump or air conditioner system. In most such systems, the heat pump water heating only occurs during normal demand for space conditioning, with resistance electric coils providing water heating the rest of the time.
During the cooling season, the Desuperheater actually improves the efficiency of the air conditioning system while heating water at no direct cost. In an average climate, a desuperheater might meet 20 to 40 percent of annual water heating demand.
Heat pump water heaters can provide up to 60 percent energy savings over conventional water heaters.
How a Heat Pump Water Heater Works
The Heat Pump Water Heater (HPWH) consists of three circuits. The HPWH consists of three circuits. Watch the video below to learn more about how a HPWH works. (29 seconds)
Video: How a Heat Pump Water Heater Works (0:29)
Transcript: How a Heat Pump Water Heater Works
How a Heat Pump Water Heater Works
The heat pump water heater (HPWH) consists of three circuits; a Heat Pump circuit, a Geothermal Heat circuit, and a Desuperheater circuit.
The Heat Pump circuit consists of an indoor coil, a compressor, and a Desuperheater. Cool water flows from the indoor coil to the compressor. The water becomes heated as it travels through the compressor to the Desuperheater. The heat from the water is transferred to the water in the Desuperheater circuit through the adjacent coils.
The cool water then flows to the coils adjacent to the Geothermal Heat circuit and becomes heated as it flows back to the indoor coil.
The Geothermal heat circuit consists of a geothermal unit in the ground, a "from earth connection," and a "to earth connection." Water warmed by the earth flows from the "from earth connection" through the coils adjacent to the Heat Pump circuit, transferring the heat energy. The cool water flows back into the geothermal unit in the ground.
The Desuperheater circuit consists of the hot water tank that supplies water to the house and a set of coils adjacent to the Desuperheater coils in the Heat Pump circuit. The water from the tank cycles through the coils and is heated by the Heat Pump circuit.
Note: The concept shown in the animation is applicable to all HPWH: heat is picked up and delivered into some source – which could either be the ground, air, or water.
Most of the heat delivered to the water comes from the evaporator of the unit, not through the electrical input to the machine. Consequently, the efficiency of the HPWH is much higher than for direct-fired gas or electric storage water heaters.
The installed cost of commercial HPWH systems is typically several times that of gas or electric water heaters; yet the low operating costs can often offset the higher total installed cost, making the HPWH the economic choice for water heating.
The HPWH becomes increasingly attractive in building applications where energy costs are high, and where there is a steady demand for hot water. This attractiveness is less a function of building type than it is of water demand and utility cost.
Advantages and Disadvantages of Heat Pump Hot Water Heaters
| Advantages | Disadvantages |
|---|---|
|
|
7.9 Energy Efficiency
7.9 Energy EfficiencyThe federal efficiency standards for water heaters took effect in 1990, assuring consumers that all new water heaters meet certain minimum-efficiency levels. The latest standards went into effect in 2010, and even more strict standards will go into effect in 2029.
Water heater efficiency is reported in terms of the universal energy factor (UEF). UEF is an efficiency ratio of the energy supplied in heated water divided by the energy input to the water heater, and it is based on recovery efficiency, standby losses, and cycling losses. The higher the UEF, the more efficient the water heater.
- Electric resistance water heaters have EFs ranging from 0.93 and 0.95. T
- Gas water heaters from 0.63 and 0.8 with some high-efficiency models ranging around 0.93. To meet Energy Star requirements must be greater than 0.81.
- Tankless gas water heaters 0.82-0.97. To meet Energy Star requirements must be greater than 0.95.
- Heat-pump water heaters from 3.3-4.1. To meet Energy Star requirements must be greater than 3.30.
- Solar Hot water heaters To meet Energy Star requirements must be greater than 3.00 with electric back up, and greater than 1.80 with gas back up.
 DOE replaced Energy Factor (EF), the previous measure, in 2017 with the adoption of revised testing procedures and metrics to help consumers and contractors easily and precisely compare the efficiency among water heaters for a given installation scenario. UEF provides a consistent standard, simplifies the selection process, and more accurately measures energy usage under real-world conditions compared to previous measurement models. For more information, check out Energy Star's website on "What is Uniform Energy Factor and Why Does it Matter?"
Other Considerations
In addition to UEF, also look for a water heater with at least one-and-a-half inches of tank insulation and a heat trap. If your (tank) hot water heater is older, you can increase the efficiency by adding a hot water heater blanket. The can increase the R-value (insulation) of the hot water heater by trapping the heat inside. They can be purchased at any home improvement store for about $20-$40.
In addition, capacity of a water heater is an important consideration. The water heater should provide enough hot water at the busiest time of the day. For example, a household of two adults may never use more than 30 gallons of hot water in an hour, but a family of six may use as much as 70 gallons in an hour.
The ability of a water heater to meet peak demands for hot water is indicated by its "first hour rating." This rating accounts for the effects of tank size and the speed by which cold water is heated. Water heaters must be sized properly. Over-sized water heaters not only cost more but increase energy use due to excessive cycling and higher standby losses.
7.10 Comparing Hot Water Heaters
7.10 Comparing Hot Water HeatersLet’s use the Energy Guide to perform a life-cycle analysis to help choose a water heater. Different models of water heaters with roughly the same capacity can vary dramatically in the amount of energy they use.
Instructions: Look at the Energy Guides for these three different water heaters and answer the questions below.
The prices of the water heaters are not included on the Energy Guide labels, so I've listed them for you.
- Electric Water Heater (Tank) $549
- Natural Gas Water Heater (Tank) $689
- On Demand Electric Water Heater $459

Text description of each Energy Guide Label.
First EnergyGuide Label for a $549 46 gallon tank electric water heater:
U.S. Government Federal law prohibits removal of this label before consumer purchase
ENERGYGUIDE
WATER HEATER--ELECTRIC TANK SIZE (STORAGE CAPACITY): 46 GALLONS
A. O. SMITH CORPORATION MODEL(S) E6-50H45D 130
Estimated Yearly Energy Cost $494
Cost Range of Similar Models. $154 to $630
First Hour Rating (How much hot water you get in the first hour of use)
very small | low | medium (62 Gallons) | high
Your cost will depend on your utility rates and use.
Cost range based only on models fueled by ELECTRIC with a medium first hour rating (51-75 gallons).
Estimated energy cost based on a national average ELECTRIC cost of 0.1400 per kWH.
Estimated yearly energy use: 3,531 kWH.
ftc.gov/energy
Second EnergyGuide Label for a $689 48 gallon tank natural gas water heater:
U.S. Government Federal law prohibits removal of this label before consumer purchase.
ENERGYGUIDE
WATER HEATER--GAS NATURAL TANK SIZE (STORAGE CAPACITY): 48 GALLONS
A. O. SMITH CORPORATION MODEL(S) G6N-T5040NVR 400
Estimated Yearly Energy Cost $330
Cost Range of Similar Models. $227 to $336
First Hour Rating (How much hot water you get in the first hour of use)
very small | low | medium | high (81 Gallons)
- Your cost will depend on your utility rates and use.
- Cost range based only on models fueled by GAS NATURAL with a high first hour rating (+75 gallons).
- Estimated energy cost based on a national average GAS NATURAL cost of 1.2100 per THM.
- Estimated yearly energy use: 273 THM.
ftc.gov/energy
Third EnergyGuide Label for a $459 on demand electric water heater:
U.S. Government Federal law prohibits removal of this label before consumer purchase.
ENERGYGUIDE
Instantaneous Water Heater - ELECTRIC
A. O. Smith Corporation Model(s) R2VR-180E 100
Estimated Yearly Energy Cost $98
THE ESTIMATED ANNUAL ENERGY COST OF THIS MODEL WAS NOT AVAILABLE AT THE TIME THE RANGE WAS PUBLISHED.
Cost Range of Similar Models. $82 to $90
Maximum Gallons Per Minute of Hot Water (GPM Rating)
very small (1.6 GPM) | low | medium | high
- Your cost will depend on your utility rates and use.
- Cost range based only on models fueled by ELECTRIC with a very small GPM rating (0-1.6 GPM).
- Estimated energy cost based on a national average ELECTRIC cost of 0.1400 per kWH.
- Estimated yearly energy use: 703 kWH.
ftc.gov/energy
Quiz Yourself
After looking through the information on the three Energy Guide labels, see if you can answer the following questions.
Still trying to figure out the payback period between the two tank heaters? The price difference between the two models was $140, with the electric water heater being cheaper to buy, and your annual savings for operating the water heater were $164, with the gas water heater being cheaper to operate. So after one year, you got back $164 out of the $140 extra you spent on the superior model. It took you less than a year to pay back the extra money you spent on the more expensive model.
Obviously, over time, it pays to buy an energy-efficient water heater. It also helps the environment by not using as much energy and thereby not emitting as much CO2, NOx, SO2, CO and particulate matter into the environment.
7.11 Heating Hot Tubs and Pools
7.11 Heating Hot Tubs and PoolsHeating pools and hot tubs require a lot of energy use because we are heating A LOT of water. As we learned earlier in the lesson the amount of energy required to heat water depends on the amount of water and pools an hot tubs use a significantly larger volume of water compared to residential hot water use.
Pool water temperatures typically range from 78-82°F. The volume of water in a pool can vary significantly compared to the size, style and depth of the pool. The manufacturer will likely tell you the amount of water your pool can hold, but you can estimate it based upon online calculators or simple geometry.
The calculations get more complicated if you have a different shaped pool or have a deep end. However, there are lots of online calculators that will help you estimate the gallons of water needed.
Hot Tubs are another high hot water demand device that may be found in some homes. Hot tubs are typically operated at higher temperatures between 100-104°F. Most of the energy use is to heat the water, over 75%. The remaining energy use can be from the pumps, jets and lighting. In colder climate conditions the energy use may be higher to get that temperature up.
Type of Water heaters for pools and hot tubs
Just like we saw with residential hot water heaters, pools and hot tubs can be heated in a variety of ways including electric, natural gas, solar and heat pump.
Heat Pump Hot Water Heaters
Just like we saw with residential hot water heaters, heat pumps have higher efficiency because they use some of the energy available in surrounding air to help heat the water. Heat pump will work more efficiently in temperatures above 50°F.

Text description of the Heat Pump Hot Water Heater for Pools image.
The image depicts a schematic diagram of a heat pump system designed for pool heating. At the left, warm air enters the system labeled as "1" through an intake. The air moves past a fan, labeled "2," into an evaporator marked as "3," where it warms the gas, labeled "4." The cool air exits labeled as "5." The warm gas travels to a compressor, labeled "6," intensifying the heat. This gas then moves into a heat exchanger (labeled "7") where it warms the pool water. The schematic includes a recycle pipe to indicate the process of heat transfer. Adjacent to these, a filter denoted as "8" and a water pump labeled "9" are shown, leading to a pool marked as "10." Lines and arrows connect these components, illustrating the flow of air, gas, and water through the system.
Just like we saw with other types of water heating, the heat pump hot water heater is more expensive, but has less operating costs. Heat pump efficiencies range from 3.0-7.0, which means they get more energy out per unit of electricity put in. This isn’t magic, heat pumps just pull some energy out of the ambient air.
Solar Swimming Pool Heaters
Solar Swimming Pool Heaters use a solar collector to convert energy from the sun to heat the pool water. They tend to have the lowest operating cost and can be the most cost-effective solution in some climates.
Most solar pool heating systems include the following:
- A solar collector — the device through which pool water is circulated to be heated by the sun
- A filter — removes debris before water is pumped through the collector
- A pump — circulates water through the filter and collector and back to the pool
- A flow control valve — automatic or manual device that diverts pool water through the solar collector.
Pool water is pumped through the filter and then through the solar collector(s), where it is heated before it is returned to the pool. In hot climates, the collector(s) can also be used to cool the pool during peak summer months by circulating the water through the collector(s) at night.

Text description of the Diagram of a solar pool heating system image.
The image portrays a schematic diagram of a solar pool heating system. In the foreground, a blue swimming pool occupies the bottom left area. Adjacent to the pool, a series of equipment components are shown, including a strainer, pump, filter, and check valve arranged linearly on a grey platform. Pipes connect these components, leading water from the pool, through the equipment, and towards the house in the background. The house features solar collectors on its roof, with an arrow indicating water flow from the pool system to the collectors. A sensor and flow control valve are visible along the pipe that connects to the solar collectors. Beneath this setup, a conventional pool heater is depicted, connected via additional piping.
How to reduce your energy use in your pool or hot tub:
- Use a high quality cover to keep as much heat inside. A lot of heat is lost from the top of the pool or hot tub, so keep it covered and insulated as much as possible when not in use. A cover will also reduce evaporation.
- Lowering the temperature just a few degrees can reduce your energy costs
- Maintaining a constant temperature is more efficient than increasing and decreasing the temperature constantly.
- Off peak heating, using a timer to heat during off peak (cheaper) times
- Keep filters clean and free of debris
7.12 Water Heaters: Energy Saving Tips
7.12 Water Heaters: Energy Saving Tips- Do as much cleaning as possible with cold water to save the energy used to heat water.
- Check your faucets for leaks. They waste both water and energy!
- Conserve hot water by installing water-saving showerheads.
- Once your water is hot, insulate to help keep it that way. Wrapping exposed hot water pipes with insulation will minimize heat loss. So will installing an insulation blanket around your water heater.
- Reduce your water heater's temperature to 120 degrees Fahrenheit. That will produce plenty of hot water and still save energy. For homes with a dishwasher, a setting of 140 degrees is required to clean properly, but most of the new dishwashers have a built-in water temperature booster.
- Replace old hot water heaters with more efficient technologies like heat pump or on demand hot water heaters.
- Many new water heaters have a "vacation" setting you can use to save energy if you're away for more than a few days. Turn the thermostat "down" or "off" when you're gone for more than three days.
- If you have a pool or hot tub, make sure you keep it covered with a well-insulated cover when not in use to keep heat inside.
7.13 Review
7.13 ReviewIn this lesson, we explored the many ways homes heat water and why those choices matter. From traditional hot water tanks to high‑efficiency heat pump systems, you saw how different technologies balance cost, convenience, and energy use. We also looked at how solar hot water systems can tap into renewable energy, and how pools and hot tubs—often overlooked—can become major energy users if they aren’t heated wisely.
The big takeaway is that hot water isn’t just something that “shows up” when you turn on the tap. Every gallon requires energy, and the systems we choose have real impacts on our utility bills and the environment. As you continue learning about energy use in the home, keep thinking about how everyday technologies—like water heaters—shape both our comfort and our energy footprint. Understanding these systems is the first step toward making smarter, more sustainable choices.
Lesson 8: Lighting
Lesson 8: LightingThe links below provide an outline of the material for this lesson. Be sure to carefully read through the entire lesson before returning to Canvas to submit your assignments.
8.1 Lesson 8 Introduction
8.1 Lesson 8 IntroductionWelcome to Lesson 8!
In 2020, 81 billion kWh of electricity was used for lighting homes in the US. Commercial buildings added 208 billion kWh and industrial facilities added another 53 billion kWh. This means in the US, we spend literally billions of dollars to light our environment. Additionally, this means tons of additional carbon emissions, into the atmosphere.
The good news? Lighting is one of the easiest places to save energy.
- Switching just five frequently used bulbs to LED can save ~$75/year and prevent ~1,000 lbs of CO2 emissions.
- Upgrading lighting in a school, office, or community building can cut energy costs by 50% or more.
The Lighting Revolution: Then → Now
| Era | Dominant Technology | Typical Efficacy |
|---|---|---|
| ~2000 | Incandescent bulbs | 10–17 lumens/watt |
| ~2010 | Compact Fluorescent (CFL) | 50–70 lumens/watt |
| Today | LED (Light-Emitting Diode) | 80–150+ lumens/watt |
Twenty years ago, nearly every home used incandescent bulbs. Today, LEDs dominate the market because they:
- Use up to 90% less energy than incandescents
- Last 15–25+ years (vs. 1–2 years for incandescents)
- Contain no mercury (unlike CFLs)
- Offer instant-on, dimmable, high-quality light in warm or cool tones
In this lesson, we'll explore how each technology works—and why LEDs represent the most efficient way to generate visible light today.
Key Concepts We'll Cover
Light Measurement Basics
- Lumens = total visible light output (brightness)
- Watts = energy consumed (not brightness!)
- Foot-candles = light received on a surface (lumens per square foot)
- CRI (Color Rendering Index) = how true colors appear under a lamp (0–100 scale)
Life-Cycle Cost Analysis
We'll practice the most important calculation in this lesson: comparing the total cost of ownership for different lamps. This includes:
- Purchase price × number of replacements needed
- Energy costs over the lamp's lifetime
- Maintenance and disposal considerations
Remember: The cheapest bulb upfront isn't always the cheapest over time.
Smart Lighting Strategies
- Matching light levels to tasks (reading vs. hallway vs. accent lighting)
- Using controls (timers, motion sensors, dimmers, photocells) to eliminate waste
- Retrofitting existing fixtures for better efficiency
Lighting
These are some statistics on lighting in the US. The latest report from the Office of Energy Efficiency and Renewable Energy was put out in April 2024, but it refers to a study from 2020.
- Lighting accounts for 4% of all electricity consumed in the United States. This has been steadily decreasing as more energy-efficient lighting options have come on the market in
- An average household dedicates 6% percent of its energy budget to lighting. Commercial establishments consume about 17% percent of their total energy just for lighting.
- Technologies developed during the past 25 years, specifically LED lightings, have helped cut lighting costs 30 to 75 percent while enhancing lighting quality and reducing environmental impacts.
Lesson 8 Objectives
Upon completing this lesson, students will be able to:
- Explain how different lamp types (incandescent, halogen, fluorescent, HID, LED) produce light
- Compare lighting efficiency using lumens, watts, and lumens per watt
- Identify lighting controls that reduce waste without sacrificing comfort
- Perform a life-cycle cost analysis to compare total ownership costs
Questions?
If you have any questions, please post them to the General Course Questions forum located in the Discussions tab in Canvas. While you are visiting the discussion board, feel free to post your own responses to questions posted by others - this way, you might help a classmate!
8.2 How Lighting is Measured
8.2 How Lighting is MeasuredWhen shopping for a light source, most people look first at watts (W). However, watts measure power consumption—the rate at which electricity is used—not the amount of light produced. A higher wattage means higher energy use, not necessarily brighter light.
Terminology: "Bulb" vs. "Lamp"
In everyday language, we call the entire light source a "light bulb." Technically, however:
- Bulb: Refers only to the glass envelope that surrounds the light-producing component.
- Lamp: The correct industry term for the complete, replaceable light source (including the base, filament or arc tube, and glass).
Lighting professionals use "lamp" to describe the whole unit. In this course, we may use "lamp" and "light bulb" interchangeably for clarity, but it is helpful to know the technical distinction.
Measuring Light: The Lumen
The standard unit for light output (also called luminous flux) is the lumen (lm). Unlike watts, lumens tell you how much visible light a lamp produces—the higher the lumen rating, the brighter the light.
When you look at a lamp's packaging, you will often find three key specifications
- Luminous Flux (lumens)- or how much visible light the lamp produces. Eg. 800 lumen
- Power consumption (Watts) which tells us how much electricity the lamp uses. Eg. 9 Watts
- Rated Life (hours or years)- which tells us the expected operational life span. Eg. 10,000 hours or ~9 years

Text description of the light bulb packaging image.
The image is a side-by-side comparison of two packages of GE LED light bulbs. The left package, set against a blue background, features the "refresh" LED brand, labeled as "Energetic Daylight." It displays four bulbs with silver bases, highlighting features like "Enhanced Color Contrast & Boldness" and "13 Year Life." Additional information includes "Daylight," wattage equivalent, "Dimmable" indicator, "Brightness 800 lumens," and "Estimated Energy Cost $1.02 per year."
The right package, in an orange background, showcases the "relax" LED brand, described as "comfortable soft white light." Similarly, it displays four bulbs and highlights "Enhanced Color Contrast," "40w replacement," "5.5w energy use," and "13 Year Life." Other details include "Soft White," "Dimmable," "Brightness 450 lumens," and "Estimated Energy Cost $0.66 per year."
Watch this video below to find out more about lumens. (1:44)
Transcript: Energy 101: Lumens. (1:44)
Today you’ll see more light bulb options in stores. These bulbs will give you the light you want while saving you energy—and money.
Here’s something to consider. In the past, we bought light bulbs based on how much energy—or how many watts—they use. But today’s energy-saving light bulbs use up to eighty percent less power to give you the same amount of light. So wouldn’t it make more sense to buy light bulbs based on how much light they provide? With lumens, you can do just that.
Lumens are a measure of brightness. So if you know how many lumens you want, you’ll buy just the right bulb for any spot in your home.
Instead of buying an inefficient sixty-watt bulb, look for an efficient replacement that gives you about eight hundred lumens of light. If you’re replacing a one hundred-watt bulb, look for an energy-saving bulb that gives you about sixteen hundred lumens.
Just think: the more lumens, the brighter the light.
To help you shop for the light you want, you’ll find an easy-to-read label on light bulb packages. So you’ll have a simple way to see the bulb’s brightness, how much the bulb will cost to operate for a year, and other qualities like light color—from warm yellowish to cool bluish.
With more energy-saving choices appearing on store shelves, including compact fluorescents, or CFLs, light emitting diodes, or LEDs, and energy-saving incandescents, you’ll have more options that save you money.
So when shopping for a new bulb, look for lumens—or how bright the bulb is. Remember, lumens is the new way to shop for light.
Footcandles
A footcandle (fc) is the Standard unit of measure for illumination on a surface. It is a lumen of light distributed over a 1-square-foot (0.09-square-meter) area.

The average footcandle level on a square surface is equal to the amount of lumens striking the surface, divided by the area of the surface.
Example
A 40 watt bulb produces about 505 lumens and has a life of about 1,000 hours. When this bulb is used to light a room of 10 x 10 feet, these 505 lumens are distributed over 100 square feet of floor area. What is the illumination?

Lighting Efficacy measures how effectively a light source converts electrical energy (watts) into visible light (lumens).
8.3 How Much Lighting is Needed
8.3 How Much Lighting is NeededHow much light is needed in a room depends on the task(s) being performed (contrast, requirements, space, size, etc.). There are three different types of task-oriented lighting: Ambient, Task, and Accent. The light requirement also depends on the ages of the occupants and the importance of speed and accuracy of the task.
- Ambient lighting is general purpose lighting—an example is the lighting used in hallways for safety and security. An illumination of 30–50 fc is generally the maximum that one needs for this purpose.
- Task lighting is lighting that is designed for specific tasks. Reading and writing are the most light-intensive tasks and require about 50 fc at home. Tasks like cooking, sewing, or repairing a wrist watch require more -- about 200–300 fc. However, the area with this level of illumination will be small. Increasing the light everywhere is not required and is a waste of energy.
- Accent lighting is the lighting that is provided to highlight certain objects or areas, for example, the use of floodlights to highlight a painting or a statue. Accent lighting also illuminates walls, so they blend more closely with naturally bright areas like ceilings and windows. Accent lighting can be high intensity or subtle.
How Much Light is needed?
Your lighting levels and color temperature is much a matter of preference, but the Illuminating Engineering Society (IES) has come up with guidance to determine the appropriate lighting levels for various spaces in your home.
| Lighting Area | Recommended Foot Candles |
|---|---|
| Living Rooms, Bedrooms, and Relaxation Areas | 10–20 foot candles (ambient). |
| Kitchen (General) | 30-40 foot candles |
| Kitchen (Task Areas - Stove & Sink) | 50-100 foot candles |
| Bathrooms | 20-50 foot candles |
| Home Office/Reading Area | 20-50 foot candles |
| Dining Room | 30-40 foot candles |
| Hallways & Entryways | 5-20 foot candles |
| Garage (General) | 30 foot candles |
| Garage (Workbench) | 100 foot candles |
Indoor Lighting Levels Requirements
| Indoor Lighting Area | Recommended Foot Candles |
|---|---|
| Corridors / Stairways / Restrooms | 10‑20 |
| Storage Rooms | 10‑50 |
| Conference Rooms | 20‑50 |
| Gymnasiums | 30‑50 |
| Merchandising | 30‑150 |
| Cafeterias | 50 |
| Classrooms | 20-100 |
| General Offices | 50‑100 |
| Manufacturing Assembly | 50‑100 |
| Parking Lots (security) | 0.5-3 |
Color Rendering Index
Lamps are assigned a color temperature (according to the Kelvin temperature scale) based on their "coolness" or "warmness." The human eye perceives colors as warm if they are at the red end of the spectrum, and cool if they are at the blue-green end of the color spectrum.

Text description of the LED color temperatures image.
The image displays a series of six black pendant lights, each suspended from the ceiling, against a backdrop divided into six vertical sections. Each section is illuminated with a different color temperature, ranging from warm to cool white. The leftmost section shows a warm yellow light at 2700K, transitioning to a slightly cooler light at 3000K, followed by neutral white at 3500K and 4000K, progressing to cooler light at 5400K, with the final section showcasing a blue-tinted cool light at 6500K. The walls underneath the lights show the corresponding color temperature numerically, written in colors that match the light above.
Video: Light sources the color temperatures represent. (No Audio) (0:27)
Text description of the Light sources the temperatures represent
Here are some examples of light sources that a color temperature (measured in Kelvin) might represent.
- 1,000° K - Sunrise
- 1,900° K - Candle light
- 2,800° K - Light bulb
- 3,000° K - Halogen bulb
- 4,000° K - Fluorescent light
- 5,500° K - The Sun at noon
- 7,000° K - Overcast sky
- 10,000° K - Clear blue sky
The ability to see colors properly is another aspect of lighting quality. Objects' colors appear to be different under different types of light. The color rendering index (CRI) scale is used to compare the effect of a light source on the color appearance of its surroundings. A scale of 0 to 100 defines the CRI. A higher CRI means better color rendering, or less color shift.
Instructions: Move the drag button in the center of the picture below to see the difference between low CRI and high CRI.
Factors Affecting the Number of Lamps Required
Instructions: Click on the hot spots below to determine the factors that affect the number of lamps required:
Text description of factors that affect the number of lamps required activity
- Fixture efficiency: certain fixtures reflect more light than others. Fixtures that are not highly reflective may absorb some light, resulting in less light reaching the user.
- The effects of light losses from lamp lumen depreciation and dirt accumulation. As lamps age, or when dirt accumulates on the bulb surface, the lumen output from the light bulb decreases. Therefore, newer light bulbs produce more light than older bulbs of the same wattage.
- The reflectance of surrounding surfaces: bright colors or reflective surfaces painted with glossy texture finishes will appear brighter than a surface with flat finish paint.
- Lamp lumen output: the efficiency of a bulb increases with wattage. For example, a 40 watt bulb produces 505 lumens, where as a 100 watt bulb (2.5 times the 40 watts) produces 1750 lumens (4.32 times the 505 lumens).
- Availability of natural light (daylight).
- Room size and shape.
Credit: Image Pennsylvania State University. (2026). Copilot.
8.4 Types of Lighting: Incandescent Bulbs
8.4 Types of Lighting: Incandescent BulbsThere are four basic types of lighting:
- Incandescent
- Fluorescent
- High-intensity discharge
- LED
Incandescent Bulbs
Thomas Alva Edison invented the incandescent light bulb with reasonable life. Lewis Latimer has perfected it with the use of carbon filament.
The incandescent bulb consists of a sealed glass bulb with a filament inside. When electricity is passed through the filament, the filament gets hot. Depending on the temperature of the filament, radiation is emitted from the filament.
The filament's temperature is very high, generally over 2,000º C, or 3,600º F. In a "standard" 60-, 75-, or 100-Watt bulb, the filament temperature is roughly 2,550º C, or roughly 4,600º F. At high temperatures like this, the thermal radiation from the filament includes a significant amount of visible light.
This principle of obtaining light from heat is called ‘incandescence.” At this high temperature of 2,000º C, about 5 percent of the electrical energy converts into visible light and the rest of it is emitted as heat or infrared radiation.
Video: How Does a Light Bulb Work? (3:47)
Transcript: How Does a Light Bulb Work?
Life Before Electric Lighting
Narrator: Before the advent of electrical lighting, illuminating space was a serious challenge. The only choices people had were candles or oil lamps, neither of which could provide sufficient brightness for extended periods.
Edison and the Incandescent Light Bulb
However, things took a historic turn in the 1800s, when Thomas Alva Edison conceived and patented the first incandescent light bulb. This innovative technology revolutionized the way we light our homes and workplaces, and has remained largely unchanged from its original design to this day. Incandescent light bulbs function based on a number of interesting aspects of physics, which we'll explore in this video.
Inside the Bulb: Glass Envelope and Vacuum
The incandescent bulb is made of two main components—the bulb and the filament. The bulb is typically crafted from glass and filled with a vacuum to extend its lifespan. Should air molecules make their way inside, the bulb's temperature would rapidly increase, leading to the glass shattering due to the heat.
The Tungsten Filament and Inert Gas
The filament is where light production commences. This filament is a long, coiled conductor of electricity, usually made of tungsten. Additionally, an inert gas like argon can fill the bulb’s interior, which aids in slowing down the decay of the tungsten filament.
How Electricity Produces Light: Electron Excitation
As electricity flows through the filament via metal contacts, atoms are stirred up, causing electrons to become excited and jump to higher energy levels by absorbing the current's energy. Almost instantly, these excited electrons lose their extra energy and revert to their initial energy levels, consequently producing small packets of light energy, also known as photons.
Incandescence and Heat Generation
From our perspective, this is seen as the bulb lighting up! It’s important to understand that the illumination process of incandescent light bulbs involves the filament being heated to the point of photon emission, thus burning itself to emit light.
Why Incandescent Bulbs Are Inefficient
A significant part of the electricity coursing through the bulb is utilized to excite the atoms, leading to heat energy production. However, only a nominal fraction of this energy transforms into light, making the bulb's conversion efficiency quite unimpressive, as a substantial amount of energy is wasted as heat.
Modern Alternatives: Halogen, Fluorescent, and LED
Over time, various efficient alternatives to traditional incandescent bulbs have been introduced, such as the halogen bulb, fluorescent bulb, and the Light Emitting Diode (LED) bulb. These lighting options utilize different mechanisms to reduce energy loss via heat, providing more substantial light output per unit of electrical energy input.
How Halogen Bulbs Work
Halogen bulbs encase a tungsten filament within a quartz capsule filled with an inert gas and minor traces of halogens, enhancing its life through the "halogen cycle."
How Fluorescent Bulbs Work
Fluorescent bulbs, on the other hand, use the fluorescence principle. They energize mercury vapor with electricity, producing ultraviolet radiation that hits a phosphor coating, radiating light energy. These bulbs are four times more efficient and ten times longer-lasting than incandescent bulbs.
How LED Bulbs Work
Lastly, there are LED bulbs, which are considered the most energy-efficient modern lighting solution. They work by connecting the positive side of the voltage to the anode (the longer leg of the LED) and the negative side to the cathode (the shorter leg). When a forward voltage is applied, it allows the flow of current through the LED, prompting the release of light.
The Future of Energy-Efficient Lighting
In an era of dwindling resources, sustainable and energy-efficient lighting equipment like LED bulbs, which emit minimal heat energy and last up to 25,000 hours, are the future of lighting in homes and commercial spaces. As inventors continue striving to create better and more efficient technologies, the future of lighting appears incredibly bright!
Let’s now look at several different types of incandescent bulbs.
Standard incandescent bulbs
Standard incandescent bulbs are most common and yet are the most inefficient. Larger wattage bulbs have a higher efficacy (more lumens per Watt) than smaller wattage bulbs.
Instructions: Click the “graph” button below to create a graph comparing Watts and efficiency, and then answer the question below.
Text description of the light bulb efficiency activity.
Comparison of Watts and Efficiency for an Incandescent Bulb
The table below compares the number of Watts of a light bulb to its efficiency (lumens per Watt).
| Watts (power) | 25 | 40 | 60 | 75 | 100 | 150 |
|---|---|---|---|---|---|---|
| Efficiency (lumens per Watt) | 8 | 12 | 14 | 15 | 17 | 19 |
Based on this data, it is clear that as the number of Watts increase, so does the efficiency.
Tungsten halogen bulbs
Tungsten halogen is an incandescent lamp with gases from the halogen family sealed inside the bulb and an inner coating that reflects heat back to the filament. It has similar light output to a regular incandescent bulb, but with less power. Halogens in the gas filling reduce the material losses of the filament caused by evaporation and increase the performance of the lamp.

Tubular tungsten-halogen bulbs
Tubular tungsten-halogen bulbs are commonly used in “torchiere” floor lamps, which reflect light off of the ceiling, providing more diffused and suitable general lighting.
Although these provide better energy efficiency than the standard A-type bulb, these lamps consume significant amounts of energy (typically drawing 300 to 600 W) and become very hot (a 300-W tubular tungsten-halogen bulb reaches a temperature of about 2600° C compared to about 600° C for a compact fluorescent bulb). Because Tungsten-halogen lamps operate at very high temperatures (high enough to literally fry eggs), they should not be used in fixtures that have paper- or cellulose-lined sockets.

Halogen bulbs
A halogen bulb is often 10 to 20 percent more efficient than an ordinary incandescent bulb of similar voltage, wattage, and life expectancy. Halogen bulbs may also have two to three times as long a lifetime as ordinary bulbs. How much the lifetime and efficiency are improved depends largely on whether a premium fill gas (usually krypton, sometimes xenon) or argon is used. The image below shows a picture taken with an Infrared camera comparing the heat produced by a halogen and a compact fluorescent light bulb. The red and white color zones are extremely hot, and the blue zones are cooler.

Reflector Lamps
Reflector Lamps - Light waves from a bulb spread in all directions. The light that goes toward the back is not useful when the light is most needed in the front. Reflector lamps (Type R) are designed to spread light over specific areas.
Reflector lamps have silver coating on the sides, like any mirror, and therefore all the light waves passing through the sides or the back are reflected to the front. Therefore, they are called reflector lamps and are also called floodlighting, spotlighting, and down lighting bulbs.
For more information on the history of the light bulb, check out the History of the Light Bulb by the US department of energy.
8.5 Types of Lighting: Fluorescent Bulbs
8.5 Types of Lighting: Fluorescent BulbsThe fluorescent lamp is a major advancement and a commercial success in small-scale lighting since the original tungsten incandescent bulb. These bulbs are more efficient compared to incandescent bulbs. Fluorescence is the phenomenon in which absorption of light of a given wavelength by a fluorescent molecule is followed by the emission of light at longer wavelengths.
Types of Lighting, Fluorescent
A fluorescent bulb consists of a glass tube with an electrode at each end. Inside the tube is a small amount of inert gas (usually argon or an argon‑krypton mixture) and a trace of mercury. The inner surface of the glass is coated with a special material called a phosphor.
When the bulb is turned on, electricity flows between the electrodes and creates an electric arc. This arc excites the mercury atoms, pushing them to a higher energy state. As the atoms return to their normal (ground) state, they release that excess energy as ultraviolet (UV) light. UV light is invisible to the human eye and can be harmful in high doses.
The phosphor coating solves both problems. It absorbs the invisible UV light and re‑emits it as visible light. This two‑step process—absorbing higher‑energy UV radiation and emitting lower‑energy visible light—is known as fluorescence. Bulbs that operate on this principle are called fluorescent bulbs. Without the phosphor coating, the tube would only emit invisible, potentially harmful UV light and would not function as a practical light source.
In short: A fluorescent bulb uses electricity to excite mercury vapor, which produces UV light. A phosphor coating then converts that UV light into the visible light we see.
Video: How do Fluorescent Lights work? (2:02)
Transcript: How do Fluorescent Lights work?
Intro
Narrator: Fluorescent lights are ubiquitous, they're used to light up signs, in restaurants, offices, homes, they are almost everywhere. In this video we'll explain how they work.
History
The fluorescent tube came about thanks to American electrical engineer and inventor Peter Cooper Hewitt's research into the work of physicist Julius Plucker and Heinrich Geissler, who was a glassblower. In 1901, when Hewitt passed an electric current through tiny amounts of mercury in one of Plucker's glass tubes, it lit up, making it the very first fluorescent tube to use mercury. These lamps work in much the same way today, with a few modifications of course.
Components
There are 4 main components to a fluorescent light. The first is an electrode. There is also a very small amount of mercury vapour and an inert nobel gas swirling around inside the tube. And lastly there is a phosphor coating on the outside. An important piece of the fluorescent puzzle to note is that the inside of the tube is kept well below atmospheric pressure, usually around 0.3% of atmospheric pressure. This ensures that the mercury remains as a vapor.
How it Works
Electricity first enters the light fixture, like a troffer, and through a ballast. The ballast – which regulates voltage, current, etc. and is necessary for a fluorescent bulb to light. The ballast feeds the electricity into the pins of the fluorescent bulb on both ends. Then, after the electricity enters through the pins, it flows to the electrodes inside the sealed glass tube, which is kept under low pressure. Electrons begin traveling across the tube, from one cathode to the other. Inside of the glass tube are inert gasses and mercury which are excited by the electrical current. The mercury vaporizes as electricity flows, this leads to the excitation of electrons and the subsequent electron relaxation to produce an invisible UV light that we actually cannot see with our naked eye. This uv light is then absorbed by the phosphor coating which leads to excitation of more electrons where upon relaxing they finally emit visible light and this is what we see.
Thanks for watching! If you learned something new in this video don’t forget to like and subscribe.
Fluorescent lamps are about 2 to 4 times as efficient as incandescent lamps at producing light at the wavelengths that are useful to humans. Thus, they run cooler for the same effective light output. The bulbs themselves also last a lot longer—10,000 to 20,000 hours versus 1,000 hours for a typical incandescent.
Fluorescent Tube Lighting
You have likely seen fluorescent tube lighting in hospitals, schools, or office buildings. Fluorescent lights require ballasts—devices that regulate the electrical current flowing through the tube. Ballasts are essential for starting the lamp and providing circuit protection.
Ballasts consume energy themselves, and certain types operate most efficiently when the lights remain on for extended periods rather than being frequently switched on and off. There are two main types of ballasts: electronic and magnetic. Older magnetic ballasts often cause noticeable flickering, while modern electronic ballasts provide steadier light.
The image below shows the different types of fluorescent tubes available on the market. In general, smaller-diameter tubes are more energy-efficient. However, fluorescent tubes are not simple replacements for standard incandescent light bulbs. They come in various lengths and have different pin configurations, so it's important to match the size and style of your existing fixture when doing a lighting upgrade. Additionally, installing more energy-efficient tubes may require upgrading the ballast as well.

Text description of the Fluorescent tube lighting image.
The image displays five fluorescent light tubes of varying diameters, arranged horizontally against a plain gray background. Each tube is labeled with text to the left: T2, T4, T5, T8, and T12. The tubes are organized from top to bottom, starting with the thinnest, labeled T2, and progressing to the thickest, labeled T12. The tubes are all white with metallic gray caps at each end where the electrical pins are located.
Full-size fluorescent lamps are available in several shapes, including straight, U-shaped, and circular configurations. Lamp diameters range from 1" to 2.5". The most common lamp type is the four-foot (F40), 1.5" diameter (also called T12) straight fluorescent lamp. More efficient fluorescent lamps are now available in smaller diameters, including the 1.25 " (also called T10) and 1" (also called T8).
Fluorescent lamps are available in color temperatures ranging from warm (2700 K) "incandescent-like" colors to very cool (6500 K) "daylight" colors.
Cool white (4100 K) is the most common fluorescent lamp color. Neutral white (3500 K) is becoming popular for office and retail use.
Compact Fluorescent Lamps (CFL)
Compact Fluorescent Lamps are miniaturized fluorescent lamps that usually have premium phosphors, which often come packaged with integral or modular ballast, as shown in the image below.

Text description of the Types of compact fluorescent bulbs available on the market image.
The image illustrates six types of compact fluorescent lamps against a light gray background. Each lamp is labeled with a letter from a to f. Lamp (a) has a single U-shaped tube. Lamp (b) features a double U-shaped design with two parallel tubes. Lamp (c) consists of three parallel U-shaped tubes. Lamp (d) has a bulbous, rounded shape on top. Lamp (e) is a modular circline and ballast. Lamp (f) is rmodular quad-tube and ballast. Each lamp has a screw-in base.
Compact Fluorescent Lamps have the following characteristics. They:
- Typically have a standard screw base that can be installed into nearly any table lamp or lighting fixture that accepts an incandescent lamp.
- Come in a variety of sizes and shapes and are being used as energy saving alternatives to incandescent lamps.
- Have a much longer life—6,000 to 20,000 hours (10 to 20 times longer), compared to 750 to 1000 hours for a standard incandescent.
- One of the major challenges of CLF is the disposal. Due to the use of mercury they cannot be put in household trash. Most home improvement stores have a disposal box on site or will need to be transported to local hazardous waste facility. Investigate where you can dispose of CLF bulbs in your community.

Text description of the Managing CFL Bulbs image.
The image is an informational poster titled "Why Recycle Bulbs?" It focuses on the dangers of CFL (Compact Fluorescent Lamp) bulbs and provides steps on how to recycle them. The top section of the poster shows the title with an illustration of a CFL bulb. Below, two main sections are presented side by side: "The Dangers of CFL Bulbs" on the left with a red color scheme, and "How to Recycle CFL Bulbs" on the right with a blue color scheme.
The left section lists three dangers: "Contains Mercury," "Pollution Hazard," and "Landfill Waste." Each danger is accompanied by an illustration—mercury is depicted as a bulb with a mercury droplet, pollution with a smoking factory, and landfill waste by a trash can overflowing with bulbs.
The right section outlines four steps for recycling: finding a recycling center, handling the bulbs with care, ensuring proper transport, and recycling responsibly. Each step features a corresponding icon such as a map, hand placing bulbs in a sealed bag, a car with bulbs in the trunk, and a recycling bin.
At the bottom is a green banner with "DO NOT THROW CFLs IN THE TRASH!" flanked by red circular icons highlighting "No Landfill," "No Incineration," and "No Hazardous Waste."

Text description of the Compact Fluorescent Bulbs image.
The image displays four different types of light bulbs lined up side by side on a white background. From left to right, the first bulb is a compact fluorescent lamp (CFL) with a spiral shape and a screw base. The second bulb is also a CFL with a tight, coiled spiral design and a screw base. The third bulb is a CFL with a more elongated spiral design; it features a screw base. The fourth and final bulb is an LED bulb with a smooth, dome-shaped top and a screw base.
8.6 Types of Lighting: High-intensity Discharge
8.6 Types of Lighting: High-intensity DischargeHigh-Intensity Discharge (HID) Lamps
High-intensity discharge (HID) lamps are a type of electrical gas-discharge lamp that produces light by creating an electric arc between two tungsten electrodes housed inside a transparent quartz or ceramic arc tube. The arc tube is filled with gas (typically xenon or argon) and metal salts.
How HID Lamps Work
HID lamps operate similarly to fluorescent lamps in that both generate light using an electric arc between electrodes. However, there are key differences:
- Arc length: HID lamps have a much shorter, more compact arc
- Light output: HID lamps produce significantly more light, heat, and pressure within the arc tube
- Efficiency: HID lamps are generally more efficient than fluorescent lamps, producing more lumens per watt
When the lamp is turned on, the ballast provides a high-voltage pulse to initiate the arc. As the lamp operates, the metal salts inside the arc tube vaporize and become part of the plasma, producing intense light.
Types of HID Lamps
Below are the main HID lamp types, listed in increasing order of efficacy (lumens per watt):
- Mercury Vapor (35–65 lm/W)
- The oldest HID technology
- Bluish-green light with poor color rendering
- Common in older streetlights and industrial facilities
- Being phased out in many areas due to low efficiency
- Metal Halide (75–100 lm/W)
- Excellent color rendering and bright white light
- Widely used in stadiums, gymnasiums, retail spaces, and parking lots
- Contains rare earth metals that produce a full spectrum of light
- High-Pressure Sodium (HPS) (85–150 lm/W)
- Golden-yellow light
- Very efficient with long lamp life (up to 24,000 hours)
- Common in street lighting, warehouses, and outdoor security lighting
- Poor color rendering (makes colors appear brownish or gray)
Note: Low-pressure sodium (LPS) lamps are sometimes mentioned alongside HID lamps due to their high efficiency (100–200 lm/W), but they are technically a different category of discharge lamp. LPS lamps produce monochromatic yellow light and are primarily used in areas where color recognition is not important, such as highway lighting.
Ballasts and Operation
Like fluorescent lamps, HID lamps require ballasts to:
- Regulate current flow through the lamp
- Provide the high voltage needed to start the arc
- Prevent the lamp from drawing excessive current once operating
Important operational characteristics:
- Warm-up time: HID lamps take 3–5 minutes to reach full brightness when first turned on because the ballast needs time to establish the arc and vaporize the metal salts
- Restrike time: If an HID lamp is turned off while hot, it must cool down (5–15 minutes) before it can restart. This is a significant limitation for applications requiring instant on/off capability.
- Position sensitivity: Some HID lamps must be operated in specific orientations (base up, base down, or horizontal) for optimal performance and lifespan
Advantages and Disadvantages
Advantages:
- High luminous efficacy (more light per watt than incandescent or halogen)
- Long service life (10,000–24,000 hours)
- Compact size relative to light output
- Good for high-ceiling and outdoor applications
Disadvantages:
- Long warm-up and restrike times
- Require ballasts (adding cost and complexity)
- Contain mercury (environmental hazard)
- Light output degrades over time
- Color rendering varies by type (poor for HPS, good for metal halide)
- Being replaced by LED technology in many applications
Modern Context
While HID lamps were once the standard for high-bay industrial lighting, street lighting, and large-area illumination, they are increasingly being replaced by LED lighting, which offers:
- Instant on/off with no restrike time
- Higher efficiency
- Better color rendering
- Longer lifespan
- No mercury content
- Lower maintenance costs

Text description of the HID Light Bulb image.
The image shows four illustrations of different types of light bulbs, each labeled with its name. From left to right, the first bulb is labeled "Mercury Vapor," and it features a teardrop shape with a transparent enclosure and internal components visible. The second bulb is labeled "Metal Halide," similar in shape to the first with slight variations in the internal structure. Third is the "High-Pressure Sodium" bulb, which is more elongated with a central amber-colored tube inside. The last bulb is labeled "Xenon," which has a slim, cylindrical design with a more complex base. Each bulb has a distinctive internal configuration reflecting its function.
When HID lamps reach "restrike" time, the gasses inside the lamp are too hot to ionize, and time is needed for the gasses to cool and pressure to drop before the arc will restrike. This process of restriking takes between 5 and 15 minutes, depending on which HID source is being used. Therefore, good applications of HID lamps are areas where lamps are not switched on and off intermittently. This is why the basketball court lights seem to take a while to come back on if someone accidently hits the switch.
8.7 Types of Lighting: LED
8.7 Types of Lighting: LEDYou've probably heard the term LED—it stands for Light Emitting Diode. But what does that really mean?
Think of an LED as a tiny, super-efficient light maker. Unlike older bulbs that use filaments (like incandescents), gases (like fluorescents or HID lamps), or moving parts, an LED creates light using a special kind of solid material called a semiconductor. When electricity flows through this material, it directly produces light—no heat waste, no fragile parts, no warm-up time.
Why does this matter?
- Long-lasting: LEDs can last 25,000–50,000 hours (that's years of normal use!)
- Energy-saving: They use up to 90% less electricity than incandescent bulbs for the same brightness
- Durable: No glass filament or gas tube to break—great for outdoor lights, phones, cars, and more
- Instant on: Full brightness the moment you flip the switch
- Cooler operation: Less wasted heat means safer fixtures and lower cooling costs
In short: LEDs turn electricity straight into light—cleanly, efficiently, and reliably. That's why they're becoming the go-to choice for everything from nightlights to stadium lights.
LEDs do not directly produce white light. Due to this quirk, LEDs were originally used for colored light applications such as traffic lights and exit signs. LED lighting is very different from other lighting types such as incandescent and CFL. Key differences include:
- Light Source: LEDs are the size of a fleck of pepper, and can emit light in a range of colors. A mix of red, green, and blue LEDs is sometimes used to make white light.
- Direction: LEDs emit light in a specific direction, reducing the need for reflectors and diffusers that can trap light. This feature makes LEDs more efficient for many uses such as recessed downlights and task lighting. With other types of lighting, the light must be reflected to the desired direction and more than half of the light may never leave the fixture.
- Heat: LEDs emit very little heat. In comparison, incandescent bulbs release 90% of their energy as heat and CFLs release about 80% of their energy as heat.
Lifetime: LED lighting products typically last much longer than other lighting types. A good quality LED bulb can last 3 to 5 times longer than a CFL and 30 times longer than an incandescent bulb.
Source "LED-Lighting"- U.S. Department of Energy.

Text description of the LED Traffic Light image.
The image shows a traffic light against a backdrop of cloudy sky. The traffic light consists of three circular lights arranged vertically in a metal casing. Of these, the bottom light is illuminated green, signaling vehicles to proceed. The two upper lights are not lit. The green portion of the traffic light is made up of more than 90 individual LED lights.
Because of their extremely high efficiencies (150 lumens per watt!!, and up to 90 % more efficient than incandescent light bulbs), researchers found ways to convert their outputs to white light. As such, they are one of the highest efficiency lighting options available.
Here are three examples:
- Phosphor conversion, in which a phosphor is used on or near the LED to convert the colored light to white light
- Color-mixed systems, in which light from multiple monochromatic LEDs (e.g., red, green, and blue) is mixed, resulting in white light
- A hybrid method, which uses both phosphor-converted (PC) and monochromatic LEDs.

Text description of the Making white light from LEDs image.
The image is a diagram titled "Creating White Light," showcasing three methods for generating white light using LEDs. Each method is illustrated with a schematic on a gray background.
- The first representation is labeled "Phosphor-Converted LED." It includes a large arrow labeled "White Light" pointing upward, under which a yellow layer labeled "Phosphors" converts the light from a magenta base labeled "Blue or UV LED."
- The middle section is labeled "Color-Mixed LED," displaying another upward-pointing arrow labeled "White Light." Below this, a block labeled "Color mixing optics" is overlaid on blue, green, and red squares labeled "Multi-colored LEDs."
- The third section named "Hybrid Method LED" also features an upward arrow indicating "White Light," above a similar "Color mixing optics" layer. Below it, alternating red and magenta squares are labeled "Colored and PC LEDs."
Beneath these diagrams, a gray panel holds descriptive text for each method:
- "PHOSPHOR-CONVERTED LED: Phosphors are used to convert blue or near-ultraviolet light from the LED into white light."
- "COLOR-MIXED LED: Mixing the proper amount of light from red, green, and blue LEDs yields white light."
- "HYBRID METHOD LED: A hybrid approach uses both phosphor-converted and discrete monochromatic LEDs."
These innovations have allowed these bulbs to be suitable for general lighting in residential applications. These bulbs last for 5-10 years depending on their usage. Now, you can find them in almost every store, and they look something like this.

Text description of the General Purpose LED Lights image.
The image features a row of five LED light bulbs positioned upright on a wooden surface. Each bulb emits a distinct color temperature, creating a gradient from warm to cool light. Starting from the left, the first bulb glows with a warm amber hue, the second with a neutral white light, the third with a cool white light, the fourth with a slightly cooler white, and the fifth with the coolest white light. The wooden surface has a natural, medium-brown color, providing a contrasting background to the bright whites of the bulbs.
8.8 Life Cycle Cost Analysis
8.8 Life Cycle Cost AnalysisBack in Lesson 6, we learned about calculating the Life Cycle Cost Analysis. We can do the same thing with lighting. Performing a life-cycle cost analysis (LCC) gives the total cost of a lighting system—including all expenses incurred over the life of the system. This analysis can be applied not only to lighting but for most of the appliances, automobiles, heating systems, and so on, when two systems are compared to determine the most cost effective options.
There are two reasons to do an LCC analysis:
- To compare different systems, or bulbs in this case.
- To determine the most cost-effective system or a bulb.
For some lighting systems, one of two situations may exist:
- The initial cost may be high, but the energy costs will be low over its lifetime.
- The initial cost to buy a bulb or a system and the energy or the maintenance costs may be low, but the useful life of such a bulb or system may be short. (In this case, we may have to replace the appliance several times to get the same useful life as the other option.)
Therefore, a life-cycle cost (LCC) analysis can be helpful for comparing the total costs incurred over the lifetime of a lighting system. It is, in essence, calculating all the costs incurred to buy, maintain, and run the system over its lifetime.
In the formula above,
- Cost to buy is the purchase price of the lamp or the system.
- Cost to maintain is the cost incurred to maintain it in good operating condition. (For example, in the case of a car, an engine oil change every 3,000 miles is part of maintenance costs.)
- Cost of energy is the energy or the fuel it takes to run the appliance or lamp for its lifetime.
- Replacement cost is the cost to replace the bulb. In this case, the LED has a lifespan of 20,000 hours, so we will need two CFL bulbs over the lifetime. If we were comparing Incandescent lights, we would need 20 bulbs over this lifespan. (Some incandescent lamps had a lifespan of only 1000 hours!)
The table below shows a life cycle cost analysis in comparing a CFL and a LED.
| Category | Compact Fluorescent Lamp (CFL) | Light Emitting Diode (LED) |
|---|---|---|
| Rating | 13 Watts | 8.5 Watts |
| Lumen output | 800 Lumens | 800 Lumens |
| Cost to buy the bulb ($) | $2.87 | $3.50 |
| Life of each bulb | 10,000 h | 20,000 h |
| Bulbs needed for same life | 2 bulbs - $5.74 | 1 bulb - $3.50 |
| Energy Consumption | 13 Watts x 20,000 h 260,000 Wh = 260 kWh | 8.5 Watts x 20,000 h 170,000 Wh = 170 kWh |
| Price of electricity | $0.1625 | $0.1625 |
| Cost of Electricity needed for 20,000 h | 260 kWh x $0.1625/kWh = $42.25 | 170 kWh x $0.1625/kWh = $27.63 |
| Total Cost (Life Cycle costs) to own and operate the bulbs for 20,000 h | $42.25 + $5.74 $47.99 | $27.63 + $3.50 $31.13 |
Replacing a single CFL bulb with an equivalent LED can save approximately $16.86 over 20,000 hours of operation. Now multiply that by the number of fixtures in your home—living room, kitchen, bathrooms, bedrooms, closets, garage, and more. The cumulative savings add up quickly. If you still have incandescent lights in your home, this savings will be even larger.
LEDs also have some other advantages over LEDs. LEDs deliver the same (or better) light quality as CFLs while using less energy, lasting longer, and eliminating mercury concerns. If you still have working CFLs, it's fine to use them until they fail—but when it's time to replace, choose LED for maximum savings and performance.
8.9 Improved Lighting Controls
8.9 Improved Lighting ControlsLighting controls give you the flexibility to adapt a space for multiple uses while improving accessibility. They should be included in the lighting plan for every room. Both manual and automatic controls reduce energy costs by ensuring lights are used only when and where needed.
Controls are especially effective with high-wattage lamps, but they should be considered for any lighting that might be left on in unoccupied spaces. The easiest way to save energy is to turn things off when not in use!
Important: Always choose controls that are compatible with your specific lamp type and ballast. Invest in quality controls—they perform better and last longer.
Types of Lighting Controls
1. Switches
The basic on-off switch (wall-mounted or on the fixture) should always be obvious and convenient.
Best Practices:
- Pull-cord switches: Attach a visible, easy-to-grasp object to the end of the cord
- Multiple entrances: Install three-way or four-way switches in hallways, staircases, and large rooms with more than one entry point
- Visibility: Use oversized toggles or glow-in-the-dark switch plates to make switches easy to find in the dark
- Indicator lights: Install a small light near the switch to signal when out-of-sight lights (basement, outdoor) are left on
- Individual control: If one switch controls multiple fixtures, each lamp should also have its own switch for selective use
- Task separation: In kitchens, put overhead ambient lights, counter lights, and island lights on separate switches
- Multi-level lamps: Use three-way switches in lamps to match light output to need—use the lowest setting when full brightness isn't necessary to save energy
2. Photocells (Photosensors)
A photocell measures ambient light levels and automatically turns electric lights on when light drops below a set minimum.
Best Applications:
- Outdoor fixtures that stay on all night
- Night lights
- Security lighting
Limitations:
- If a light doesn't need to stay on all night, use a timer or motion sensor instead for greater energy savings
3. Timers
Timers control how long a light stays on. They're inexpensive and can be installed at the switch, plug, or socket.
Types:
- Manual timers: Turned on by hand, automatically turn off after a set duration (minutes or hours)
- Programmable timers: Turn on and off at specific times of day
- Mechanical vs. solid-state: Both available; some offer manual override
Safety Tips:
- Don't set timers so lights turn off while someone might still be in the space
- Install glow-in-the-dark switch plates or a low-wattage night light with a photosensor near the switch for easy location
Compatibility Warning: Some screw-base compact fluorescent lamps (CFLs) cannot be used with timers. Always check the manufacturer's recommendations.
4. Motion/Occupancy Sensors
Motion detectors (occupancy sensors) automatically turn lights on when movement is detected and off after a specified period of no motion. They're excellent for energy savings.
Best Applications:
- Bathrooms and bedrooms (where lights are frequently left on)
- Outdoor walkways and driveways
- Security lighting
- Closets, laundry rooms, and garages
Features:
- Automatic operation: On with motion, off after no motion
- Manual override: Some models include on/off switches
- Dimming mode: Reduce light to a preset level instead of turning completely off
- Dual technology: Combine motion detection with photocells so lights only activate when it's dark and motion is detected
Installation Tips:
- Follow manufacturer instructions to ensure proper coverage area
- Verify lamp compatibility before installation
Compatibility Warning:
- Some CFLs should not be used with motion sensors
- High-intensity discharge (HID) lamps are not suitable because they cannot relight quickly after being turned off
5. Dimmers
Dimmers allow occupants to adjust light output, providing energy savings, reduced peak power demand, and enhanced lighting flexibility.
Dimming Fluorescent Lamps
Dimming fluorescent lamps is more complex than dimming incandescents. Standard dimmers don't work because:
- Reducing power cools the filaments, preventing them from emitting electrons properly
- If filaments get too cool, the lamp shuts off entirely
- Forcing current through improperly heated electrodes causes rapid degradation
Solution: Fluorescent dimming requires:
- Special dimming ballasts
- Compatible control devices
- Equipment designed to maintain filament temperature while reducing current
These systems typically work only with specific lamp models.
Dimming HID Lamps
Some high-intensity discharge (HID) dimming systems also require special dimming ballasts.
Dimming Incandescent/LED Lamps
Standard dimmers work well with incandescent and many LED lamps—just verify compatibility on the packaging.
Most lighting controls can connect to smartphones via Wi-Fi or Bluetooth, allowing you to remotely turn lights on/off, set schedules, and adjust brightness through a mobile app.
8.10 Comparison of Different Bulbs
8.10 Comparison of Different BulbsIncandescent Lamps:

- No ballast required: Connect directly to standard line voltage.
- Excellent color quality: Produces a warm white light (~2700 K) with perfect color rendering (CRI = 100).
- Compact point source: Emits light from a small area, which can create harsh glare if fixtures lack proper shielding or diffusers.
- Simple installation: Uses standard screw-in (Edison) bases for easy replacement.
- Low efficiency: Produces relatively little light per watt (low luminous efficacy) and converts most energy into heat.
- Short lifespan: Typically lasts 750–2,000 hours, significantly less than fluorescent or HID alternatives.
- Fragile filament: Sensitive to vibration, shock, and frequent switching, which can shorten lamp life.
- Voltage sensitive: Even minor fluctuations in line voltage can noticeably reduce light output and lifespan.
Fluorescent Lamps:
- Requires a ballast: Needed to start the arc and regulate current during operation.
- Versatile light quality: Available in a wide range of color temperatures and CRI ratings to suit different applications.
- Diffused light output: Larger tube surface area creates lower surface brightness, reducing glare compared to point sources.
- Cooler & more efficient: Operates at lower temperatures and delivers significantly more lumens per watt than incandescent lamps.
- Temperature sensitive: Light output and starting performance drop in extreme cold or heat. Cold environments may require a specially rated ballast.
- Ballast compatibility matters: Must be paired with the correct ballast type and starting method (instant, rapid, or programmed start).
- Thermal protection required: Indoor fixtures must use thermally protected ballasts (historically labeled Class P) that automatically shut off if overheating occurs. Excessive heat still shortens ballast life.
- Airflow dependent: Convection currents and fixture design affect heat dissipation, which in turn impacts efficiency and lifespan.
High Intensity Discharge (HID) Lamps:

- Requires a ballast: Needed to generate the high starting voltage and regulate arc current.
- High light output: Delivers very high lumen packages in a relatively compact form.
- Point source characteristics: The small arc tube acts as a concentrated light source, requiring careful optical control to prevent glare.
- Variable color quality: Color temperature and CRI depend on the specific lamp type (e.g., metal halide offers good color rendering; high-pressure sodium does not).
- Long lifespan & high efficacy: Generally lasts 10,000–24,000 hours and operates more efficiently than incandescent or fluorescent lamps.
- Stable output across temperatures: Unlike fluorescents, light output remains relatively consistent in normal ambient conditions. However, extreme cold can delay starting and may require a specialized ballast.
- Electrical considerations: Sensitive to voltage drops and fluctuations. Circuits must be properly sized to handle high inrush (starting) currents.
- Warm-up & restrike delay: Takes several minutes to reach full brightness when turned on, and requires a cool-down period (5–15 minutes) before it can restart if powered off.
Light Emitting Diode (LED) Lamps

- No external ballast required: Most LEDs have an integrated driver that connects directly to standard line voltage.
- Excellent, customizable color quality: Available in color temperatures from warm white (2700 K) to daylight (5000+ K); high CRI (90+) options widely available.
- Directional light output: LEDs naturally emit light in a specific direction, reducing the need for reflectors—but may require diffusers for even room lighting.
- Simple installation: Uses standard screw-in (Edison) or pin bases; verify dimmer and enclosed-fixture compatibility before installing.
- Highly efficient: Produces 75–90% more light per watt than incandescent; typical efficacy: 80–150+ lumens per watt.
- Very long lifespan: Rated for 25,000–50,000+ hours (15–25+ years at 3 hrs/day use).
- Durable solid-state design: No filament or glass tube; resistant to vibration, shock, and frequent switching.
- Heat management is critical: LEDs don't emit heat forward, but internal components require heat sinks. Overheating reduces lifespan and light output.
- Dimming compatibility varies: Many LEDs are dimmable, but require LED-compatible dimmers and drivers to avoid flicker or buzz.
- Wide temperature tolerance: Perform well in cold environments (ideal for outdoor use); extreme ambient heat can reduce lifespan if thermal management is inadequate.
- Instant on, no warm-up: Reach full brightness immediately with no restrike delay.
- No hazardous materials: Contains no mercury; easier and safer to dispose of than CFLs or HID lamps.
- Higher upfront cost, lower total cost: Purchase price is higher than incandescent or CFL, but energy savings and longevity deliver significant lifetime value.
| Feature / Bulb Type | Incandescent | Fluorescent | HID | LED |
|---|---|---|---|---|
| Ballast/Driver | None | Required | Required | Integrated driver (usually) |
| Efficacy (lm/W) | 10–17 | 50–100 | 35–150 | 80–150+ |
| Lifespan (hours) | 750–2,000 | 8,000–15,000 | 10,000–24,000 | 25,000–50,000+ |
| Color Rendering (CRI) | 100 | 70–95 | 20–90 (type-dependent) | 80–98 |
| Start Time | Instant | Seconds | Minutes | Instant |
| Temperature Sensitivity | Moderate | High | Moderate | Low (heat management needed) |
| Dimmable | Yes (standard) | Special ballast required | Special ballast required | Yes (with compatible driver/dimmer) |
| Mercury Content | No | Yes (trace) | Yes (trace) | No |
| Best For | Decorative, low-use fixtures | Offices, schools, general indoor | High-bay, street, outdoor area | Nearly all applications; retrofits |
8.11 Lighting Review
8.11 Lighting ReviewEGEE 102 Lesson 8 Review
Throughout this lesson, you've learned that lighting is more than just flipping a switch—it's a critical component of energy use in homes, schools, and businesses. Here's what matters most:
Not all light is created equal: Incandescent, halogen, fluorescent, HID, and LED lamps produce light in different ways—with vastly different impacts on energy use, cost, and the environment.
Lumens measure light; watts measure energy: When choosing a lamp, compare lumens (brightness) and lumens per watt (efficiency)—not just wattage. LEDs deliver the most light for the least energy.
Smart design saves energy: Matching the right light level (foot-candles) to the task—whether reading, highlighting art, or walking down a hall—prevents waste. Simple calculations help you determine exactly how many lumens (and lamps) you need.
Color matters: The Color Rendering Index (CRI) affects how true colors appear. For tasks involving color judgment, choose high-CRI lamps (90+), now widely available in LED options.
Controls multiply savings: Switches, timers, photocells, motion sensors, and dimmers ensure lights are used only when and where needed—cutting energy use without sacrificing comfort.
Think long-term: Life-cycle cost analysis reveals that the cheapest lamp upfront isn't always the cheapest over time. LEDs typically offer the lowest total cost through energy savings, longevity, and reduced maintenance.
Test Yourself
The questions below are your chance to test and practice your understanding of the content covered in this lesson. In other words, you should be able to answer the following questions if you know the material that was just covered! If you have problems with any of the items, feel free to post your question on the unit message board so your classmates, and/or your instructor, can help you out!
- How is light measured?
- What factors determine the amount of light that is needed in a room?
- What are the three main methods of producing light?
- Explain the difference between incandescence, fluorescence, and high intensity discharge.
- What are the common ways in which we can improve energy efficiency?
- A 60-watt light bulb produces 3 watts of radiant energy and 57 watts of heat energy. What is its efficiency?
- A 13-watt lamp is left on all day (24 hours). How much did it cost to operate the light bulb if electricity costs 15 cents per kWh?
- A 100 watt incandescent light bulb is operated for 12 hours, and a 15 watt fluorescent light bulb is operated for the same period of time. At 18 cents per kWh, what are the cost savings of the fluorescent bulb?
- Jackie Smith, who is very conscious about the environment, would like to know how much energy she can save by switching to LED lamps. Estimate the total energy savings for Jackie, who uses a light bulb fixture, by comparing the total costs to own and operate an 8-Watt LED instead of the 60 Watt incandescent bulb that she has been using. The expected life of incandescent and LED bulbs is 1000 h and, 18000 hours. The purchase price of an incandescent bulb is $0.50 and the LED is $2.50. If Jackie Smith replaces 24 bulbs at home with LEDs, what would her savings be if the electricity cost is $0.185 per kWh?
Lesson 9: Heating
Lesson 9: HeatingThe links below provide an outline of the material for this lesson. Be sure to carefully read through the entire lesson before returning to Canvas to submit your assignments.
9.1 Lesson 9 Introduction
9.1 Lesson 9 IntroductionWelcome to Lesson 9
In this module, we will explore the science, technology, and economics of keeping homes warm. Whether you're living in a dorm, renting your first apartment, or planning for homeownership, understanding how heating works—and how to use it efficiently—can save you money, increase your comfort, and reduce your environmental impact.
But before we dive into furnaces, heat pumps, and fuel choices, we need to answer two foundational questions:
How much heating does my location actually need?
How do I keep that heat from escaping?
The answers lie in two powerful concepts: Heating Degree Days which is a way to measure climate-based heating demand and Insulation which is the barrier that keeps warmth where you want it.
Once we understand those basics, we'll compare different heating systems, analyze fuel costs, and learn how to calculate whether an energy upgrade is worth the investment.
Learning Objectives
By the end of this module, you will be able to:
- Define the three mechanisms of heat transfer: conduction, convection, and radiation
- Explain what Heating Degree Days (HDD) are and why the base temperature is 65°F
- Describe how insulation works and what R-Value measures
- Identify common home heating fuels (natural gas, oil, propane, electricity) and their typical uses by region
- Calculate daily, monthly, and seasonal Heating Degree Days using average temperature data
- Compare insulation materials using R-Value and explain how layered construction improves thermal resistance
- Calculate simple payback periods for energy upgrades to determine if an investment is financially worthwhile
9.2 Mechanisms of Heat Transfer
9.2 Mechanisms of Heat TransferHeat transfer is the movement of thermal energy from a hotter system to a colder system. This process is driven by temperature differences and is classified into three different mechanisms: conduction, convection and radiation.
Conduction
Conduction is the transfer of heat through direct contact between particles in a solid object. Heat moves from the warmer area to the cooler area through particle collisions.
In solids, atoms and molecules cannot move freely like they do in liquids or gases. Instead, they vibrate in place. When an atom or molecule gains energy, it vibrates more vigorously and transfers that energy to neighboring atoms through physical contact.
Example: In the image below, heat travels from the end of a metal rod in a candle flame to the cooler end. The vibrations pass from one molecule to the next, but the molecules themselves do not move from their positions.
Convection
Convection is the transfer of heat through the movement of fluids (liquids or gases).
In residential heating, convection occurs when warm air rises and cold air sinks. When you open a door, warm indoor air escapes outside while cold air enters through cracks around windows and doors. Inside a room, cold air near the floor absorbs heat from the heater, becomes less dense, and rises. Meanwhile, heavier cold air sinks to take its place, creating a circulation pattern that gradually warms the entire room.
In the image below, heat (energy) is conducted from the end of the rod in the candle flame further down to the cooler end of the rod as the vibrations of one molecule are passed to the next; however, there is no movement of energetic atoms or molecules.
Radiation
Radiation is the transfer of heat through electromagnetic waves. Unlike conduction and convection, radiation does not require any material medium—it can travel through empty space.
Example: In the image below, sunlight travels through the vacuum of space to reach Earth, even though there are no gases, solids, or liquids to carry the energy.
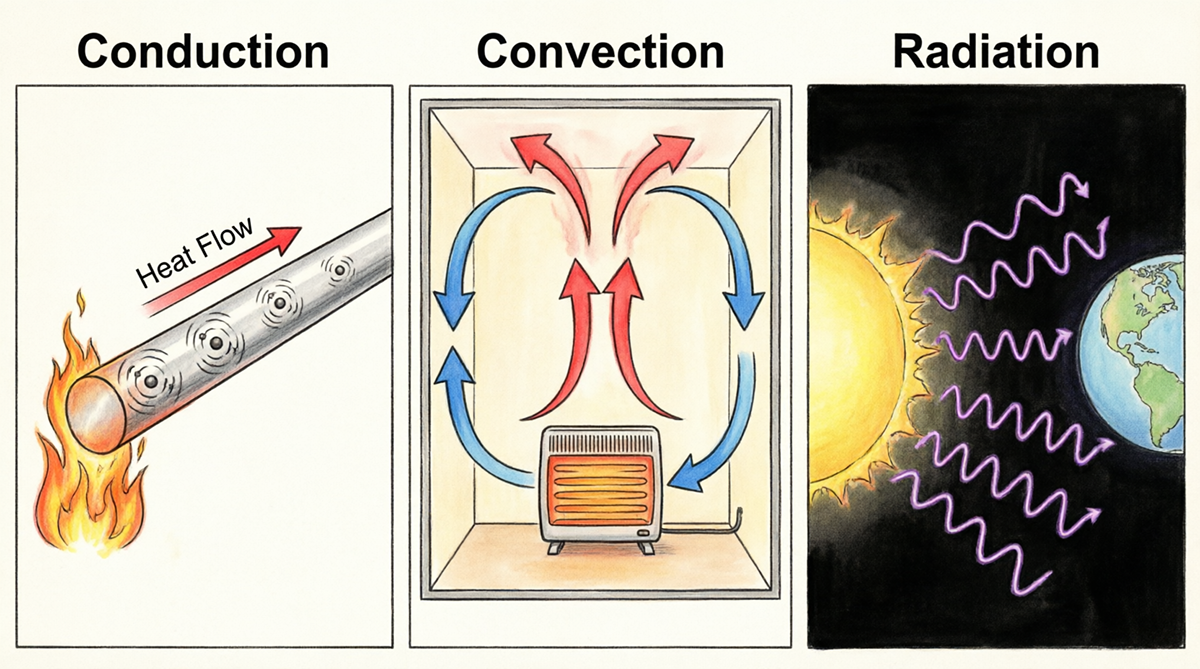
Text description of the Conduction, Convection, and Radiation image.
The image illustrates three methods of heat transfer: conduction, convection, and radiation, each represented within its own panel. The conduction panel on the left depicts a metal rod with visible heat flow represented by concentric circles and an arrow pointing from a flame on the left side of the rod. The middle panel shows convection within a box featuring a heater at the bottom. Arrows indicate a circular flow of red (warm) air rising and blue (cool) air descending. The right panel depicts radiation with the sun on the left emitting wavy lines towards Earth on the right, representing heat transfer through space.
The image below shows how heat can be lost in your home. Where do you think the majority of your energy losses occur?

Text description of the Heat Loss Examples image.
The image depicts a cutaway view of a two-story house, illustrating air flow patterns through various rooms. The house is divided into sections displaying different parts, including the bathroom, living area, and basement.
On the upper level, the bathroom is on the left, featuring a mirror above a sink, next to a toilet and a visible ventilation pipe. In the living area, there is a window and a door leading to a hallway, behind which is a chimney. The right section houses a laundry room with a washer and dryer, while a staircase leads to the basement.
The basement, situated below the main floor, contains a furnace and water heater. Arrows in various colors indicate air movement: red arrows show warm air rising, blue arrows show cool air descending, and purple arrows illustrate drafts or ventilation.
The structure has a gabled roof, and the exterior walls have visible masonry. The surrounding land includes a lawn.
9.3 Degree Days
9.3 Degree DaysWhat is a Degree Day?
Degree days are measures of how cold or warm a location is. Degree days compare the mean (the high temperature plus the low temperature divided by 2) outdoor temperature to a standard temperature; we use 65° Fahrenheit (F) in the United States.
How do you calculate a Degree Day?
The base temperature we use is 65°F. If the mean temperature is above 65°F, we subtract the base temperature (65°F) from the mean, and the result is Cooling Degree Days (CDD). If the mean temperature is below 65°F, we subtract the base temperature from the mean, and the result is Heating Degree Days (HDD).
A cooling degree day indicates a hot day and measures how much air conditioning we need to keep a building cool. A heating degree day indicates a cold day and measures how much heating we need to keep a building warm.
What do people use Degree Day data for?
Degree days are calculated for each day of the year, and we use the daily degree days to compare months and seasons. We often count CDDs and HDDs by census regions and divisions. Generally, people study degree-day patterns to assess the climate and the heating and cooling needs for different regions of the country. For example, the West North Central Census Division generally has the most HDDs, and the West South Central Census Division generally has the most CDDs each year.
Source: U.S. Energy Information Administration - Units and Calculators Explained
Heating Degree Days Examples
Example 1
Calculate the HDD for one day when the average outside temperature is 13°F.
Calculate the HDD for one day when the average outside temperature is 2°C.
Example 2
Given the following data, calculate the HDD for the week:
| Day | Average Temperature |
|---|---|
| Sunday | 49°F |
| Monday | 47°F |
| Tuesday | 51°F |
| Wednesday | 60°F |
| Thursday | 65°F |
| Friday | 67°F |
| Saturday | 58°F |
Heating Degree Day Example 2 Solution
For this problem, we need to calculate HDD for one full week. The data that is given for each day is the average outside temperature. For example, Sunday, the average outside temperature is 49°F. Monday it’s 47°F, Tuesday it’s 51°F, Wednesday it’s 60°F, Thursday it’s 65°F, Friday it’s 67°F, and on Saturday it’s 58°F.
| Day | Average Temperature (°F) |
|---|---|
| Sunday | 49 |
| Monday | 47 |
| Tuesday | 51 |
| Wednesday | 60 |
| Thursday | 65 |
| Friday | 67 |
| Saturday | 58 |
So we need to calculate heating degree days (HDD) for each day. To calculate heating degree days (HDD) for each day, we need to enter the Tbase value of 65 degrees for each day. HDD = Tbase minus the average outside temperature.
| Day | Average Temperature (°F) | Calculate HDD |
|---|---|---|
| Sunday | 49 | 1 day (65-49) |
| Monday | 47 | 1 day (65-47) |
| Tuesday | 51 | 1 day (65-51) |
| Wednesday | 60 | 1 day (65-60) |
| Thursday | 65 | 1 day (65-65) |
| Friday | 67 | 1 day (65-67) |
| Saturday | 58 | 1 day (65-58) |
Now you can calculate the HDD for each day. The HDD for Sunday is 65 degrees (the Tbase) minus 49 degrees (the outside temperature), which equals 16. Monday is 65-47=18, Tuesday is 65-51=14, Wednesday is 65-60=5, Thursday is 65-65=0, Friday is 65-67=0 (Remember when the average outside temperature exceeds 65, the heating degree days would be zero because you do not need to turn the heat on), and Saturday is 65-58=7.
| Day | Average Temperature (°F) | Calculate HDD |
|---|---|---|
| Sunday | 49 | 1 day (65-49)=16 |
| Monday | 47 | 1 day (65-47)=18 |
| Tuesday | 51 | 1 day (65-51)=14 |
| Wednesday | 60 | 1 day (65-60)=5 |
| Thursday | 65 | 1 day (65-65)=0 |
| Friday | 67 | 1 day (65-67)=0 |
| Saturday | 58 | 1 day (65-58)=7 |
Now you can add the degree days for the week.
| Day | Average Temperature (°F) | Calculate HDD |
|---|---|---|
| Sunday | 49 | 1 day (65-49)=16 |
| Monday | 47 | 1 day (65-47)=18 |
| Tuesday | 51 | 1 day (65-51)=14 |
| Wednesday | 60 | 1 day (65-60)=5 |
| Thursday | 65 | 1 day (65-65)=0 |
| Friday | 67 | 1 day (65-67)=0 |
| Saturday | 58 | 1 day (65-58)=7 |
| Total | 60 Degrees |
So the total sum for one full week is 60 degree days.
9.4 Seasonal Heating Degree Days
9.4 Seasonal Heating Degree DaysIn previous examples, we are assuming that the outside temperature remains the same for all 150 heating days in a season. This is not realistic, but it explains the method to calculate the HDD. In a more realistic example, we need to find the temperature difference for each day and add all the temperature differences.
We will now look at Seasonal Heating Degree Days (HDD), which is the sum of temperature differences of ALL days - rather than just 1 day or 1 week - during which heating is required.
The table below provides Seasonal HDDs for selected places in the United States. The higher HDD indicates a higher heat loss and, therefore, higher fuel requirements.
HDD is used to estimate the amount of energy required for residential space heating during a cool season, and the data are published in local newspapers or on the National Weather Service website.
| Place | Degree Days |
|---|---|
| Birmingham, AL | 2,823 |
| Anchorage, AK | 10,470 |
| Barrow, AK | 19,893 |
| Tucson, AZ | 1,578 |
| Miami, FL | 155 |
| Pittsburgh, PA | 5,829 |
| State College, PA | 6,345 |
Source: NOAA
Calculating Seasonal Heating Degree Days
To calculate Seasonal Heating Degree Days, use this formula:
Remember, in months where the average temperature is equal to or greater than 65, there will be no heating degree days, so the value for the month will be 0.
9.5 Insulation
9.5 InsulationWhy Insulation Matters
Keeping your home comfortable year-round starts with good insulation. Two of the simplest and most effective ways to save energy (and lower utility bills) are:
- Sealing air leaks around windows, doors, and ducts
- Adding or upgrading insulation in walls, attics, and floors
What Is Insulation?
Simply put, insulation is any material that slows down the flow of heat. It doesn't "create" warmth; instead, it acts like a thermal barrier that keeps heat inside during winter and outside during summer. A blanket doesn't actually create heat (unless it is an electric blanket), but it traps your body heat and keeping you warm. Your home insulation keeps the heat in your home from escaping.
Understanding R-Value: The Key Metric
Insulation is rated using something called an R-Value. The "R" stands for thermal resistance—how well a material resists heat flow.
The Golden Rule:
Higher R-Value = Better insulation
Lower R-Value = Poor insulation
(Note: R-Value is technically measured in units like ft²·°F·h/BTU, but you don't need to memorize the math. Just remember: the number tells you how well the material blocks heat.)
Real-World Example: Windows vs. Walls
- Single-pane window on a cold day: Feels freezing to the touch. Glass has a very low R-Value, so heat escapes easily.
- Interior wall: Feels much warmer. Behind the drywall, there's insulation (like fiberglass or foam) with a higher R-Value, which traps heat inside your living space.
How Layers Work Together
Insulation rarely works alone. In real homes, multiple materials combine to increase the overall R-Value. A typical exterior wall might include:
- Plywood sheathing
- Fiberglass or spray foam insulation
- Drywall
- Exterior siding or brick veneer
Each layer adds its own R-Value. When stacked together, they create a much stronger thermal barrier than any single material could provide on its own.
Look at the table below to learn about six types of insulation.
| Insulation | What is it made of? | What does it look like? | Additional Information |
|---|---|---|---|
Fiberglass
| Molten glass spun into microfibers | Pink or yellow in the form of batts or rolled blankets. | |
Rock Wool
| Basalt Rock (a volcanic stone) and recycled steel slag | Gray or brown fibers in batts or blankets or as shredded loose-fill. | Manufactured in a similar way as fiberglass, but with molten rock instead of glass. |
Cellulose
| Recycled paper – newsprint or cardboard shredded into small bits of fiber. | Blown in as loose fill. | It is treated with fire- and insect-resistant chemicals. |
Rigid Foam
| Different types, but some made from post-consumer recycled content from fast food containers and cups. | Rigid sheets that are applied directly to framing. | Best where space is limited, but a high R-value is needed. Can be installed on the interior of a wall, but if installed inside, must be covered by a fire resistant material like wallboard. One drawback to foam is it deteriorates unless it is protected from prolonged exposure to sunlight and water. It is also more expensive than other insulation. |
Synthetic Insulation
| Usually polystyrene or polyurethane foam. | Polystyrene comes as rigid boards, and Polyurethane comes as rigid boards or sprayed in place systems. | Polystyrene is used for insulating basements, cathedral ceilings, or sidewalls. Polyurethane foams are high performance insulating materials. |


Calculating the Composite R value of a wall, you would just add up all the R values of each layer.
Example
A ceiling is insulated with 0.75" plywood, 2" of polystyrene board, and a 3" layer of fiberglass. What is the R-Value for the ceiling?
Solution:
The ceiling consists of three layers, and all three layers together prevent the heat loss. So, we need to add the R-values of all three layers
¾" of plywood has an R-value of 0.94
2" of polystyrene at 5.0 per inch will have an R-value of 10.00
3" of fiberglass at 3.7 per inch will have an R-value of 11.10
So the R-value of the ceiling is 22.04 ft2 oF h / BTU.


Text description of the Wall Assembly R-Value Breakdown image.
The image illustrates a wall assembly with a focus on the R-Value breakdown, depicting different layers of wall construction and their respective R-Values against a blue background. On the left, a cross-section of a wall is shown with five distinct layers. From the exterior inward, these layers are: brick, wood siding, plywood sheathing, fiberglass insulation, vapor barrier, and drywall. To the right of the wall diagram, each layer is labeled with its material and corresponding R-Value contribution. The R-Values are: wood siding (+R-0.8), plywood sheathing (+R-0.5), fiberglass insulation (+R-11), vapor barrier (+R-0.5), and drywall (+R-0.5). Beneath these, the combined total R-Value is indicated as R-13. At the bottom, a red and orange gradient bar underscores the message: "Better Insulation = Higher R-Value."
9.6 Home Heating Fuels
9.6 Home Heating FuelsIn the United States, the fuel used to heat homes depends largely on location, climate, and available infrastructure.
Regional Patterns:
- Northeast: Cold winters mean high heating needs. Many homes use heating oil or natural gas.
- Midwest & Mountain States: Natural gas and propane are common; some rural areas still use wood or coal.
- South: Milder winters (fewer "heating degree days"—a measure of how cold it is over time) mean less heating overall. Electricity is the dominant heating source here.
- West Coast: Mix of natural gas and electricity, with growing interest in heat pumps and renewable energy.
Looking Ahead: Electricity is the second-most used heating fuel nationwide—and its use is expected to grow. Many states are promoting "electrification" (switching from gas/oil to electric systems) to reduce carbon emissions.

Text description of the Share of Homes by Primary Space Heating Fuel and Census Region image.
The image is a map of the United States divided into four Census regions: West, Midwest, South, and Northeast. Each region features a pie chart representing the primary space heating fuels used in 2009. The pie charts are color-coded according to a legend on the right, showing different fuels: natural gas (yellow), electricity (blue), heating oil (brown), propane (green), wood (light-brown), and kerosene/other (gray). In the West, the pie chart shows a majority in electricity with natural gas as a significant portion. The Midwest chart is dominated by natural gas. The South has a large section for electricity with natural gas also significant. The Northeast shows a mix of heating oil, natural gas, and electricity. The lower right corner has a separate pie chart indicating the U.S. total, summarizing 110 million heated homes, showing a predominant use of natural gas and electricity.
Fuel Comparisons
| Fuel | Capacity | Consumption | Additional Information |
|---|---|---|---|
| Natural Gas | Measured in British thermal units per hour (BTU/h). Most heating appliances for home use have heating capacities of between 40,000 and 150,000 BTU/h. In the past, gas furnaces were often rated only on heat input; today the heat output is given. | Consumption of natural gas is measured in cubic feet (ft3). This is the amount that the gas meter registers and the amount that the gas utility records when a reading is taken. One cubic foot of natural gas contains about 1,000 BTU of energy. | Utility companies often bill customers for CCF (100 cu. ft) or therms of gas used: one therm equals 100,000 BTUs. Some companies also use a unit of MCF, which is equal to 1,000 cu. ft. One MCF equals 1,000,000 BTUs (1 MM BTUs). |
| Propane or Liquefied Petroleum Gas (LPG) | Measured according to BTU/h. | Consumption of propane is usually measured in gallons; propane has an energy content of about 91.300 BTUs per gallon. | Can be used in many of the same types of equipment as natural gas. It is stored as a liquid in a tank at the house, so it can be used anywhere, even in areas where natural gas hookups are not available. |
| Fuel Oil | The heating (bonnet) capacity of oil heating appliances is the steady-state heat output of the furnace, measured in BTU/h. Typical oil-fired central heating appliances sold for home use today have heating capacities of between 56,000 and 150,000 BTU/h. | Oil use is generally billed by the gallon. One gallon of #2 fuel oil contains about 140,000 BTU of potential heat energy. | Several grades of fuel oil are produced by the petroleum industry, but only #2 fuel oil is commonly used for home heating. |
| Electricity | The heating capacity of electric systems is usually expressed in kilowatts (kW); 1 kW equals 1,000 W. A kilowatt-hour (kWh) is the amount of electrical energy supplied by 1 kW of power over a 1-hour period. Electric systems come in a wide range of capacities, generally from 10 kW to 50 kW. | Electricity is sold in kWh (kilowatts per hour). | The watt (W) is the basic unit of measurement of electric power. |
Heating Values of various fuels
Each unit of fuel when burned gives different amounts of energy. The energy that is released when a unit amount of fuel is burned is called the heating value. The heating value of a fuel is determined under a standard set of conditions. A comparison of approximate heating values of various fuels is shown in the table below.
| Fuel | Unit | Heating Value (BTU's) |
|---|---|---|
| Natural Gas | CCF (100 Cu. ft) or Therm | 100,000 |
| Natural Gas | MCF (1,000 Cu.ft) | 1,000,000 |
| Fuel Oil | Gallon | 140,000 |
| Electricity | kWh | 3,412 |
| Propane | Gallon | 91,300 |
| Bituminous Coal | Ton | 23,000,000 |
| Anthracite Coal | Ton | 26,000,000 |
| Hardwood | Cord | 24,000,000 |
Just as we saw back in Lesson 2, all energy conversion devices are not 100% effect. In most heating systems, we have some sort of furnace or boiler to burn our fuel. This process is not perfectly efficient.
Annual Fuel Utilization Efficiency (AFUE)
What Is AFUE?
AFUE (Annual Fuel Utilization Efficiency) is a rating that tells you how efficiently a furnace or boiler converts fuel into usable heat over an entire heating season.
Simple Definition:
AFUE = (Heat Output ÷ Fuel Input) × 100%
Think of it like a report card for your heating system—the higher the score, the better it performs!
How to Read AFUE Ratings
| AFUE Rating | What It Means | Example |
|---|---|---|
| 90% | 90% of fuel becomes heat; 10% is lost | For every $100 spent on fuel, $90 heats your home, $10 goes up the chimney |
| 80% | 80% efficient; 20% wasted | Older systems often fall in this range |
| 98% | Nearly all fuel is used for heating | Top-tier modern ENERGY STAR models |
What AFUE Does (and Doesn't) Measure
AFUE Measures:
- Efficiency of the furnace or boiler itself
- How well the unit converts fuel to heat at the source
- Performance under standardized testing conditions
AFUE Does NOT Measure:
- Heat loss through ductwork (leaky ducts can waste 20–30% of heated air)
- Poor insulation or air leaks in your home
- Thermostat settings or user behavior
- Distribution losses from pipes (in boiler systems)
Important: A 95% AFUE furnace can still heat your home inefficiently if your ducts are leaky or your attic isn't insulated!
9.7 Furnaces and Boilers
9.7 Furnaces and Boilers mxw1429.7.1 What Is a Furnace?
9.7.1 What Is a Furnace?A furnace is a heating system that warms air and distributes it throughout your home through a network of ducts and vents. It's the most common type of home heating system in the United States.

Text description of the Residential Furnace image.
The image features a furnace unit labeled "Lennox" positioned against a wall in a basement or utility area. The furnace consists of a gray metal body with a smooth texture and includes various components such as a large, curved duct that leads to the top of the unit. To the left, there is a metallic panel that holds a document with installation or operation guidelines, secured within a transparent holder. Below the furnace, there are several warning stickers and informational labels, including cautionary symbols related to safety. The surrounding environment appears to be unfinished concrete, with some visible piping and a glimpse of a red cooler in the background.
How Does a Furnace Work?
Most homes use gas furnaces. Here's the basic process:
- Ignition: Natural gas is lit in the burner
- Heat Exchange: The flames heat up a metal component called the heat exchanger
- Air Warming: Cool air from your home passes over the hot heat exchanger
- Distribution: A blower fan pushes the warmed air through ducts to rooms throughout your house
Energy Efficiency: What to Look For
When shopping for a furnace, energy efficiency saves money and reduces environmental impact. Here are three key features to understand:
AFUE Rating
AFUE (Annual Fuel Utilization Efficiency) measures how efficiently a furnace converts fuel into heat—similar to MPG for cars.
- Higher AFUE = Better efficiency
- Modern gas furnaces: 89–98% AFUE
- Example: A 90% AFUE furnace converts 90% of fuel into heat; 10% is lost
Heating Stages
Furnaces can have different operating modes:
| Type | How It Works | Energy Use |
|---|---|---|
| Single-stage | Runs at full power only | Less efficient |
| Two-stage | High or low power settings | More efficient |
| Variable-speed | Adjusts output continuously | Most efficient |
Think of it like a car: cruising at a steady (continuous) speed uses less gas than accelerating to full speed, coasting, and accelerating back to full speed.
ENERGY STAR Certification
ENERGY STAR is a government-backed label for energy-efficient products. Furnaces with this certification meet strict efficiency guidelines and can save you money on utility bills.
| Feature | Gas Furnace | Oil Furnace |
|---|---|---|
| Efficiency | 89–98% AFUE | 80–90% AFUE |
| Upfront Cost | Higher | Lower |
| Fuel Cost | Natural gas is cheaper | Heating oil is more expensive |
| Availability | Requires gas lines | Can be used anywhere (fuel delivered by truck) |
| Popularity | Most common today | Older homes, rural areas |
Bottom Line: Gas furnaces cost more upfront but save money long-term through better efficiency and lower fuel costs.
Furnace Maintenance Tips
A well-maintained furnace can last 15–20 years. Follow these basics:
Professional Installation: Most problems come from poor installation, not equipment failure
Annual Service: Have a technician inspect your furnace before each heating season
Filter Changes: Replace air filters every 1–3 months (dirty filters reduce efficiency and air quality)
Keep Vents Clear: Make sure air vents and the furnace area aren't blocked
9.7.2 What Is a Boiler?
9.7.2 What Is a Boiler?A boiler is a heating system that warms water (or creates steam) and circulates it through pipes to radiators or baseboard heaters throughout your home.

Text description of the Oil Heating Boiler image.
The image depicts an oil heating boiler system, illustrated in a diagrammatic format. At the center is a cylindrical combustion chamber filled with water, which exhibits a swirling pattern, indicating the flow of heated water. The water is color-coded, with the top half in shades of red representing hot water and the bottom half in shades of blue indicating cooler water. Below the combustion chamber, a flame is visible, symbolizing the burner mechanism that heats the water. Surrounding the boiler are several components labeled with clear text: an expansion tank is on the left, allowing for fluid expansion; a flue at the top releases smoke; a circulator pumps water; and heating pipes extend outward at the right, showing the flow of hot water into a heating system. Additional elements at the bottom include an oil tank, filter, fuel pump, and controls, alongside a thermostat for regulating temperature.
How It Works:
- Fuel (gas, oil, or electricity) heats water in a sealed tank
- Hot water or steam travels through pipes
- Radiators release heat into rooms
- Cooled water returns to the boiler to be reheated
| Feature | Furnace | Boiler |
|---|---|---|
| What It Heats | Air | Water/Steam |
| How Heat Moves | Through ducts and vents | Through pipes to radiators |
| Distribution | Forced air | Hydronic (water-based) |
| Also Provides | Can include air conditioning | Usually heating only |
Key Point: Both systems heat your home—they just use different methods to move heat energy around.
Repair or Replace? When to Make the Call
Heating systems typically last 15–20 years with proper care. Consider replacement if:
- Your furnace is over 10–15 years old
- AFUE rating is 80% or lower (modern units are 90%+)
- Frequent breakdowns or costly repairs
- Rising energy bills without increased usage
- Uneven heating throughout your home
- Unusual noises (banging, hissing, rattling)
- Visible rust, cracks, or leaks
Rule of Thumb: If repair costs exceed 50% of the price of a new system, replacement is usually the smarter investment.
9.8 Radiant Heating
9.8 Radiant HeatingBaseboard Radiators
In the baseboard hydronic heating systems (shown below), water is heated in a gas-fired or oil-fired furnace located in the basement. The heated water is distributed through pipes into baseboards in various rooms. The heat is then delivered through radiation and convection. Although these are called radiant heating systems, most of the heat delivered is by convection. Heat delivery into rooms or zones can be controlled by flaps or louvers.
Radiant Floor Heat

Text description of the Radiant Floor Heating image.
The image depicts a section of a modern interior space, focusing on a flooring installation. The foreground features wooden floorboards that have a light, natural finish. Underneath the wooden planks, bright red heating pipes can be seen, which are arranged in a looping pattern on a light gray tiled surface. The tiles have a grid-like design, enhancing the structural appearance of the floor beneath. In the background, large windows allow natural light to flood the room.
There are three types of radiant floor heat:
- Radiant air floors (air is the heat-carrying medium)
- Electric radiant floors
- Hot water (hydronic) radiant floors.
Types of Installation
Electric radiant floors
Electric radiant floors are usually only cost-effective if your electric utility company offers time-of-use rates. Time-of-use rates allow you to “charge” the concrete floor with heat during off-peak hours (approximately 9 p.m. to 6 a.m.). If the floor's thermal mass is large enough, the heat stored in it will keep the house comfortable for eight to ten hours without any further electrical input. This practice saves a considerable number of energy dollars compared to heating at peak electric rates during the day.
Hydronic systems
Hydronic (liquid) systems, popular and cost-effective systems for heating-dominated climates, have been in extensive use in Europe for decades.
Hydronic radiant floor systems pump heated water from a boiler through tubing laid in a pattern underneath the floor. The temperature in each room is controlled by regulating the flow of hot water through each tubing loop via a system of zoning valves or pumps and thermostats.
9.9 Heat Pumps
9.9 Heat PumpsUnder natural circumstances, heat only flows from high temperatures to low temperatures. In order to move heat from a low temperature environment to a high temperature environment, work needs to be done (or rather energy needs to be spent).
A device that moves the heat from a low temperature environment to a high temperature environment is called a heat mover. Recall Lesson 6 when we learned about refrigerators, this is the same principal.
An example of a heat mover is a heat pump. A heat pump is a heating/cooling system and also a forced-air system. Cooled (and sometimes humidified or electronically cleaned) air is usually delivered through the same ductwork and registers used by heated air.
A heat pump uses air-conditioning principles to extract heat from one place and deliver it to another, and vice versa. In addition to expelling heat from indoors, the system can be reversed to heat the home in the winter. Thus, a heat pump is a device that moves heat from a low-temperature to a high-temperature environment with the help of work that is put in.
Heat pumps are classified based on the low-temperature heat source:
- Air-source heat pump or Air-to-air heat pump.
Heat is transferred from the low-temperature air outside to the high-temperature interior. - Ground-source heat pump or Ground-to-air heat pump.
The earth is used as a heat sink in the summer and a heat source in the winter; the pump relies on the relative warmth of the earth for its heating and cooling production. - Water-source heat pump or Water-to-air heat pump.
Heat is transferred from low-temperature water outside (from a pond or a lake) to a high-temperature interior.
Efficiency of a Heat Pump
Efficiency of a heat pump is measured using a term Coefficient of Performance (COP), and it is the ratio of the useful heat that is pumped to a higher temperature, to a unit amount of work that is put in. We will look at COP in terms of air-source heat pumps.
A general expression for the efficiency of a heat engine can be written as:
Using the same logic that was used for heat engines, this expression becomes:
Where, Q Hot = Heat input at high temperature and Q cold= Heat rejected at low temperature. The expression can be rewritten as:
Note: Thot and Tcold must be expressed in the Kelvin Scale.
9.9.1 Air Source Heat Pumps
9.9.1 Air Source Heat PumpsAn air-source or air-to-air heat pump can provide both heating and cooling.
- In the winter, a heat pump extracts heat from outside air and delivers it indoors.
- On hot summer days, it works in reverse, extracting heat from room air and pumping it outdoors to cool the house.

Text description of the Heat Pump image.
The image is divided into two parts. On the left, there is a photograph of an outdoor heat pump unit positioned next to a brick wall, with greenery in the background. The unit is rectangular, featuring a large round fan in a mesh-covered front and is raised slightly above the ground on four black legs.
On the right side of the image, there is a diagram illustrating the refrigeration cycle of a heat pump system. The diagram shows a house with arrows indicating the flow of refrigerant between the outdoor and indoor components, with distinguishing features such as a compressor, fan, outdoor coils, and indoor coils. The components are depicted in a colorful manner, with blue and red lines indicating the flow of gas and liquid along with directional arrows.
Nearly all air-source and air-to-air heat pumps are powered by electricity. They have an outdoor compressor/ condenser unit that is connected with refrigerant-filled tubing to an indoor air handler. As the refrigerant moves through the tubing of the system, it completes a basic refrigeration cycle, warming or cooling the coils inside the air handler. The blower pulls in room air, circulates it across the coils, and pushes the air through ductwork back into rooms.
When extra heat is needed on particularly cold days, supplemental electric-resistance elements kick on inside the air handler to add warmth to the air that is passing through.
The Balance Point
As we have learned, air-source and air-to-air heat pumps work by extracting heat from the outside air. These heat pumps require a backup system to supplement their heating ability when the outdoor temperature gets below a certain temperature.
As the outdoor temperature drops, the heating requirement of the house increases and the output of the heat pump decreases. At some point, the temperature of the home’s heating requirement and the heat pump output match. This temperature is called the balance point and usually falls between 30-45 degrees Fahrenheit. For any temperatures below the balance point, supplemental heat will be required.
To locate the balance point, the heating requirement (BTUs/h) of the house and the heat pump output (BTUs/h) are plotted against the changes in outside temperature. The place where the home heating requirement and heat pump output lines cross is the balance point.
Take a look at the graph of the Balance Point.

Text description of the Balance Point Graph.
The image is a line graph depicting the relationship between temperature and heating requirements, heat pump output, and supplemental heat. The x-axis represents temperature in degrees Fahrenheit, ranging from 0 to 80. The y-axis represents BTUs per hour, ranging from 0 to 70,000. Three lines intersect on the graph:
- A brown dashed line labeled "Heat Pump Output" begins near the bottom right and slopes upwards to the left, indicating increasing BTU output as the temperature decreases.
- A green solid line labeled "Home Heating Requirement" starts at the top left and slopes downwards to the right, showing decreasing BTU requirements as the temperature increases.
- A green shaded area labeled "Supplemental Heat" fills the upper left portion between the green solid line and the y-axis.
The "Balance Point" is marked where the brown and green lines intersect, indicating where the heat pump output meets the home heating requirement.
9.9.2 Ground Source Heat Pumps
9.9.2 Ground Source Heat PumpsGround-source or geothermal heat pumps (GHPs) are similar to the air-source heat pumps, except that the source of heat is the ground instead of outdoor air.
Closed-Looped Systems
Horizontal
The horizontal type of installation is generally most cost-effective for residential installations, particularly for new construction where sufficient land is available. It requires trenches at least four feet deep.
Horizontal systems come in two types of layouts, the two pipes method and the slinky method.
Two Pipes
The most common horizontal layouts include:
Two Pipes Layout (Option 1) - One pipe buried at six feet, and another pipe buried at four feet.

Two Pipes Layout (Option 2) - Both pipes placed side-by-side at five feet in the ground in a two-foot wide trench.

The Slinky™ Method
The pipe is looped to allow more pipes in a shorter trench, which cuts down on installation costs and makes horizontal installation possible in areas not possible with conventional horizontal applications. Large commercial buildings and schools often use vertical systems because the land area required for horizontal loops would be prohibitive

Vertical
This type of system may be used when the soil is too shallow for trenching or when one does not want to disturb the existing landscaping.
For a vertical system, holes (approximately four inches in diameter) are drilled about 20 feet apart and 100 to 400 feet deep. Into these holes go two pipes that are connected at the bottom with a U-bend to form a loop. The vertical loops are connected with horizontal pipe (i.e., manifold), placed in trenches, and connected to the heat pump in the building

Benefits of GSHP
Click on the benefit listed below to find out more information.
- Low Energy Use
The biggest benefit of GHP's is that they use 20 to 50 percent less electricity than conventional heating or cooling systems. This translates into a GHP using one unit of electricity to move three units of heat from the earth.
According to a report by Oak Ridge National Laboratory, statistically valid findings show that the 4,003-unit GHP retrofit project at Fort Polk, LA, will save 25.8 million kilowatt-hours (kWh) in a typical year, or 32.5 percent of pre-retrofit whole-community electrical consumption. This translates to an average annual savings of 6,445 kWh per housing unit. In addition, 100 percent of the whole-community natural gas previously used for space conditioning and water heating (260,000 therms) will be saved.
In housing units that were all-electric in the pre-retrofit period, the GHP's were found to save about 42 percent of the pre-retrofit electrical consumption for heating, cooling, and water heating.
- Free or Reduced-Cost Hot Water
Unlike any other heating and cooling system, a geothermal heat pump can provide free hot water. A device called a super heater transfers excess heat from the heat pump's compressor to the hot water tank. In the summer, hot water is provided free; in the winter, water heating costs are cut roughly in half.
- Year-Round Comfort
While producing lower heating bills, geothermal heat pumps are quieter than conventional systems, and improve humidity control. These features help explain why customer surveys regularly show high levels of user satisfaction, usually well over 90 percent.
- Design Features
Geothermal heat pump systems allow for design flexibility, and can be installed in both new and retrofit situations. Because the hardware requires less space than that needed by conventional HVAC systems, the equipment rooms can be greatly scaled down in size, freeing space for productive use. Also, geothermal heat pump systems usually use the existing ductwork in the building and provide simultaneous heating and cooling without the need for a four-pipe system.
- Improved Aesthetics
Architects and building owners like the design flexibility offered by GHP's. Historic buildings like the Oklahoma State Capital and some Williamsburg, Virginia, structures use GHPs because they are easy to use in retrofit situations and easy to conceal, as they don't require cooling towers.
GHP systems eliminate conventional rooftop equipment, allowing for more aesthetically pleasing architectural designs and roof lines. The lack of rooftop penetrations also means less potential for leaks and ongoing maintenance, and better roof warranties. In addition, the aboveground components of a GHP system are inside the building, sheltering the equipment both from weather-related damage and from potential vandalism.
- Low Environmental Impact
Because a GHP system is so efficient, it uses a lot less energy to maintain comfortable indoor temperatures. This means that less energy is often created from burning fossil fuels than is needed to operate a GHP. According to the EPA, geothermal heat pumps can reduce energy consumption and corresponding emissions up to 44 percent compared to air-source heat pumps, and up to 72 percent compared to electric resistance heating with standard air conditioning equipment.
- Low Maintenance
According to a study completed for the Geothermal Heat Pump Consortium (GHPC), buildings with GHP systems had average total maintenance costs ranging from 6 to 11 cents per square foot, or about one third that of conventional systems. Because the workhorse part of the system, the piping, is underground or underwater, there is little maintenance required. Occasional cleaning of the heat exchanger coils and regularly changing the air filters are about all the work necessary to keep the system in good running order.
- Zone Heating and Cooling
These systems provide excellent zone space conditioning - different areas of the building heated or cooled to different temperatures simultaneously. For example, GHP systems can easily move heat from computer rooms (which need constant cooling) to the perimeter walls for winter heating in commercial buildings. School officials like the flexibility of heating or cooling just auditoriums or gymnasiums for special events rather than the entire school.
- Durability
Because GHP systems have relatively few moving parts, and because those parts are sheltered inside a building, they are durable and highly reliable. The underground piping often carries warranties of 25 to 50 years, and the GHP's often last 20 years or more.
- Reduced Vandalism
GHPs usually have no outdoor compressors or cooling towers, so the potential for vandalism is eliminated.
9.9.3 Water Source Heat Pumps
9.9.3 Water Source Heat PumpsPond
If a home has source surface water, such as a pond or lake, this type of loop design may be the most economical, since there is no need to dig a trench or a well for the pipes in the ground. In this type of system, the fluid circulates through polyethylene piping in a body of water, just as it does in the ground loops. The pipe may be coiled in a slinky shape to fit more of it into a given amount of space. This loop is recommended only if the water level never drops below six to eight feet at its lowest level, to assure sufficient heat-transfer capability. Pond loops used in a closed system result in no adverse impacts on the aquatic system.

Open-Loop Systems
This type of system uses well(s) or surface body water as the heat exchange fluid that circulates directly through the GHP system. Once it has circulated through the system, the water returns to the ground through the well, a recharge well, or a surface discharge. This option is obviously practical only where there is an adequate supply of relatively clean water, and all local codes and regulations regarding groundwater discharge are met.

9.10 Solar Heating Systems
9.10 Solar Heating SystemsThe sun can be used as free source of heating, similar to what we saw in Lesson 7 on solar hot water systems. Active solar heating is quite rare, however many locations take advantage of passive solar heating in designing of homes.
Active Solar Heating
Active solar heating systems operate as follows:
- Flat plate collectors are usually placed on the roof or ground in the sunlight. The top or sunny side has a glass or plastic cover to let the solar energy in. The inside space is a black (absorbing) material to maximize the absorption of the solar energy.
- A fluid (water, glycol mixture or even air) is drawn from the storage tank by pump #1 and is pumped through the flat plate collector mounted on the roof of the house.
- The fluid absorbs the solar energy and is returned back to the tank.
- Warm water from the tank is pumped by pump #2 though the heating coil.
- The fan blows air (from the room) over the heated coil, and the heated air then passes into the room and heats the room.
- Cold air sinks to the bottom and is recirculated over the heating coil.
Note: The standby electric coil is automatically turned on and provides the heat when the water temperature to the heating coil drops because of consecutive cloudy days.
Passive Solar Heating

Text description of the Passive Solar Heating image.
The image illustrates a cross-section of a house designed for solar efficiency. The house features a sloped roof with solar water heat collectors positioned along the top, capturing sunlight from the sun. To the left, south-facing windows allow sunlight to enter the building, while insulated shades help manage heat. Beneath the windows, a thermal mass wall absorbs and retains heat. Inside, radiant heat thermal mass flooring is depicted, with arrows indicating heat distribution. A solar hot water storage tank is visible on the right side of the image. Two suns are included, one labeled “Summer High-Angle Sun” and the other “Winter Low-Angle Sun,” indicating the seasonal angle of sunlight exposure.
Passive systems do not use mechanical devices such as fans, blowers, or pumps to distribute solar heat from a collector. Instead, they take advantage of natural heat flow to distribute warmth. An example of a passive system for space heating is a sunspace or solar greenhouse.
Passive systems also make use of materials with large heat capacities (stone, water, or concrete) to store and deliver heat. These are called thermal masses.
Passive systems can be categorized into three types:
- Direct Gain - Allows the solar energy to come in through the south-facing window panes.
- Indirect Gain - Allows the solar radiation to heat a wall and then the energy is slowly delivered into the interior of the house. Openings in the wall (called a Trombe Wall), as shown in the figure below, promote convective currents:
- Cold room air enters the space between the glass panel and the wall through the bottom opening.
- As this cold air gets heated, it rises to the top and comes in through the top opening.
- Greenhouse Addition - An attached sunspace and/or solar greenhouse heated by the solar energy - where some of the energy is used to grow the plants and some of it is used to heat the interior of the house.
These systems are shown below.

Text description of the Addition Methods image.
The image is a diagram with three sections comparing different methods of solar gain in buildings. Each section is a simplified illustration of a house cross-section, showing how sunlight enters and affects the interior space.
The first section, labeled "Direct Gain," depicts sunlight entering directly through a window into a room. The house is drawn with a simple silhouette of a roof and walls, with a red arrow representing sunlight entering the room straight through the window.
The second section, labeled "Indirect Gain," shows sunlight hitting an interior thermal mass, such as a wall, which then radiates heat into the room. The illustration includes a red arrow pointing to the thermal mass, demonstrating the indirect flow of heat.
The third section, labeled "Greenhouse Addition," illustrates sunlight entering a greenhouse-like structure attached to the house before entering the main living space. This section includes two red arrows indicating sunlight entering the greenhouse and then proceeding into the building's interior
9.11 Operating Costs of Heating your Home
9.11 Operating Costs of Heating your HomeIt is clear now that when a unit of fuel is burned not all of it is available to the end user, and that as the furnace efficiency increases, higher amounts of heat will be available. An important question that needs to be addressed is how much it costs to buy the energy or heat to heat a place.
Fuel is usually sold in gallons or CCF or kWh. Comparing the actual cost of energy to produce a certain amount of heat for the end user would be easy if the comparison is made on an energy basis rather than on a unit basis. That is, \$/BTUs or ($/million BTU) rather than \$/gal or CCF or kWh.
Just a note: Industry uses MMBTU to mean Millions of BTU, this is just convention. MCF means 1000 Cubic Feet of Natural gas.
We can use the following formula to calculate Actual Energy Cost:
Energy Cost Examples
Example
Let’s say we need one million BTUs to keep a place warm at a certain temperature. What would it cost to get those million BTUs from oil or gas or electricity? Let’s assume that:
| Material | Cost per unit | Efficiency | Heating Value |
|---|---|---|---|
| Natural Gas | $3.20/MCF | 90% | 1,000,000 BTUs or 1.0 MM BTU/MCF |
| Oil | $5.53/Gallon | 85% | 140,000 BTUs or 0.14 MM BTUs/Gallon |
| Electricity | $0.1742/kWh | 97% | 3,412 BTUs or .003412 MM BTUs/kWh |
Note: The costs per unit vary widely by season and geopolitical factors
Using the formula below, we can calculate the Actual Energy Cost.
Video: Energy Cost Example (with prices from 1995) (2:44)
Transcript: Energy Cost Example
Onscreen Text: Natural gas costs $9.74/MCF. Heating oil costs $0.99/gal. The natural gas furnace runs at 90% efficiency and the oil furnace runs at 80% efficiency. Which fuel is cheaper?
Presenter: Ok. This 5.7 is an interesting problem here. We are trying to compare the prices of two fuels – Natural Gas which sells for $9.74/MCF, and we also have oil that sells at $0.99/gallon. We are trying to compare the prices of these two and choose which one is the best fuel or cheapest fuel. So we need to calculate the price per million BTUs so that we can compare these two fuels. And we also know the furnace efficiencies of each of these. Natural gas furnace efficiency is 0.9, and we know the oil furnace efficiency is 0.8; it is given. So we need to calculate the actual cost and compare the cost.
Natural gas actual cost will be cost per unit fuel, which is $9.74/MCF divided by the heating value per unit fuel. Heating value for this one happens to be 1.0 Million BTUs per MCF, and we have to multiply by the efficiency here in the denominator which is 0.9, so the Natural Gas price turns out to be $10.83 or $10.83 per Million BTUs (MMBTUs).
When you do similar calculation for oil here, the actual price is, per unit is $0.99 per gallon here and how many million BTUs do we get per gallon? 0.13 Million BTUs (0.13 MMBTUs). We have done this before. We have to have the same units here. Gallons and gallons and MCF and MCF here in this case (natural gas) and times the efficiency is 0.8. So the price works out to be $9.50 per Million BTUs. Same million BTUs would cost $10.82 for Natural Gas and oil would be $9.50, so oil is cheaper.
Payback Examples:
9.12 Conclusion
9.12 ConclusionCongratulations on completing this module on home heating and insulation. You've explored the science of heat transfer, calculated heating needs using degree days, compared fuels and systems, and learned how to evaluate energy upgrades. These aren't just classroom concepts—they're practical tools you can use for life.
Key Takeaways: What You Now Know
Heat moves in three ways:
Conduction (through solids), convection (through fluids), and radiation (through space). Understanding these helps you identify where homes lose heat—and how to stop it.
Heating Degree Days (HDD) quantify climate demand:
The formula (65°F – Average Temp) × Days lets you compare heating needs anywhere. More HDD = more energy required.
Insulation slows heat loss:
R-Value measures thermal resistance. Higher R-Value = better performance. Layers of materials work together to create stronger thermal barriers.
Fuel choice affects cost and comfort:
Natural gas, oil, propane, and electricity each have pros and cons. Efficiency ratings (AFUE for furnaces, COP for heat pumps) tell you how much fuel actually becomes usable heat.
Payback analysis guides smart decisions:
The formula Additional Cost ÷ Annual Savings = Payback Period helps you decide if an upgrade is worth the investment.
Systems matter:
Furnaces heat air, boilers heat water, heat pumps move heat, and solar captures free energy. Each has a role depending on climate, budget, and goals.
Connect to Your World
The next time you need to replace your heating system, you’ll be equipped to make smart, informed choices.
- "Check your local Heating Degree Days first—your climate determines your heating needs."
- "Seal air leaks and upgrade insulation before replacing your furnace—it's often cheaper and just as effective."
- "Compare fuels using cost per useful BTU, not just price per gallon or therm."
- "Look for ENERGY STAR models and calculate payback—not just upfront cost."
- "In mild climates, a heat pump can heat AND cool efficiently. In very cold areas, a high-efficiency gas furnace may be better."
Lesson 10: Home Cooling and Windows
Lesson 10: Home Cooling and WindowsThe links below provide an outline of the material for this lesson. Be sure to carefully read through the entire lesson before returning to Canvas to submit your assignments.
10.1 Lesson 10 Introduction
10.1 Lesson 10 IntroductionWelcome to Lesson 10
Welcome to Lesson 10. In our last module, we explored how home heating systems and insulation work together to retain thermal energy and keep your living space comfortable during colder months. Now, we’re shifting our focus to the opposite seasonal challenge: how to effectively cool your home while managing energy use, indoor comfort, and utility costs.
As we dive into cooling strategies, we’ll also examine a critical but often overlooked factor: humidity. You’ve probably noticed that an 85°F day with high humidity feels far more oppressive than a 90°F day with dry air. This isn’t just in your head it’s thermodynamics. We’ll explore how water vapor in the air carries latent heat, interferes with your body’s natural evaporative cooling process, and forces air conditioning systems to work significantly harder to maintain comfort. Understanding this relationship will help you choose smarter cooling strategies, size equipment correctly, and avoid common energy waste.
Next, we’ll turn our attention to one of the most influential components of your building envelope: windows. While windows bring in valuable daylight and connect us to the outdoors, they can also be major pathways for unwanted summer heat gain. We’ll break down exactly how window orientation, glazing type, shading, and performance metrics like Solar Heat Gain Coefficient (SHGC) and U-factor directly impact your cooling load. You’ll learn how strategic window selection, placement, and retrofits can significantly reduce energy demand, lower your electricity bills, and improve year-round comfort.
Lesson 10 Objectives
Upon completing this lesson, you should be able to:
- Explain how natural and mechanical air-cooling systems affect building energy use
- Describe how an air conditioner works
- Describe different types of air conditioning systems
- Calculate the monetary savings when the efficiency of an air conditioner is improved
- Describe how high humidity affects both human thermoregulation and HVAC system performance
- Explain the relationship between humidity and temperature
- Identify key window performance metrics (U-factor, SHGC, VT, air leakage) and their impact on cooling demand
10.2 Humidity
10.2 HumidityWhy Humidity Matters
Humidity is one of the main reasons hot weather can feel uncomfortable. Sometimes it is not just the air temperature that makes us feel hot, but also the amount of water vapor in the air.
Our bodies cool themselves by sweating. When sweat evaporates from the skin, it removes heat from the body. However, when the air already contains a lot of moisture, sweat does not evaporate as easily. This makes it harder for the body to cool down, so we feel warmer and more uncomfortable.
Humidity also matters in buildings because it affects both comfort and energy use. If indoor air is too humid, people may lower the thermostat to feel cooler, which increases energy use. Managing humidity can therefore help improve comfort while also reducing cooling costs.
Air Composition and Pressure
Air is a mixture of several gases, including nitrogen, oxygen, and water vapor.
- The total air pressure exerted by a volume of air in a given container on that container is the sum of the individual (partial) pressures of these gases.
- The vapor pressure is the individual or partial pressure of the water vapor.
Warm air can hold more water vapor than cool air. This is why humidity changes with temperature. As air warms up, its moisture-holding capacity increases. As air cools down, it can hold less water vapor, and some of that moisture may condense into liquid water.
The Psychrometric Chart
A psychrometric chart is a tool used to show the properties of air at different temperatures and moisture levels. It helps us understand how temperature and humidity work together.
The chart shows that as air temperature increases, the amount of moisture the air can hold also increases. This is an important idea in heating, ventilation, and air conditioning (HVAC), because comfort depends on both temperature and moisture content.
A psychrometric chart (shown below) graphically represents the moisture content of air at various temperatures. The chart demonstrates that as air temperature increases, the amount of moisture that dry air can hold also increases.
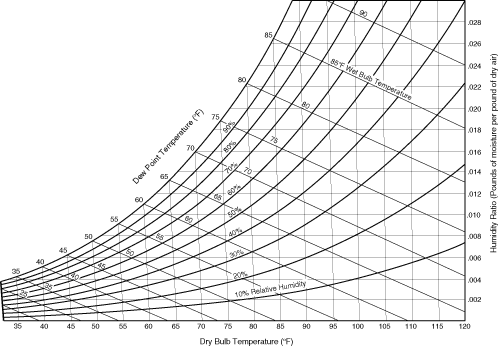
Text description of the Psychometric Chart image.
The image is a psychrometric chart, which is a graphical representation of the physical and thermal properties of moist air. The chart is structured with a grid of curved and straight lines.
- The horizontal axis represents Dry Bulb Temperature in degrees Fahrenheit, ranging from approximately 30°F to 120°F.
- The left vertical axis is labeled Humidity Ratio, measured in pounds of water vapor per pound of dry air, with values ranging from about 0.002 to 0.028.
- Curved lines represent constant Relative Humidity (RH) percentages, labeled at intervals like 10%, 20%, up to 100%.
- Several sets of diagonal lines run across the chart:
- Lines of constant Wet Bulb Temperature appear, measured in degrees Fahrenheit.
- Lines of constant Dew Point Temperature, also in degrees Fahrenheit, angle slightly less steep than the Wet Bulb lines.
Measuring Moisture in Air
Absolute Humidity is the actual amount of moisture that is contained in air. It is represented in the formula below:
Relative humidity (RH), is the ratio of the amount of moisture in the air to the maximum amount of moisture the air can hold at a given temperature, expressed as a percentage It is represented in the formula below:

Text description of the Relative Humidity image.
The image depicts a black chalkboard with a mathematical equation for calculating relative humidity written in white chalk. The equation reads: "Relative Humidity = (Amount of Water Vapor (lb)) / (Max. Amount of Water Vapor Air can hold) x 100." The terms "at a given temperature" and "at that temp." are indicated in smaller font beneath the numerator and denominator respectively. The color and texture suggest a vintage blackboard surface.
Example 1
Calculate the relative humidity of air when the air contains 0.002 lb of moisture per pound of dry air, while the maximum moisture air can hold at that temperature is 0.005 lb per lb of dry air.
Key Temperature Concepts
- Dry bulb temperature: The dry-bulb temperature is the regular air temperature measured by a thermometer. It is called “dry-bulb” because the thermometer bulb is dry. This is the temperature we usually see in weather reports.
Dew point Temperature: The dew point is the temperature at which air becomes fully saturated with water vapor. If air cools to its dew point, water vapor begins to condense into liquid water. This is how dew forms on grass or how moisture can form on a cold surface. A higher dew point means there is more moisture in the air. When the dew point is high, the air often feels muggy and uncomfortable.
Water vapor can store and transfer heat energy differently than dry air. Because of this, moist air often feels warmer and heavier than dry air at the same temperature. High humidity can make summer weather feel much hotter, while lower humidity usually feels more comfortable.
Saturation and Condensation
Saturation occurs when air contains the maximum amount of water vapor possible at a given temperature and pressure. At saturation:
- Relative humidity = 100%
- Air cannot hold additional moisture in vapor form
Condensation occurs when:
- Relative humidity reaches 100%, or
- Air is cooled below its dew point temperature, or
- Moist air contacts a surface cooler than the dew point temperature
Important: The coldest surface in a room is typically where condensation will occur first (called the "first condensing surface"). For air at a given absolute humidity, the colder the surface, the higher the relative humidity at that surface.
Temperature and Moisture Relationships
- As air warms: Water molecules move faster and remain in the gas phase; air can hold more moisture
- As air cools: Water molecules slow down and are more likely to condense onto surfaces
- At dew point: Air is saturated (100% RH); any further cooling causes condensation
Video: Relative Humidity Isn't What You Think it Is (3:25)
Transcript: Relative Humidity Isn't What You Think it Is
This episode is brought to you by the Music for Scientists album, now available on all streaming services. Click the link in the description to start listening.
Intro
Michael Aranda: If you’ve ever paid close attention to the humidity levels on your phone’s weather app, you might have noticed that they seem to make no sense. Like, in the summer, your app can say there’s 75% humidity, and you’ll be sticky and sweaty. But during winter, 75% might mean that your skin is super dry. So, what’s going on here?
Well, it turns out that the most common definition of humidity is… kind of inconvenient. But there is a better way to think about it. It all comes down to the fact that your phone, and most weather channels, specifically report relative humidity.
This number is measured in percentages, and it’s the amount of moisture in the air compared to how much water the air can hold. And the key is, how much water the air can hold depends a lot on temperature. See, for water vapor to come out of the air, it has to go from a gas to a liquid — usually, by condensing onto something like dust, or your window glass. And for something to go from a gas to a liquid, it has to lose energy. In other words, the molecules have to physically slow down.
Well, when the air is warm, the water molecules in it contain a lot of energy. They’re moving more than water molecules in cooler air. That means they’re less likely to condense out of the atmosphere — and they end up hanging out in the air and making things feel all sticky.
Humidity and temperature
So, temperature plays a big role in relative humidity. And it’s why this stat usually isn’t that useful in planning your day. If it’s -10 degrees Celsius, the air can’t hold onto as much moisture — so 75% humidity isn’t actually that humid. But if it’s 20 degrees, 75% humidity suddenly means there’s a lot more water in the air to make things feel all muggy.
If you want a number for humidity that isn’t quite so relative… try the dew point temperature. This is the temperature at which water droplets or dew form on things like grass. In other words, it’s the temperature at which the air is completely saturated with moisture. And the closer the dew point temperature is to the temperature outside, the stickier and more unpleasant it will be.
For reference, people react differently to dew points, but most folks are comfortable with a dew point of 10 degrees Celsius. And things get pretty humid and unpleasant around 15 or 21 degrees. So, it’s still a new scale to learn… but it’s also consistent no matter how cold it is outside.
Science inspiration
Now, the big question is, if the dew point temperature is a great way to tell you how the outside world feels, why don’t weather apps and weather channels use it? It’s mostly a matter of history. Instruments that measure relative humidity predate the ones that measure dew points. Like, one of the first mechanical hygrometers, a device that measures humidity, appeared in 1783. And since these devices were widely available to the public and gave reliable measurements of relative humidity, the term, unfortunately, stuck around.
...you know what else is available to the public and gives reliable science inspiration? Music for Scientists, a tribute album to science inspired by the beauty of science. It was written and recorded by Patrick Olsen, and if you want to check it out, I’d recommend starting off with the song “Aristarchus in the Rain” — which isn’t about humidity, but is about a scientist trying to make sense of this messy and cloudy world. If you want to check it out, look for “Music for Scientists” on all major music streaming services, or click the link below.
Saturation is the maximum amount of water vapor in the air at an existing temperature and pressure. Air is said to be saturated at 100 percent relative humidity when it contains the maximum amount of moisture possible at that specific temperature.
Dew point is the temperature when air reaches 100% relative humidity.
10.3 Air Conditioning
10.3 Air ConditioningNow that we understand how humidity affects comfort and how windows influence heat gain, we turn our attention to the systems designed to manage both: air conditioning.
Air conditioning is about more than just lowering temperature. A well-designed system simultaneously:
- Cools the air (removes sensible heat)
- Dehumidifies the air (removes latent heat)
- Filters and circulates air for indoor air quality
- Maintains relative humidity in the comfort zone (~40–60%)
Why Cooling Also Means Dehumidifying
When warm, humid indoor air passes over the cold evaporator coil inside an air conditioner, two things happen simultaneously:
- Sensible cooling: The air temperature drops as heat energy transfers to the refrigerant.
- Latent cooling: As the air cools, its capacity to hold moisture decreases. When the air reaches its dew point, water vapor condenses on the coil and drains away.
Real-World Observation

The Comfort Zone: Targeting ~50% Relative Humidity
Temperature: 72–78°F (22–26°C)
Relative Humidity: 40–60% (ideally ~50%)
| Humidity Level | Comfort Impact | Energy Impact |
|---|---|---|
| < 30% RH | Dry skin, irritated respiratory passages | May require humidification (adds energy) |
| 40–60% RH | Optimal comfort, effective evaporative cooling | Efficient AC operation |
| > 60% RH | "Sticky" feeling, reduced sweat evaporation, mold risk | AC works harder; may need dedicated dehumidifier |
Why 50%? At this level, your body's natural cooling mechanism—sweat evaporation—works efficiently. Higher humidity slows evaporation, making you feel warmer even at the same temperature. This is why a humid 82°F day can feel like 90°F.
10.4 How Air Conditioners Work
10.4 How Air Conditioners WorkContrary to what is generally assumed, outside air is not cooled inside the air conditioner and then supplied inside. Only heat energy is moved or pumped by the air conditioner from a low temperature environment (inside the building) to a high temperature environment (outside the building).
What Air Conditioning Actually Does (and Doesn't Do)
An air conditioner DOES:
- Transfer heat energy from indoors to outdoors
- Remove moisture (water vapor) from indoor air
- Filter and recirculate indoor air
- Maintain setpoint temperature and humidity
An air conditioner does NOT:
- "Create cold" (cold is simply the absence of heat)
- Bring in large amounts of outdoor air (unless designed for ventilation)
- Remove indoor air and replace it with outdoor air (that's ventilation, not cooling)
Video: How Air Conditioning Works (4:38)
Transcript: How Air Conditioning Works
Narrator: If you’re feeling the summer heat, you might be tempted to switch on the machine that makes all the problems go away: your air conditioner. And the source of that sweet relief? Well, of course it’s chemistry.
Air conditioners pull off the seemingly magical feat of making the air inside a home, car, or shopping mall deliciously chilly. Air conditioning -- and refrigeration, which is the same thing just in a slightly smaller box -- rely on the laws of physical chemistry.
And p-chem tells us that as a liquid evaporates into a gas, it absorbs heat. The molecules in a liquid are held together by weak intermolecular interactions. Not quite chemical bonds, just enough passing attraction to keep them from flying apart. Some of the molecules absorb enough heat energy -- in other words, they get moving fast enough -- to overcome these intermolecular attractions, ESCAAAAPE and take gaseous form.
That’s the reason you feel chilly getting out of the shower, and why we sweat to stay cool. The water has to absorb heat to evaporate. And it carries that heat away from you.
An air conditioner’s basic job, then, is to use a fluid called a refrigerant that constantly changes from a liquid to a gas and back to a liquid again to move heat from one place (your sweaty bedroom) to another (outside, where it’s already hot and miserable anyway, so who cares.)
Here’s a admittedly very schematic-ified version of how most a/c units work. The liquid refrigerant flows through a series of coils exposed to the air in your home. The refrigerant has a low boiling point, so the heat from the interior air is enough to make it turn into a gas. Which means there’s now more heat in the refrigerant, and less in the air. A fan blows that colder air into your room. Or straight into your face, we’re not judging.
So now your A/C has to do two things: dump the heat absorbed by the refrigerant outside, and two, it has to condense the refrigerant back into a liquid so it can be used again. And to do those things it uses a compressor to ramp up the pressure on the gaseous refrigerant -- so much that it can condense into a liquid again, even though it’s at the warmer outside temperature.
As it condenses, the refrigerant loses heat to the air around it, which another fan blows outside, where it’s already all sticky anyway. Which is a neat trick, boiling something at a low temperature and then condensing it at a high one.
Nothing in thermodynamics is free, and the compressor needs energy to do the work of compressing the refrigerant. Which may explain your power bills in July.
After the refrigerant condenses, the air conditioner backs off the pressure with an expansion valve, so that the refrigerant can boil at the lower temperature again. Which it does, in a loop, over and over until your home reaches the temperature you set the thermostat to, or your housemates complain and switch it off.
While the refrigerant could be practically any substance, there are some chemicals that do the job better than others, and these refrigerants have a checkered history. A refrigerant needs to have a pretty low boiling point, and one that can be adjusted to where you want it by changing the pressure on it. It should also be pretty good at conducting heat, be able to absorb a lot of heat as it boils. AND THEN it needs to be cheap, widely available, and as non-flammable and non-toxic as possible. That kinda narrows your choices of chemical.
Scientists thought they’d found the perfect refrigerant with Freon, the trade name of a group of chemicals called chlorofluorocarbons. But CFCs are actual murder to the ozone layer. They’ve been largely replaced with hydrofluorocarbons, or HFCs. HFCs don’t damage the ozone layer, which is good! But they have a different problem...they’re greenhouse gases.
So the search is on to phase out HFCs too. Some alternatives? Simple hydrocarbons like these have been approved in the USA. Hydrofluoroolefins like this one are less rough on the climate than HFCs, but also more expensive. The most surprising potential replacement is CO2. CO2 totally works as a refrigerant, and even though it is the literal poster child for greenhouse gases, it’s also way less potent than HFCs.
Whatever we use in the future, it doesn’t seem likely that we’ll give up on AC altogether. Not in a scorching summer like this one. Pass the popsicles, wouldja?
Thanks for watching, and if you want to help us keep making great videos like this one, ...
How the Refrigeration Cycle Moves Heat
At the heart of every air conditioner is a closed-loop refrigeration cycle. Here's a simplified breakdown of the four main components and what they do:
1. Evaporator Coil (Indoor Unit)
- Cold, low-pressure liquid refrigerant enters the coil
- Warm indoor air blows over the coil
- Refrigerant absorbs heat from the air and evaporates into a gas
- Moisture in the air condenses on the cold coil and drains away
- Cooled, dehumidified air is circulated back into the room
2. Compressor (Outdoor Unit)
- Low-pressure refrigerant gas is compressed
- Compression increases both pressure and temperature of the refrigerant
- The refrigerant leaves as a hot, high-pressure gas
3. Condenser Coil (Outdoor Unit)
- Hot refrigerant gas flows through the condenser coil
- A fan blows outdoor air over the coil
- Heat transfers from refrigerant to outdoor air
- Refrigerant condenses back into a high-pressure liquid
4. Expansion Device (Metering Device)
- High-pressure liquid refrigerant passes through a small orifice
- Pressure drops dramatically, causing the refrigerant to cool
- Cold, low-pressure liquid returns to the evaporator to repeat the cycle

Text description of the Refrigeration image.
The image is a diagram of an air conditioning system illustrating the refrigeration cycle. The system consists of several key components connected by arrows indicating the flow of refrigerant. At the top, the "Compressor" is depicted, with red arrows labeled "Hot Refrigerant" pointing towards the "Condenser" on the right. "Cool Refrigerant" is shown flowing from the Compressor towards the "Evaporator" on the left via blue arrows. The Evaporator and Condenser both have labeled boxes detailing their functions: "Heat Xfer to Refrigerant" for the Evaporator and "Heat Xfer to Air" for the Condenser. Between the Evaporator and Condenser are two fans labeled "FAN," indicating "Ambient Air" flows past them. The "Expansion Valve," located at the bottom, shows refrigerant flow changing from "Warm" to "Cold." Drops of water with a blue arrow indicate "Condensation Drains to Outside."
10.5 Types of Air Conditioners
10.5 Types of Air ConditionersThe basic types of air conditioners are room air conditioners, split-system central air conditioners, and packaged central air conditioners. We will discuss them more in depth below.
Room Air Conditioners
Room air conditioners cool rooms rather than the entire home. If they provide cooling only where they're needed, room air conditioners are less expensive to operate than central units, even though their efficiency is generally lower than that of central air conditioners.
Room air conditioners generally range from 5,500 to 14,000 BTU per hour. The size needed depends on the size of the room, local climate and shading.

Central Air Conditioners
Central air conditioners circulate cool air through a system of supply and return ducts. Supply ducts and registers (i.e., openings in the walls, floors, or ceilings covered by grills) carry cooled air from the air conditioner to the home. This cooled air becomes warmer as it circulates through the home; then it flows back to the central air conditioner through return ducts and registers.

Split System
In a split-system central air conditioner the main components include:
- an outdoor metal cabinet that contains the condenser and compressor;
- an indoor cabinet that contains the evaporator;
- in many split-system air conditioners, the indoor cabinet also contains a furnace or the indoor part of a heat pump. The air conditioner's evaporator coil is installed in the cabinet or main supply duct of this furnace or heat pump.

If your home already has a furnace but no air conditioner, a split-system is the most economical central air conditioner to install.

Text description of the Split Air Conditioning System diagram.
A labeled diagram of a central air conditioning and heating system showing how air circulates through a building and connects to indoor and outdoor equipment.
- Cooled air: Arrows show cooled air traveling upward through a supply duct and entering the building through an upper vent.
- Warm air: Arrows show warm air entering a return vent and traveling downward through a duct labeled Warm Return Air.
- Filter: Located in the return air pathway near the furnace.
- Furnace: Connected to the return air duct and the indoor cooling unit.
- Cooling unit: Located next to the furnace and connected to the outdoor unit by refrigerant piping.
- Outdoor unit: Contains a compressor and a section labeled Heat From Indoor. Arrows indicate heat moving outward from the unit.
- Refrigerant piping: Connects the outdoor unit to the indoor cooling unit.
Packaged Units
The packaged central air conditioner is usually located outdoors and consists of one cabinet that contains the evaporator, condenser, and compressor. The cabinet is usually placed on a roof or on a concrete slab next to the house's foundation. The packaged air conditioner is connected to the indoor air supply and return ducts through the home's exterior wall or roof.
Since these air conditioners often include electric heating coils or a natural gas furnace, this combination of air conditioner and central heater eliminates the need for a separate furnace indoors. This type of air conditioner is used to cool and heat homes as well as small commercial buildings.

Text description of the ackaged Central Air Conditioner image.
A cutaway diagram of an outdoor air conditioning unit showing its internal components and their arrangement.
- Expansion valve: Located in the upper left compartment, connected to a series of pipes and cylindrical components.
- Cooling coils: A rectangular assembly of closely spaced coils positioned near the top of the unit.
- Condensers: Horizontal cylindrical components located in the middle section of the unit.
- Compressors: Two horizontal cylindrical components positioned in the lower section, with smaller cylindrical connections extending from their ends.
- Located Outdoors: A label beneath the unit indicates its outdoor location.
10.6 Air Conditioner Efficiency
10.6 Air Conditioner EfficiencyAir conditioners are rated by the number of British Thermal Units (BTU) of heat they can remove per hour. Another common rating term for air conditioning size is the "ton," which is 12,000 BTU per hour.
Each air conditioner has an energy-efficiency rating that lists how many BTUs per hour are removed or “pulled out” for each watt of power it draws.
- The efficiency rating for room conditioners is the Energy Efficiency Ratio, or EER.
- The efficiency rating for central air conditioners, is the Seasonal Energy Efficiency Ratio, or SEER.
These ratings are posted on an Energy Guide Label, which must be conspicuously attached to all new air conditioners. Energy Star-labeled appliances mean that they have high EER and SEER ratings.

Room Air Conditioners—EER
Energy Efficient Ratio (EER) measures how efficiently a room air conditioner will operate at a specific outdoor temperature. The higher the EER, the more efficient the system.
The EER can be calculated using this equation:
Remember that the EER energy-efficiency rating lists how many BTUs per hour are removed or “pulled out” for each watt of power it draws. Room air conditioners generally range from 5,500 BTU per hour to 14,000 BTU per hour.
New standards from the US Department of Energy (DOE) went into effect on January 1, 2023 which requires new AC units to have a minimum energy efficiency. Additionally, homeowners may be eligible for tax credits when purchasing highly efficient air conditioner upgrades.
Central Air Conditioners—SEER
Seasonal Energy Efficiency Ratio (SEER) measures how efficiently a central air conditioner will operate at a specific outdoor temperature. The higher the SEER, the more efficient the system.
The SEER can be calculated using this equation:
Again, the SEER energy-efficiency rating lists how many BTUs per hour are removed or “pulled out” for each watt of power it draws.
National minimum standards for central air conditioners require a SEER of 9.7 and 10.0, for single-package and split-systems, respectively. But you do not need to settle for the minimum standard—there is a wide selection of units with SEERs reaching nearly 17.
Before 1979, the SEERs of central air conditioners ranged from 4.5 to 8.0. Replacing a 1970s-era central air conditioner with a SEER of 6 with a new unit having a SEER of 12 will cut your air conditioning costs in half. Today's best air conditioners use 30% to 50% less energy to produce the same amount of cooling as air conditioners made in the mid 1970s. Even if your air conditioner is only 10 years old, you may save 20 to 40 percent of your cooling energy costs by replacing it with a newer, more efficient model.
In general, new air conditioners with higher EERs or SEERs have higher price tags. However, the higher initial cost of an energy-efficient model will be recovered several times during its lifespan. Some utility companies encourage the purchase of a more efficient air conditioner by offering incentives. Buy the most efficient air conditioner you can afford, especially if you use (or think you will use) an air conditioner frequently and/or if your electricity rates are high.
Example 1
Calculate the power consumption of 5000 BTUs/h room air conditioner with an Energy Efficiency Ratio (EER) of 8.
Solution: We know that
Given that the AC pulls out 5,000 BTUs per hour and its EER = 8, we have
Therefore, its wattage =
Example 2
Air Conditioner Efficiency. An old room air conditioner with an EER 6 was replaced by a new air conditioner with an EER of 10.0. The power consumption with the old air conditioner was 1000 W. Calculate the power consumption of the new air conditioner.
We have an old air conditioner with an EER of 6. EER is basically Energy Efficiency Ratio which is given by number of Btus the air conditioner is pulling out per hour divided by watts of power consumed.
And in this problem we are given the EER as 6 and we need to calculate the number of Btus it is capable of pulling out. We also know that it is consuming a thousand watts of power. So we need to calculate these Btus per hour that it is pulling out. So we can calculate the x, unknown, by multiplying thousand by 6 and we get six thousand Btus per hour.
The room size is not changing but we are just replacing the old air conditioner with the new one. The new EER is 10, the new air conditioner EER is 10 and it is still pulling 6000 Btus per hour out and the new one, how many watts of power does it consume?
To calculate the power, we have 6,000 Btu/hour load and we know the EER, which is 10, so dividing by this we get the power which is 600 watts.
What we are doing here is, by replacing the old air conditioner which used to consume 1,000 watts with this new air conditioner which has an EER of 10, we are reducing the power consumption to 600 watts.
Example 3
An old room air conditioner with an EER 6 was replaced by a new air conditioner with an EER of 13.0. The room requires 0.75 tons of air conditioning. Calculate the difference in power consumption between the old and new air conditioners.
The old AC unit has an EER of 6. And this was replaced by one with an EER of 13. The room basically is required to pull out 0.75 or three quarters of a ton. You should remember that each ton, one ton of refrigeration or air conditioning is equal to, basically pulling out 12,000 Btus every hour. So it is pulling out ¾ of a ton, which happens to be 0.75 times 12,000 Btus per hour. That is 9,000 Btus per hour.
So to pull out 9,000 Btus per hour with an air conditioner of EER equal to 6. So we are pulling out 9,000 Btus/hr and what is the wattage? Or watts? And wattage is equal to now, 9,000 divided by 6. This is 1,500 watts.
Ok. Now if we were to replace this with an EER of 13. Now it still has to pull out 9,000 Btus/hr and what would be the wattage? So watts equal to 9,000 Btus/hr divided by 13, that would be 900 watts.
So by replacing this air conditioner, which used to consume 1,500 watts, by an energy efficient air conditioner with an EER of 12, we are able to bring down the power consumption to 692 watts. So that is a savings of over 53% right there.
Example 4
What is the annual cost for operating a 3 ton central air conditioner with an SEER of 10? Assume that the AC operates 2,000 hours in a year and the cost of electricity is 19.2 cents per kWh.
Solution:
Recall that 1 ton = 12,000 BTUs/h. Therefore, the cooling load is 3 × 12,000 BTUs/h = 36,000 BTUs/h
Recall also that 1,000 W = 1 kW. Therefore, power consumption = 3.6 kW.
Energy = Power × Time of Usage
= 3.6 kW × 2,000 h/year = 7,200 kWh/year.
Annual Cost = Units of energy × price per unit
Example 5
Suppose you are comparing two air conditioners, both of which are expected to last for 10 years. The least efficient air conditioner draws 775 W of power. The most efficient one uses 600 Watts. Assuming that the air conditioner operates 2,400 hours annually and that the local energy costs 0.128 per kWh, how much money and energy can you save with the energy-efficient model?
| Category | Air conditioner 1 | Air conditioner 2 |
|---|---|---|
| Life | 10 years | 10 years |
| Power | 775 Watt | 600 Watt |
| Time | 2,400 hours | 2,400 hours |
Air Conditioner #1
Air Conditioner #2
| Time | Air conditioner 1 | Air conditioner 2 |
|---|---|---|
| In 10 years... | ||
| 10 year cost | $2380.80 | $1848.32 |
Electricity price is estimated at $0.128/kWh. Over the ten years you will pay $2,380.80 in electricity to run AC #1, while you would only pay $1,848.32 for AC #2. This assumes electricity prices stay the same for those ten years. You would save $532.48 over 10 years by purchasing unit #2.
10.7 Air Conditioner Sizing
10.7 Air Conditioner SizingImportant Factors in Sizing Air Conditioners
Selecting the right-size air conditioning system is one of the most critical decisions for home comfort, energy efficiency, and equipment longevity. With rising energy costs, extreme heat events, and advanced variable-speed technology, proper sizing is essential.
The Consequences of Improper Sizing
Oversized System Problems:
- Comfort: Short cycling prevents proper dehumidification → cold but clammy air
- Energy Use: Frequent start/stop cycles waste energy; higher peak demand
- Equipment Life: Compressor wear from frequent cycling reduces lifespan by 30–50%
- Indoor Air Quality: Insufficient runtime to filter air or remove moisture
- Cost Impact: Higher upfront cost + higher operating cost
Undersized System Problems:
- Comfort: Runs continuously but can't maintain setpoint during peak heat
- Energy Use: Extended runtime increases total energy consumption
- Equipment Life: Continuous operation accelerates component fatigue
- Indoor Air Quality: May promote mold growth if humidity remains high
- Cost Impact: Lower upfront cost but higher operating cost + potential replacement needs
A system that is too large will cool the room or home quickly but will not provide the comfort that is needed, because the cool air reaches the thermostat quickly and the thermostat sends a signal to shut the system before the relative humidity is reduced to a comfortable level. As the cold air is distributed in the room, the thermostat realizes that the temperature is not at the set point and then turns on the air conditioner. This quick cycling of the unit (start and stop) reduces the lifespan of the equipment and increases the energy consumption. A larger air conditioner also consumes more energy.
A system that is small will have to work all the time and is not energy efficient. So the right size is very important for energy efficiency.
A good starting point for sizing an Air Conditioning system is to look at the cooling needs based upon the size of the space needed for cooling. A rough estimate of is listed in the table below.
| Area To Be Cooled (square feet) | Capacity Needed (BTUs per hour) | AC size in Tons |
|---|---|---|
| under 600 | 12,000 | 1 |
| 600-1000 | 18,000 | 1.5 |
| 1,000- 1,500 | 24,000 | 2 |
| 1,500-2,000 | 30,000 | 2.5 |
| 2,000-2,500 | 36,000 | 3 |
| 2,500-3,300 | 42,000 | 3.5 |
Adjustment Factors: When to Modify Capacity
Heavy shading (mature trees, permanent overhangs): Reduce capacity by 5–10%. Less solar gain through windows and walls.
Extreme sun exposure (west-facing, no shading, dark roof): Increase capacity by 5–10%. Higher radiant and conductive heat gain.
High occupancy (>2 people regularly in room): Add 400–600 BTU/h per additional person. Accounts for sensible + latent heat from occupants.
Kitchen installation: Add 2,000–4,000 BTU/h. Cooking appliances generate significant heat.
High ceilings (>9 ft): Increase capacity by 10–15% per additional 2 ft. Greater air volume to condition.
Open floor plan: May require zoning or multiple units. Airflow distribution challenges affect effective capacity.
Variable-speed system selected: May allow slight downsizing (5–10%). Modulating compressors handle part-load conditions more efficiently.
10.8 Natural Cooling
10.8 Natural CoolingWhat Is Passive (Natural) Cooling?
Passive cooling uses non-mechanical, design-based strategies to maintain comfortable indoor temperatures without relying on energy-intensive air conditioning. These time-tested principles, enhanced by modern materials and building science, can:
- Reduce cooling energy use by 30–50% in typical homes
- Eliminate AC needs entirely in mild climates with proper design
- Extend the lifespan of mechanical systems by reducing runtime
- Improve indoor air quality and thermal comfort
- Provide cooling during power outages (critical for climate resilience)
The Four Pillars of Modern Passive Cooling
Effective passive cooling follows a hierarchical approach: prevent heat gain first, then remove any heat that does enter. Here are the four core strategies:
1. Reflect Heat Away
Prevent solar radiation from reaching your building envelope
Modern Techniques:
- Cool roofs: Reflective roofing materials (white or light-colored) with Solar Reflectance Index (SRI) ≥ 82 can reduce roof surface temperature by 50–60°F compared to conventional dark roofs
- Radiant barriers: Aluminum foil-based materials installed in attics reflect up to 97% of radiant heat, reducing cooling loads by 5–10%
- Exterior wall finishes: Light-colored stucco, reflective paint, or insulated metal panels minimize heat absorption
- Smart windows: Electrochromic (dynamic) glass that automatically tints in response to sunlight intensity
2026 Impact: The U.S. Department of Energy's "Cool Roofs Initiative" encourages adoption through rebates and updated building codes in 15+ states.
Instructions: Place your cursor over the numbers of the image below to learn more about reflecting heat away.
Text description of the Reflecting Heat Away activity.
Reflecting Heat Away
The following are passive methods for reflecting unwanted heat energy away from your home.
- The roof, made out of traditional roofing materials, allows about 1/3 of unwanted heat that builds up in the home. Unlike most light-colored surfaces, even white asphalt and fiberglass absorb 70 percent of the solar radiation. One solution is to apply a reflective coating to your existing roof. Two standard roofing coatings are marketed primarily for mobile homes and recreational vehicles. Both are waterproof and have reflective properties.
- Wall color is not as important as roof color, but it does affect heat gain somewhat. White exterior walls absorb less heat than dark walls. And light, bright walls increase the longevity of siding, particularly on the east, west, and south sides of the house.
- Windows permit about 40 percent of the unwanted heat that builds up in the home. Reflective window coatings are plastic sheets treated with dyes or thin layers of metal. Besides keeping your house cooler, these reflective coatings cut glare and reduce fading of furniture, draperies, and carpeting. Two main types of coatings include sun-control films and combination films.
- Sun control films are best for windows in warmer climates because they can reflect as much as 80 percent of the incoming sunlight. Many of these films are tinted, however, and tend to reduce light transmission as much as they reduce heat, thereby darkening the room.
- Combination films are best for climates that have both hot and cold seasons. They allow some light into a room but they also let some heat in and prevent interior heat from escaping.
2. Block Heat
Stop heat from penetrating your building envelope
Modern Techniques:
- High-performance windows: Triple-pane glazing with low-e coatings and argon fill (U-factor ≤ 0.20, SHGC ≤ 0.25 for hot climates)
- Exterior shading devices:
- Automated awnings with sun-tracking sensors
- Fixed overhangs designed using 3D solar modeling for optimal seasonal performance
- Exterior shutters (operable or fixed)
- Pergolas with deciduous vines (shade in summer, sunlight in winter)
- Landscaping:
- Strategic tree placement: Deciduous trees on south and west sides can reduce cooling costs by 15–25%
- Green walls/living facades: Vegetated exterior walls reduce surface temperatures by 20–30°F
- Ground cover: Grass and plants absorb less heat than concrete or asphalt
- Insulation upgrades:
- Continuous exterior insulation to eliminate thermal bridging
- Attic insulation to R-49 to R-60 (climate-dependent)
- Advanced framing techniques to maximize insulation coverage
2026 Standard: The 2024 IECC (International Energy Conservation Code) requires enhanced shading and window performance in Climate Zones 1–3 (hot/humid and hot-dry regions).
3. Remove Built-Up Heat
Ventilate and flush heat from your home using natural air movement
Modern Techniques:
- Cross-ventilation: Strategic window and door placement to create pressure differentials that drive airflow
- Stack ventilation: Using warm air's natural rise to draw cool air in from below and exhaust hot air through high openings or solar chimneys
- Night flushing: Opening windows at night to cool thermal mass (concrete, tile, masonry), then closing during the day
- Whole-house fans: Modern, energy-efficient models (15–40 watts) that exhaust hot air and draw in cool evening air, reducing cooling costs by 50–90% when used properly
- Attic ventilation: Ridge vents, soffit vents, and solar-powered attic fans to prevent heat buildup
- Earth tubes/ground-coupled ventilation: Underground ducts that pre-cool incoming air using stable ground temperatures (typically 50–60°F year-round)
- Smart ventilation controls: Automated window openers and dampers that respond to indoor/outdoor temperature and humidity sensors
2026 Innovation: AI-powered building management systems can optimize natural ventilation schedules based on weather forecasts, occupancy patterns, and indoor air quality sensors.
4. Reduce or Eliminate Internal Heat Sources
Minimize heat generated inside your home
Modern Techniques:
- LED lighting: Produces 75% less heat than incandescent bulbs while using 90% less energy
- Energy Star appliances: Modern refrigerators, dishwashers, and washing machines generate significantly less waste heat
- Induction cooktops: 85–90% efficient vs. 40–55% for gas; produce less ambient heat
- Smart power management:
- Schedule heat-generating activities (laundry, cooking, dishwashing) for early morning or evening
- Use smart plugs to eliminate phantom loads from electronics in standby mode
- Efficient electronics: Modern computers, TVs, and chargers generate far less heat than legacy devices
- Hot water system optimization: Insulate pipes, use on-demand/tankless water heaters, and locate water heaters outside conditioned space when possible
- Plug load management: Unplug devices not in use; use power strips to eliminate standby power (accounts for 5–10% of residential energy use)
2026 Context: The average U.S. home has 20–25 connected devices, making internal heat gain from electronics a significant cooling load factor.
Energy Savings by Naturally Cooling Your Home
Instructions: Place your cursor over the numbers of the image below to learn more about using insulation and shading to block heat.
Text Description of Blocking the Heat Interactive mage
Blocking the Heat
The following are passive methods for blocking unwanted heat energy from your home.
- Low ground cover such as grass, small plants, and bushes can also be very effective in cooling. A grass-covered lawn is usually 10 degrees F (6 degrees C) cooler than bare ground in the summer. If you are in an arid or semiarid climate, consider native ground covers that require little water.
- Deciduous trees that lose their leaves in the fall help cut cooling energy costs the most. When selectively placed around a house, they provide excellent protection from the summer sun and permit winter sunlight to reach and warm your house. The height, growth rate, branch spread, and shape are all factors to consider in choosing a tree. Vines are a quick way to provide shading and cooling. Grown on trellises, vines can shade windows or the whole side of a house.
- Solar screens resemble standard window screens except they keep direct sunlight from entering the window, cut glare, and block light without blocking the view or eliminating air flow. They also provide privacy by restricting the view of the interior from outside your house. Solar screens come in a variety of colors and screening materials to compliment any home. Although do-it-yourself kits are available, these screens will not last as long as professionally built screens.
- The attic is a good place to start insulating because it is a major source of heat gain. Adequately insulating the attic protects the upper floors of a house. Recommended attic insulation levels depend on where you live and the type of heating system you use. For most climates, you want a minimum of R-30. In climates with extremely cold winters, you may want as much as R-49.
- Weatherization measures such as insulating, weather-stripping, and caulking help seal and protect your house against the summer heat, in addition to keeping out the winter cold. Although unintentional infiltration of outside air is not a major contributor to inside temperature, it is still a good idea to keep it out. Outside air can infiltrate your home around poorly sealed doors, windows, electrical outlets, and trough openings in foundations and exterior walls.
- Draperies and curtains made of tightly woven, light-colored, opaque fabrics reflect more of the sun's rays then they let through. The tighter the curtain is against the wall around the window, the better it will prevent heat gain. Two layers of draperies improve the effectiveness of the draperies' insulation when it is either hot or cold outside.
- Landscaping is a natural and beautiful way to shade your home and block the sun. A well-placed tree, bush or vine can deliver effective shade and add to the aesthetic value of your property. When designing the landscaping, use of plants that are native to the local area survive with minimal care.
- Shutters are movable wooden or metal coverings that, when closed, keep sunlight out. Shutters are either solid or slatted with fixed or adjustable slats. Besides reducing heat gain, they can provide privacy and security. Some shutters help insulate windows when it is cold outside.
- Awnings are very effective because they block direct sunlight. They are usually made of fabric or metal and are attached above the window and extend down and out. A properly installed awning can reduce heat gain up to 65 percent on southern windows and 77 percent on eastern windows. A light-colored awning does double duty by also reflecting sunlight.
- Wall insulation is not as important for cooling as attic insulation because outdoor temperatures are not as hot as attic temperatures. Also, floor insulation has little or no effect on cooling.
- Venetian blinds, although not as effective as draperies, can be adjusted to let in some light and air while reflecting the sun's heat. Some newer blinds are coated with reflective finishes. To be effective, the reflective surfaces must face the outdoors.
- Besides providing shade, trees and vines create a cool microclimate that dramatically reduces the temperature (by as much as 9 degrees F [5 degrees C]) in the surrounding area. During photosynthesis, large amounts of water vapor escape through the leaves, cooling the passing air. And the generally dark and coarse leaves absorb solar radiation.
10.9 Windows and Heat Loss
10.9 Windows and Heat LossWhy Windows Matter for Energy Efficiency
Windows typically occupy 15–20% of a home's exterior wall area, yet they have a disproportionate impact on energy use and comfort. While windows provide essential benefits—natural daylight, ventilation, views, and architectural appeal—they also represent the weakest thermal link in most building envelopes.
The Energy Challenge
- In winter: Windows lose more heat per square foot than any other surface in the home
- In summer: Sunlight entering through windows significantly increases cooling loads
- Overall impact: Approximately 30% of a home's heating energy loss occurs through windows
Understanding the Thermal Gap: Walls vs. Windows
To illustrate why windows matter so much, compare typical thermal performance values:
| Building Component | Typical R-Value | Thermal Performance |
|---|---|---|
| Well-insulated wall | R-13 to R-19 | Good resistance to heat flow |
| Single-pane glass (⅛") | ~R-1 (not R-0.03*) | Very poor resistance to heat flow |
| Double-pane window (standard) | R-2 to R-3 | Moderate improvement |
| High-performance window | R-4 to R-9 | Approaches wall-level performance |
*Note: The R-value of 0.03 cited in some sources refers to thermal conductance per inch of glass material itself—not the whole window assembly. For practical purposes, single-pane glass performs at approximately R-1.
What This Means in Practice
Imagine a home with:
- Walls insulated to R-19
- Single-pane windows at ~R-1
The Path Forward: Improving Window Performance
While no window can completely eliminate heat transfer, significant improvements are possible through:
- Multi-pane glazing (double or triple glass layers)
- Low-emissivity (low-e) coatings to reduce radiant heat loss
- Gas fills (argon, krypton) to suppress convection between panes
- Warm-edge spacers to reduce edge-of-glass heat loss
- Proper installation to minimize air leakage around the frame
In the following sections, we'll explore these technologies in detail and show how they work together to reduce energy loss, improve comfort, and lower utility bills.
10.10 Understanding Window Performance Labels
10.10 Understanding Window Performance LabelsIntroduction to NFRC Ratings
The National Fenestration Rating Council (NFRC) label provides objective, third-party ratings that allow reliable comparisons between products. Fenestration refers to the arrangement and proportion and design of windows and doors in a building. to the arrangement Each label includes:
- Manufacturer name
- Product description
- Source for additional information
- Energy performance ratings for key characteristics
Standardized Testing: NFRC rates all products using two standard sizes to ensure fair comparisons. The label displays ratings for up to five performance factors: U-Factor, Solar Heat Gain Coefficient (SHGC), Visible Transmittance (VT), Air Leakage (AL), and Condensation Resistance (CR).

Text description of the National Fenestration Rating Council's window label.
The image is a certification label for energy performance ratings of a window product named "World's Best Window Co. Series '2000' Casement." The top section features an ENERGY STAR map of the United States, with certified regions highlighted in blue. The ENERGY STAR logo is present, along with the caption "ENERGY STAR Certified in Highlighted Regions," written in both English and Spanish. Below the map in a blue bar, the text "energystar.gov/windows" is listed alongside the word "Certified" in English and Spanish.
The middle section includes a logo for the National Fenestration Rating Council (NFRC), indicating certification. Below the NFRC logo, details about the window product are presented, including its frame material, glazing, and model number.
In the bottom section, the energy performance ratings are displayed. It lists values for U-Factor, Solar Heat Gain Coefficient, Visible Transmittance, and Air Leakage. Condensation Resistance is also mentioned.
[Transcribed Text]
ENERGY STAR Certified in Highlighted Regions
Certificado por ENERGY STAR en las regiones resaltadas
energystar.gov/windows Certified / Certificado
National Fenestration Rating Council NFRC CERTIFIED
World's Best Window Co.
Series "2000" Casement
Vinyl Clad Wood Frame
Double Glazing-Argon Fill - Low E
XYZ-X-1-00001-00001
ENERGY PERFORMANCE RATINGS
U-Factor (U.S. / I-P) 0.22
Solar Heat Gain Coefficient 0.23
ADDITIONAL PERFORMANCE RATINGS
Visible Transmittance 0.51
Air Leakage (U.S. / I-P) ≤0.3
Condensation Resistance 51
Manufacturer stipulates that these ratings conform to applicable NFRC procedures for determining whole product performance. NFRC ratings are determined for a fixed set of environmental conditions and specific product size. NFRC does not recommend any product, nor does it warrant the suitability of any product for any use. Consult manufacturer's literature for other product performance information.
www.nfrc.org
U-Factor: Measuring Heat Loss
What It Measures
U-Factor (or U-Value) measures how well a window prevents heat from escaping. It indicates the rate of heat transfer through the window assembly.
Understanding the Scale
- Range: 0.20 to 1.20 (typical residential windows)
- Lower is better: A lower U-Factor means less heat loss and better insulation
- Testing conditions: Based on 0°F (-18°C) outdoor temperature and 70°F (21°C) indoor temperature
U-Factor vs. R-Value
U-Factor and R-Value are inversely related:
- U-Factor = thermal conductance (heat flow through a material)
- R-Value = thermal resistance (heat flow resistance of a material)
U-values are the reciprocals of R-values (h °F ft 2/Btu).
Thus, the U-value is the inverse of the R-value or:
Some manufacturers rate thermal performance using R-Value. For example, an R-factor of 4.0
is the same as a U-Factor of 0.25.
| Window Assembly | U-Factor | R-Value |
|---|---|---|
| Single Glazed | 0.91–1.11 | 1.1–0.9 |
| Double Glazed | 0.43–0.57 | 2.3–1.7 |
| Triple Glazed | 0.15–0.33 | 6.7–3.3 |
Solar Heat Gain Coefficient (SHGC): Blocking Solar Heat
What It Measures
Solar Heat Gain Coefficient (SHGC) measures how well a window blocks heat from sunlight. Specifically, it represents the fraction of incident solar radiation admitted through a window—both directly transmitted and absorbed then released inward as heat.
Understanding the Scale
- Range: 0 to 1
- Lower is better for cooling: A lower SHGC means less solar heat transmission
- Higher may be better for heating: In cold climates, higher SHGC can provide passive solar heating
Visible Transmittance (VT): Maximizing Daylight
What It Measures
Visible Transmittance (VT) measures how much visible light passes through a window. It's an optical property that indicates the amount of daylight transmitted into a space.
Understanding the Scale
- Range: 0 to 1
- Higher is better for daylight: A higher VT means more natural light enters the room
- Typical range: 0.20 to 0.80 for most windows
Balancing VT and SHGC
While you want high VT for daylighting, you also want to control heat gain (SHGC).
Light-to-Solar Gain Ratio (LSG) indicates how efficiently a window transmits daylight while blocking heat gain. It's calculated as:
Understanding the Ratio
- Higher LSG = Better performance: More light with less heat
- LSG > 1.0: Window transmits more light than heat (ideal for hot climates)
- LSG < 1.0: Window transmits more heat than light
Test Yourself
Calculate the R-value and LSG
For each of the following examples, calculate the R-value and LSG. (Round your answers up to two decimal places.) After you enter your answers in the boxes below, check your work by clicking on the “check” buttons below.
Text description of the Calculating R-Value and LSG activity
Calculating R-Value and LSG
Based on the following energy performance ratings, calculate the R-Value and LSGR for each.
- Window #1
- U-Factor: 0.30
- Solar Heat Gain Coefficient: 0.36
- Visible Transmittance: 0.59
- Air Leakage: 0.2
- Window #2
- U-Factor: 0.35
- Solar Heat Gain Coefficient: 0.30
- Visible Transmittance: 0.46
- Air Leakage: 0.2
- Window #3
- U-Factor: 0.32
- Solar Heat Gain Coefficient: 0.45
- Visible Transmittance: 0.58
- Air Leakage: 0.3
Answers:
- Window #1
- R-Value = 3.33
- LSG = 1.64
- Window #2
- R-Value = 2.86
- LSG = 1.53
- Window #3
- R-Value = 3.13
- LSG = 1.29
Air Leakage (AL): Preventing Infiltration
What It Measures
Air Leakage (AL) rating indicates the rate of air infiltration through cracks in the window assembly. It's expressed as:
AL = cubic feet of air per minute per square foot of window area (cfm/ft²)
Understanding the Scale
- Lower is better: Less air infiltration means better energy efficiency
- Typical range: 0.1 to 0.3 cfm/ft² for high-performance windows
- Industry standard: ≤0.3 cfm/ft² meets most energy code requirements
Why It Matters
Air leakage causes:
- Heat loss/gain through convection
- Increased energy bills from conditioned air escaping
- Comfort issues from drafts
- Moisture problems from humid air infiltration
Condensation Resistance (CR): Preventing Moisture Buildup
What It Measures
Condensation Resistance (CR) measures a window's ability to resist condensation formation on the interior surface.
Understanding the Scale
- Range: 0 to 100
- Higher is better: A higher CR rating indicates better resistance to condensation
- Typical range: 20 to 80 for residential windows
10.11 Window Glazing and Layered Assemblies
10.11 Window Glazing and Layered AssembliesRecent advances in window technology have transformed glazing from a simple opening into a dynamic building component that actively manages energy flow. Modern low-emissivity ("low-e") coatings, spectrally selective films, and multi-layer assemblies now enable windows to:
- Control solar heat gain and loss
- Maximize useful daylight while reducing glare
- Minimize fabric fading from UV exposure
- Provide enhanced privacy and security
- Improve resilience in high-hazard zones (wind, seismic)
These technologies are now standard in both new construction and window replacement projects. Understanding how they work helps you select the right glazing for your climate, orientation, and energy goals.
Types of Glazing
Modern window glazing falls into three categories:
- Chemically or physically altered glass
- Coated glass or films
- Multiple-layered assemblies with or without either of the first two items.
Chemically or Physically Altered Glass
What it is: Glass with altered chemical composition to absorb specific wavelengths of sunlight.
How it works: Tints absorb solar energy before it passes completely through the window, reducing the amount of heat that reaches the interior.
Performance:
- Reduces solar heat gain by 25–55% during cooling season
- Available in various colors (bronze, gray, green, blue)
- Can be applied to both glass and plastic laminate
Limitation: Absorbed heat can still transfer indoors via radiation and convection from the warm glass surface.
Coated Glass and Films
What they do: These advanced coatings transmit visible light while reflecting infrared (heat) radiation.
Key benefits:
- High visible light transmission (VT) for daylighting
- Low solar heat gain coefficient (SHGC) to reduce cooling loads
- Blocks most ultraviolet (UV) radiation to protect furnishings
- Often appears with a subtle blue or green tint
Optimal placement: In multi-pane windows, spectrally selective coatings perform best on the outermost pane to reject heat before it enters the assembly.
Low-Emissivity (Low-e) Coatings
What they are: Ultra-thin, virtually invisible metallic or metal-oxide layers (just a few molecules thick) applied to glass surfaces to reduce radiant heat transfer.
How they work: Low-e coatings reflect long-wave infrared radiation (heat) while allowing short-wave solar radiation (light) to pass through. This keeps heat where you want it—inside during winter, outside during summer.
Performance impact:
- Reduces infrared heat transfer by 5–10 times compared to uncoated glass
- Roughly equivalent to adding an extra pane of glass—without the weight or cost
- Slightly reduces visible light transmission (typically 5–15%)
Multiple Layered Assemblies
One of the most effective ways to improve window energy performance is to use multiple layers of glazing separated by sealed spaces. This approach—combined with advanced gas fills—dramatically reduces heat transfer compared to single-pane glass, improving comfort and lowering energy costs year-round.
Gas Fills
When the space between window panes is filled with a less conductive, more viscous gas, three important things happen:
- Convection currents are minimized: Dense gases move more slowly, reducing heat transfer via air circulation within the sealed space
- Conduction through the gas is reduced: Inert gases have lower thermal conductivity than air
- Overall heat transfer decreases: The combined effect lowers the window's U-factor (improves R-value)

Common Insulating Gases
Argon
- Cost: Inexpensive; widely available
- Performance: Improves thermal performance by ~10–15% compared to air
- Properties: Nontoxic, nonreactive, clear, and odorless
- Best for: Standard double- and triple-pane windows in most climates
Krypton
- Cost: More expensive than argon (typically 3–5× higher)
- Performance: Superior insulation; improves thermal performance by ~20–30% compared to air
- Properties: Same inert characteristics as argon, but denser molecule provides better resistance to heat flow
- Best for: Narrow-spaced panes (e.g., triple-pane windows) or high-performance applications where maximum efficiency is prioritized
Argon-Krypton Blends
- A practical compromise that balances performance and cost
- Often used in mid-tier high-performance windows
Xenon (Specialized Applications)
- Provides exceptional thermal performance (~R-20 per inch of gas space)
- Very expensive; typically reserved for specialized or premium architectural applications
Layers of Glass: Single, Double, Triple, and Beyond
Understanding Pane Configurations
Window glazing can be configured as single-pane, double-pane, triple-pane, or multi-pane assemblies. Each additional pane and sealed space increases the window's resistance to heat flow.
Single-Pane Glass
- Typical R-value: ~R-1
- Performance: Provides minimal insulation; accounts for significant heat loss in winter and heat gain in summer
- Best for: Historic preservation (with storm panels), mild climates, or non-conditioned spaces
Double-Pane Windows
- Typical R-value: R-2 to R-4 (depending on coatings, gas fill, and spacing)
- Performance: Significant improvement over single-pane; standard for most residential construction
- Construction: Two glass layers separated by a sealed air or gas-filled space (typically ½–⅝ inch)
Triple-Pane Windows
- Typical R-value: R-5 to R-8+ (with low-e coatings and gas fills)
- Performance: Superior insulation; ideal for cold climates or high-performance building standards
- Considerations: Heavier weight requires reinforced framing; higher upfront cost offset by long-term energy savings
Multi-Pane & Advanced Assemblies
- Four or more layers used in specialized "super windows"
- Can achieve R-values up to R-9 or higher when combined with low-e coatings, gas fills, and warm-edge spacers
- Typically found in net-zero energy homes, passive house construction, or extreme climate applications
The Importance of Spacer Width
The width of the air or gas space between panes significantly affects performance:
- Optimal spacing: ½ inch to ⅝ inch (12–16 mm) maximizes R-value
- Too narrow (< ½ inch): Increased conduction through the gas reduces insulating value
- Too wide (> ⅝ inch): Convection currents develop within the space, increasing heat transfer
10.12 Frame and Spacer Materials for Windows
10.12 Frame and Spacer Materials for WindowsFrame and Spacer Materials
Window frames are available in a variety of materials including aluminum, wood, vinyl, and fiberglass. Frames may be primarily composed of one material, or they may be a combination of different materials such as wood clad with vinyl or aluminum-clad wood. Each frame material has its advantages and disadvantages, as shown in the table below.
| Material | Advantages | Disadvantages | How to Improve |
|---|---|---|---|
| Aluminum | Ideal for strength and customized window design | Conduct heat and therefore lose heat faster and are prone to moisture condensation. | Anodizing or coating will prevent corrosion and electro-galvanic deterioration of aluminum frames; thermal resistance can be improved by placing continuous insulating plastic strips between the interior and exterior frame. |
| Wood | Have higher R-values, are not affected by temperature extremes, and do not generally promote moisture condensation. | Require considerable maintenance in the form of periodic painting or staining. If not properly protected, wood frames can swell, which leads to rot, warping, and sticking. | |
| Vinyl (typically polyvinyl chloride (PVC) | Available in a wide range of styles and shapes, have moderate to high R-values, are easily customized, are competitively priced, and require very low maintenance. | Do not possess the inherent strength of metal or wood. | Larger-sized windows are often strengthened with aluminum or steel reinforcing bars. |
| Fiberglass | Some of the highest R-values; excellent for insulating; will not warp, shrink, swell, rot, or corrode. | Relatively new and are not yet widely available. Unprotected fiberglass does not hold up to the weather and therefore is always painted. |
Spacers are used to separate multiple panes of glass within the windows. Although metal (usually aluminum) spacers are commonly installed to separate glass in multi-pane windows, they conduct heat.
During cold weather, the thermal resistance around the edge of a window is lower than that in the center; thus, heat can escape, and condensation can occur along the edges.

Problems with Spacers
The following have been done to alleviate the problems associated with spacers:
- One manufacturer has developed a multi-pane window using a 1/8-inch-wide (0.32 centimeters-wide) PVC foam separator placed along the edges of the frame. Like other multi-pane windows, these use metal spacers for support, but because the foam separator is secured on top of the spacer between the panes, heat loss and condensation are reduced.
- Several window manufacturers now sandwich foam separators, nylon spacers, and insulation materials such as polystyrene and rockwool between the glasses inside their windows.
- A new type of spacer product called warm-edge technology has evolved in the industry to overcome the thermal inefficiency of conventional aluminum spacers. Warm-edge refers to the type of spacer material used to separate the panes of glass (or glazing) in an insulated window unit. If the material conducts less heat or cold than a conventional aluminum spacer at the edge of the glass, it is said to be "warm-edge." Most of these newer spacers are less conductive and outperform pure aluminum. But still they all contain some kind of metal. And metal is highly conductive.
- Available in the market is a NO-metal Super Spacer, which uses no metal and is made up of 100 percent polymer structural foam. Therefore, it is believed to improve the R-Value of the whole window and reduce moisture condensation problems.
Selecting Main Parameters of Windows
General guidelines for selecting the main parameters of windows based on the climate are provided in the table below.
| - | Colder climate | Moderate Climate | Warm Climate |
|---|---|---|---|
| U-Factor | Less than 0.33 | 0.33 | 0.33 |
| Visual Transmittance | 50 percent | >50 percent | >60 percent |
| SHGC | 0.4-0.55 | >0.55 | <0.4 |
| UV-Protection | >75 percent | 75 percent | 75 percent |
| Edge Spacers | Super Spacers | Warm edge spacers | Warm edge spacers |
| Frame | Non-conductive | Non-conductive | Non-conductive |
| Air leakage | <0.3 cfm/sq.ft | <0.3 cfm/sq.ft | <0.3 cfm/sq.ft |
Improvement in Window Performance
The image below shows the improvement in window performance (R-value) with advanced window glazing. It can be seen from the figure that the super windows are losing less heat and are even making progress to gain heat instead of losing heat because of solar heat gains.

10.13 Saving Energy while Staying Cool
10.13 Saving Energy while Staying Cool- Ceiling Fans:
- Using a ceiling fan allows you to raise the thermostat setting by about 4°F without reducing comfort. In moderate climates, ceiling fans can sometimes replace air conditioning altogether.
- Set Your Thermostat Wisely:
- Set your programmable thermostat as high as comfortable in the summer and raise the setpoint when you’re away from home.
- The Department of Energy (DOE) and ENERGY STAR recommend finding a comfortable indoor temperature during the day and increasing it by 7°F when no one is home. Start with an indoor temperature between 75-78°F during the day.
- Choose a programmable thermostat that is appropriate for your HVAC system and household needs.
- Maintain Your Air Conditioner:
- Clean or replace air conditioner filters once a month or as recommended by your HVAC contractor.
- Efficient Use of Exhaust Fans:
- Turn off kitchen, bath, and other exhaust fans within 20 minutes after use. When replacing these fans, consider high-efficiency, low-noise ENERGY STAR models that can exhaust 50-80 cubic feet per minute (CFM) of air.
- Weatherize Your Home:
- Minimize uncontrolled air leakage and slow heat transfer by weatherizing your home. Look for financial resources for home energy efficiency upgrades through local utility programs and federal tax incentives. Check out the ENERGY STAR rebate finder for more information.
- Manage Window Coverings:
- During summer, keep window coverings closed during the day to block the sun’s heat.
- Choose Energy-Efficient Products:
- When buying new cooling equipment, select energy-efficient products like heat pumps. Your contractor should provide energy fact sheets for different models to help you compare energy usage. Look for the ENERGY STAR label when purchasing new products.
- Consider Heat Pump Systems:
When upgrading HVAC equipment, consider using heat pump systems for their energy efficiency and effectiveness.
10.14 Conclusion
10.14 ConclusionIn this lesson, you explored the interconnected roles of humidity, air conditioning, and window performance in creating a comfortable, energy-efficient home. Here’s a quick synthesis of what you’ve learned:
Humidity & Comfort: You discovered that how hot or cool we feel isn’t just about temperature—it’s heavily influenced by moisture in the air. High humidity reduces your body’s ability to cool itself through sweat evaporation and increases the latent load on your HVAC system. Effective cooling requires managing both temperature and humidity.
Air Conditioning & Efficiency Ratings: We examined different AC system types and how to evaluate their performance using EER (Energy Efficiency Ratio) and SEER (Seasonal Energy Efficiency Ratio). These metrics help you compare equipment, estimate operating costs, and choose systems that deliver the right balance of capacity, efficiency, and dehumidification for your climate.
Windows as Energy Pathways: Despite covering only 15–20% of your exterior walls, windows are often the largest source of unwanted heat gain in summer and heat loss in winter. You learned how to read the NFRC label, interpret key metrics like U-factor, SHGC, VT, and Air Leakage, and apply modern glazing technologies—low-e coatings, inert gas fills, spectrally selective tints, and multi-pane assemblies—to dramatically reduce thermal bridging.
The Big Picture: Windows + AC + Humidity Work Together
The most important takeaway from this lesson is that windows and air conditioning don’t operate in isolation. High-performance windows reduce the cooling and dehumidification load before it reaches your HVAC system. When you pair efficient glazing with a properly sized, high-EER/SEER air conditioner, you get:
- Lower energy bills
- Better humidity control
- Improved indoor comfort
- Extended equipment lifespan
- Reduced peak demand on the electrical grid
Lesson 11: Transportation
Lesson 11: TransportationThe links below provide an outline of the material for this lesson. Be sure to carefully read through the entire lesson before returning to Canvas to submit your assignments.
11.1 Lesson 11 Introduction
11.1 Lesson 11 IntroductionWelcome to Lesson 11
Transportation is a major part of everyday life. It helps people travel to work, school, and stores, and it also moves food, products, and raw materials across the country and around the world. Because transportation is so important, it also uses a large amount of energy.
In the United States, most transportation energy still comes from petroleum-based fuels such as gasoline, diesel, and jet fuel. However, transportation is changing. Today, we also see hybrid vehicles, electric vehicles, biofuels, natural gas vehicles, and other advanced transportation technologies. At the same time, different types of transportation—such as cars, trucks, trains, ships, barges, and airplanes—use energy in different ways and have different impacts on efficiency, cost, and emissions.
In this lesson, you will explore the major types of transportation, the fuels they use, and how energy is converted to move people and goods. You will also examine vehicle efficiency, cost to drive, and how transportation choices affect energy use in the United States.
Lesson Objectives:
- Identify the major types of transportation, including light-duty vehicles, trucks, rail, water transportation, and aircraft.
- Explain how internal combustion engines convert fuel into motion through the four-stroke cycle.
- Compare gasoline, diesel, hybrid, plug-in hybrid, and electric vehicles based on how they operate and the fuels they use.
- Describe several alternative and advanced transportation fuels, including biodiesel, ethanol, natural gas, hydrogen, and propane.
- Explain the purpose of vehicle efficiency standards such as CAFE standards.
- Calculate or compare vehicle cost to drive using fuel price and fuel efficiency information.
11.2 Energy Use for Transportation
11.2 Energy Use for TransportationAs we have seen nearly a third of total energy use in the US falls into the transportation sector. This amounts to 28.2 Quadrillion BTUS of energy in 2025, which is 28,200,000,000,000,000 BTU!!.

Text description of the U.S. Enegry Consumption by Score and Sector, 2025 image.
The image depicts a flowchart illustrating U.S. energy consumption by source and sector for the year 2025, measured in quadrillion British thermal units (Btu). On the left side, energy sources are represented in a vertical column, encompassing petroleum, natural gas, renewable energy, coal, and nuclear, each accompanied by numerical figures and percentages indicating their contribution to total energy consumption. Each source is connected by lines to the right side of the chart, which categorizes energy use by sector, including transportation, industrial, residential, and commercial. The end-use sectors are color-coded, with transportation highlighted in yellow at 37%, followed by industrial at 35%, residential at 15%, and commercial at 9%. The central section labeled "electric power sector" notes energy losses and electricity sales to consumers with corresponding percentages. The chart includes a total at the bottom for both sources and sectors.
According to the U.S. Energy Information Administration, petroleum products supplied about 89% of total U.S. transportation energy use in 2025. Petroleum includes fuels such as gasoline, diesel, and jet fuel. This means that most transportation in the United States still depends heavily on oil-based fuels.
The same source reports that biofuels contributed about 6% of transportation energy use in 2025, and most of that biofuel was blended with petroleum fuels such as gasoline, diesel, and jet fuel. Natural gas accounted for about 5%, and nearly all of that use was connected to natural gas pipeline compressors rather than everyday passenger vehicles. Electricity used by mass transit systems was less than 1% of total transportation energy use.
These numbers are helpful because they show that, even though electric vehicles receive a lot of attention, the U.S. transportation system is still mostly powered by petroleum.They also show that changing transportation energy use is a big challenge because it involves millions of vehicles, many different industries, and several kinds of infrastructure.
Gasoline is still the largest transportation fuel in the United States. On an energy basis, gasoline accounted for about 52% of total transportation energy consumption in 2025, while distillate fuels such as diesel accounted for about 22%, and jet fuel accounted for about 13%.
This helps explain why transportation is such an important topic in an energy class. When we talk about reducing fuel use, lowering emissions, or improving efficiency, we are often talking about reducing dependence on gasoline, diesel, and jet fuel.

Text description of the U.S. Transportation Energy Sources, 2025 image.
The image is a pie chart illustrating the sources of transportation energy in the United States for the year 2025. The chart is predominantly circular and divided into several color-coded segments, each representing different energy sources. The largest segment, colored in bright blue, indicates that gasoline accounts for 52% of transportation energy sources. Adjacent to it is a larger segment colored in dark green, representing distillates at 22%. The other segments are smaller: jet fuel (colored yellow) at 13%, biofuels (colored orange) at 6%, natural gas (light green) at 5%, and a small gray segment labeled "other," which is only 2%. Each segment is clearly labeled with its corresponding percentage, providing a visual representation of the distribution of energy sources. Below the chart, there is a note indicating that the data is sourced from the U.S. Energy Information Administration, along with a disclaimer about the sum of individual components not equaling 100% due to rounding.
11.3 Types of Transportation
11.3 Types of TransportationWhen many people think about transportation, they usually picture light-duty vehicles such as cars, SUVs, vans, and pickup trucks. These are the vehicles most people use in everyday life to get to school, work, stores, and other activities. Because they are so common, light-duty vehicles make up a large share of transportation energy use in the United States. In fact, they account for about 52% of total U.S. transportation energy use.
However, transportation includes much more than personal vehicles. A complete understanding of transportation must also include the systems that move goods, raw materials, and large numbers of people from place to place. These systems are essential to the economy and to daily life, even if we do not always notice them.
Light-Duty Vehicles
Light-duty vehicles are used mainly to transport people. This category includes:
- Cars
- Sport utility vehicles (SUVs)
- Minivans
- Small pickup trucks
These vehicles are common because they are convenient and flexible. People can use them for commuting, shopping, and travel. Most light-duty vehicles have traditionally used gasoline, but today they may also be powered by diesel, electricity, or hybrid systems.
Because so many people rely on these vehicles every day, they play a major role in energy demand, fuel consumption, and greenhouse gas emissions.
Medium- and Heavy-Duty Transportation
Not all transportation is about moving people. A large part of the transportation system is used to move products and materials. This includes trucks that deliver food, furniture, clothing, building supplies, and online orders.
Examples of medium- and heavy-duty transportation include:
- Delivery vans
- Box trucks
- Semi-trucks and tractor-trailers
- Dump trucks
- Buses
These vehicles are especially important because they connect manufacturers, warehouses, stores, and customers. Many of them use diesel fuel because diesel engines are powerful and efficient for carrying heavy loads. However, some buses and trucks are beginning to use electricity, hydrogen, or other alternative fuels.
Rail Transportation
Trains are another important form of transportation. Rail systems can move both people and freight.
- Passenger rail moves people between cities or within urban areas.
- Freight rail moves goods such as coal, grain, chemicals, vehicles, and shipping containers.
Rail transportation is often more energy-efficient than moving the same amount of cargo by truck, especially over long distances. This is one reason trains are important in the broader energy and transportation system.
Water Transportation
Transportation by water is also an important part of the economy. Ships and barges move large amounts of cargo across oceans, rivers, and inland waterways.
Examples include transporting:
- Oil and natural gas products
- Agricultural products such as corn and soybeans
- Coal and other raw materials
- Consumer goods in shipping containers
Water transportation can be very efficient for moving heavy cargo over long distances. Barges, for example, can carry a large amount of material using relatively less energy per ton of cargo compared with trucks.
Air Transportation
We also need to consider air travel. Aircraft move both passengers and cargo quickly over long distances. Air travel is especially important for:
- Business and personal travel
- Emergency and medical transport
- Shipping high-value or time-sensitive goods
Although air transportation is very fast, it usually requires more energy per passenger or per pound of cargo than trains or ships. For this reason, aviation is an important area of study when discussing transportation energy use and efforts to reduce emissions.
Transportation Energy Sources in the United States
In an energy class, it is not enough to know what types of vehicles we use. We also need to know what fuels power them.

Text description of the Transportation Energy Use by Mode and Type image.
The image presents a bar graph illustrating the projected energy use by mode and type for transportation in the U.S. for the year 2025. Each bar represents different transportation modes, with varying lengths and colors indicating their respective percentages of total energy use. The largest bar, depicted in dark purple, signifies light trucks at 33%. This is followed by a light blue bar for cars and motorcycles at 19%, and a green bar representing other trucks at 23%. The brown bar denotes aircraft at 12%, while smaller bars in various colors signify boats and ships (4%), pipeline fuel (3%), trains and buses (3%), military (all modes) (2%), and lubricants (less than 1%). The graph is accompanied by a data source note at the bottom, including detailed citation information.
Data table for the bar chart.
| Mode/Type | Perecent Usage |
|---|---|
| Light Trucks | 33 |
| Cars and Motorcycles | 19 |
| Other rucks | 23 |
| Aircraft | 12 |
| Boats and Ships | 4 |
| Pipeline Fuel | 3 |
| Trains and Buses | 3 |
| Military (all modes) | 2 |
| Lubricants | <1 |
11.4 Internal Combustion Engines
11.4 Internal Combustion EnginesMuch of the transportation sector relies on internal combustion engines (ICEs). These engines use a mixture of fuel and air that is ignited inside the engine to move a piston. In this process, the chemical energy stored in the fuel is converted into mechanical energy to move the vehicle and thermal energy as heat.
Most internal combustion engines operate using a four-stroke cycle, which includes the following steps:
- Intake – The engine takes in a mixture of air and fuel.
- Compression – The piston compresses the air-fuel mixture.
- Combustion (Power) – The mixture ignites, creating a small explosion that pushes the piston down and produces power.
- Exhaust – The engine pushes out the waste gases created during combustion.

Text description of the Four Stroke Cycle Engine image.
The image illustrates a four-stroke cycle engine, consisting of four distinct sections. Each section depicts a stage of the engine’s operation: Intake, Compression, Power, and Exhaust.
- Intake: The leftmost section shows an intake valve where air (represented by an arrow) is entering a blue cylinder, with a green area indicating the volume of air or fuel mixture. The piston is positioned at the bottom of its stroke.
- Compression: The next section is labeled "Compression" and features the piston raised to compress the air-fuel mixture inside the blue cylinder. The valve is closed, and the internal chamber is shown in green, indicating its sealed environment.
- Power: In the third section, labeled "Power," the piston is at the top of its stroke after combustion has occurred, shown by a red area indicating high pressure. Arrows indicate the direction of force generated by the combustion process.
- Exhaust: The rightmost section shows the piston moving downwards, pushing out exhaust gases (depicted by an arrow) through the exhaust valve. The cylinder is colored orange to indicate the exhaust phase.
The sections are numbered one through four at the bottom in corresponding colors, enhancing clarity of each stage.
There are two main types of internal combustion engines, spark-ignition (gasoline engines) and compression ignition (diesel engines).
Watch this video by Shannon Odell from TEDed:
Video: This is what happens when you hit the gas (6:04)
Transcript: This is what happens when you hit the gas
Intro
Narrator: In 2015, two men drove a Volkswagen across the continental United States on just over 100 gallons of fuel. Their 81-mile-per-gallon performance doubled the car’s estimated fuel rating, and set the record for the lowest fuel consumption ride of a diesel car. The duo call themselves hypermilers and are experts in techniques that maximize a car’s fuel efficiency, such as the pulse-and-glide.
In the pulse, drivers accelerate slowly until they’re traveling slightly above their intended speed. They then slowly release the throttle and glide, until they’re slightly below, and repeat. To understand why this strategy saves fuel, we first need to unpack what exactly is going on beneath a car's hood.
Internal Combustion
Non-electric cars run on internal combustion engines, or ICEs. Cars are often advertised as sporting a 4-, 6-, or 8-cylinder engine, which refers to this device's main components. Within each of these cylinders is a piston, which moves up and down, spinning a bar known as a crankshaft, effectively converting linear motion into a rotary motion that can drive the wheels. What powers these pistons’ movements is what gives these engines their namesake: combustion.
As the piston lowers, air and fuel are sprayed into the cylinder’s chamber. Then as the piston rises, this air and fuel mixture is compressed. In gasoline engines, a spark is introduced, igniting the gas. In diesel engines, the compression alone creates a mini explosion. This combustion causes an immediate increase in temperature and pressure, propelling the piston down, as it starts the cycle again.
The gas pedal controls the amount of air and subsequent fuel released into the chamber. The more fuel in the chamber, the more powerful the combustion, making the crankshaft rotate faster. Driving down the highway, ICE cars spark thousands of blasts per minute. But explosion-power driving is pretty inefficient, as much of the energy generated is lost to heat. In fact, only 16 to 25% goes towards moving the wheels. These explosions also create CO2, and ICE engines produce 15% of the total global carbon emissions.
The pulse-and-glide can increase efficiency for two reasons. First, when accelerating to higher speeds during the pulse, the engine works at a higher efficiency compared to traveling at a constant lower speed. And second, modern car engines shut off fuel injection or idle, when decelerating. Meaning that as the car glides, the wheels are driven by inertial energy, rather than combustion, ultimately saving fuel.
But even at their peak performance, ICE hypermilers can’t compete with the true champion of fuel efficiency rides: the electric vehicle.
Electric Vehicles
Many EVs run on induction motors, which have two main parts: a stator and a rotor. The stator is a series of rings, with copper wires wrapped around it. By conducting electricity at variable rates, these wires create a rotating magnetic field. This field induces the rotor with electrical current, causing it to spin, and driving the motion of the wheels.
For EVs, pressing on the accelerator changes the frequency of current driven into the wires of the stator, in turn increasing the rate at which the rotor spins. By utilizing battery power rather than gasoline, 65 to 69% of the energy consumed by EVs goes directly to moving the wheels. And since EVs don't create explosions, fewer parts are needed below the hood. While a typical ICE vehicle has over 2,000 moving parts to help contain, cool, and maintain combustion, a typical EV has about 20.
EVs are completely changing the hypermiling game as drivers compete to travel the farthest on the fewest kilowatt-hours. And records will likely only get more impressive, as the design of EV motors allows for the introduction of innovative energy-saving devices. For example, most EVs utilize regenerative braking, where energy normally lost to friction is conserved. As the car slows, the electric motor operates in reverse, capturing the vehicle’s kinetic energy to recharge the battery. Some companies are even equipping EVs with rooftop solar panels, further increasing their range.
Since they don’t burn fuel, EVs have zero tailpipe emissions. That’s not to say they’re always carbon neutral. EVs require regular charging of their batteries, meaning their emission profile is only as clean as the electric utility they plug into. So as global grids continue to shift towards renewable sources, EVs are also becoming greener, making them an even more attractive, hyper-efficient option.
11.4.1 Gasoline (Spark Ignition) Engines
11.4.1 Gasoline (Spark Ignition) EnginesGasoline engines are probably the most common type of internal combustion engine you see in everyday life. In the United States, most passenger vehicles use gasoline as their main fuel.
Gasoline engines are called spark-ignition engines because the combustion step begins when a spark plug ignites the compressed air-fuel mixture inside the engine. This small explosion pushes the piston downward and produces power.
Gasoline is made of short-chain hydrocarbons refined from petroleum. It has a relatively low boiling point, around 85°C (185°F), which is lower than the boiling point of water. Gasoline is also highly volatile, which means it evaporates easily. You may notice this when fueling a car or filling a lawn mower on a hot day. The smell you notice comes from gasoline vapors entering the air as some of the hydrocarbons evaporate.
Gasoline is sold based on its octane rating. In the United States, gasoline is usually sold as regular, midgrade, and premium. These values can vary somewhat by state, but regular gasoline is usually 87 octane, midgrade is around 89 octane, and premium is typically 91 to 93 octane.
Octane ratings are based on two reference fuels:
- Iso-octane (C8H18), which is assigned a value of 100.
Iso-octane
Text description of the Iso-octane image
Ball-and-stick model of an iso-octane molecule showing a branched hydrocarbon structure composed of eight carbon atoms and eighteen hydrogen atoms. The central carbon chain has three methyl branches, creating a compact, irregular shape. Carbon atoms are typically shown as dark gray or black spheres connected by rods, with smaller white hydrogen atoms attached around the outside.
Note: You can use your mouse to rotate and zoom in on the Iso-octane molecule.
- Normal heptane (C7H16), which is assigned a value of 0.
Heptane
Text description of the Heptane image
Ball-and-stick model of a heptane molecule showing a straight-chain hydrocarbon structure composed of seven carbon atoms and sixteen hydrogen atoms. The carbon atoms form a zigzag chain, with smaller hydrogen atoms attached around the outside. Carbon atoms are typically shown as dark gray or black spheres connected by rods, while hydrogen atoms are shown as smaller white spheres.
Note: You can use your mouse to rotate and zoom in on the Heptane molecule.
Fuels with more branched hydrocarbon chains tend to have higher octane ratings, while fuels with straight-chain hydrocarbons tend to have lower octane ratings. Some fuels can even have octane values above 100. For example, ethanol (C2H5OH) has an octane rating of about 113 and is often blended into gasoline. The fuel you buy is a mixture of many different types of compounds. The octane rating (87, 89, 93) is the average mix of all of the compounds found in that fuel.
11.4.2 Diesel (Compression Ignition) Engines
11.4.2 Diesel (Compression Ignition) EnginesDiesel engines are different from gasoline engines in one very important way: they do not use a spark plug. Instead, diesel engines use compression ignition, also called autoignition.
In a diesel engine, air is compressed inside the cylinder until it becomes very hot. Then diesel fuel is injected into that hot, high-pressure air. Because the air is so hot, the fuel ignites on its own. This combustion pushes the piston downward and produces work.
Diesel engines usually operate at higher compression ratios than gasoline engines, which helps them ignite the fuel without a spark. This is one reason diesel engines are often more efficient than gasoline engines.
Because diesel engines ignite fuel differently, diesel fuel also has different chemical properties than gasoline. Diesel fuel generally contains longer hydrocarbon chains and tends to work better with straighter-chain molecules, while gasoline performs better with more branched molecules.
Diesel fuel is rated using a cetane number. The cetane number measures how easily and quickly diesel fuel ignites under compression. In general, a higher cetane number means the fuel ignites more readily, which can improve engine starting and combustion performance.
Cetane ratings are based on reference fuels, including:
- Cetane (C16H34), which has a cetane number of 100
Text description of the Cetane image
Ball-and-stick model of a cetane molecule (C16H34) showing a straight-chain hydrocarbon structure composed of sixteen carbon atoms and thirty-four hydrogen atoms. The carbon atoms form a long zigzag chain, with smaller hydrogen atoms attached around the outside. Carbon atoms are typically shown as dark gray or black spheres connected by rods, while hydrogen atoms are shown as smaller white spheres.
Note: You can use your mouse to rotate and zoom in on the Iso-octane molecule.
- Iso-cetane or 2,2,4,4,6,8,8-heptamethylnonane, which has a cetane number of 15
Text description of the Iso-cetane image
Ball-and-stick model of a 2,2,4,4,6,8,8-heptamethylnonane molecule showing a highly branched hydrocarbon structure. The molecule consists of a nine-carbon main chain with seven methyl groups attached at multiple positions, creating a compact, irregular shape. Carbon atoms are typically shown as dark gray or black spheres connected by rods, while smaller white spheres represent hydrogen atoms attached around the outside. The extensive branching gives the molecule a wider, more clustered appearance than a straight-chain hydrocarbon of similar size.
Note: You can use your mouse to rotate and zoom in on the Iso-octane molecule.
In simple terms, the cetane number tells us how easily diesel fuel will ignite in a diesel engine. This is different from octane rating in gasoline, which measures how well a fuel resists igniting too early.
Petrol (Gasoline) versus Diesel - Don’t try this at home chemical combustion video.
Video: What's the Difference Between Petrol & Diesel? | Bang Goes The Theory | Earth Science (3:51)
Transcript: What's the Difference Between Petrol & Diesel?
Jem Stansfield: Nowadays most cars on the road fall into one of two categories: either petrol or diesel. Now, from the shape of these vehicles on the outside, you wouldn't know which is which, but on the inside their engines just don't work in the same way, and the net result of that is what finally emerges from their exhaust pipes is also significantly different. All but the very latest diesels give off at least twice the toxic nitrogen dioxide and 10 or 20 times the dangerous soot particles that petrol cars do. So why is there such a big difference? It really comes down to the fuel itself.
Petrol and Diesel, they may look the same and their pumps sit side by side on the garage forecourt, but there is a significant difference between the two of them, and to show you I need a bowl of each and a box of matches. By the way, danger alert: do not not try this at home.
Now petrol is a highly volatile fuel. That means it evaporates easily, so Petrol gas effectively comes up and mixes with the air, and so catches fire readily. But diesel, made of longer heavier molecules, gives off fewer fumes and is actually quite difficult to light. Now because of this big difference in flammability between the two fuels, the engines work in fundamentally different ways.
This is my petrol engine. It's very simple. It's just a single cylinder, and into it I've got a nice fitting piston that can slide up and down. The way the fuel gets introduced into the cylinder, because petrol vaporizes so readily, it actually gets injected into a warm chamber just prior to the cylinder. And then, as the Piston Rises, it sucks in a mixture of petrol Vapors and air, and because they're both gases essentially, they can mix very very intimately. So when you introduce a spark, you get quite a nice explosion. And you'll see on that explosion it's a very blue flame, and that blue means that there's very few soot particles in there. It's clean burning.
Now a diesel engine has to work differently because diesel won't readily vaporize into a gas to make it flammable. It's injected into the air as a kind of fine Mist, a sort of High Press aerosol. Now that really does catch fire. So I'll spray a fine mist of diesel droplets into my cylinder. There you go. There's a big difference. The flame is bright yellow, and that yellowness indicates that there are glowing soot particles in there. And you can quite readily see the smoke coming off it, and indeed the soot, and that's the problem because in the operation of an engine there really isn't time for all those droplets of liquid to burn completely.
So what happens is some of it just gets reduced down to particles of carbon soot, and that means that the exhaust system of a diesel engine has a bigger job to do.
11.5 Hybrid and Electric Vehicles
11.5 Hybrid and Electric VehiclesToday, many vehicles use electricity in addition to or instead of gasoline. These vehicles are designed to improve fuel efficiency, reduce emissions, and lower operating costs. The three main types are hybrid vehicles, plug-in hybrid vehicles, and electric vehicles.
Hybrid Vehicles
A hybrid vehicle uses both a gasoline-powered internal combustion engine and an electric battery. The battery helps power the vehicle, but a hybrid cannot be plugged in to charge. Instead, the battery is recharged through regenerative braking and by the engine during normal driving.
Regenerative braking is a system that captures some of the energy normally lost when the vehicle slows down and sends that energy back to the battery. Because the battery helps the engine, the vehicle uses less gasoline than a traditional gasoline-powered vehicle. This makes hybrid vehicles more fuel-efficient than standard internal combustion engine vehicles.
Plug-In- Hybrid Vehicles
A plug-in hybrid electric vehicle, or PHEV, also uses both a gasoline engine and an electric battery. However, a PHEV has a larger battery than a standard hybrid. This allows the vehicle to drive on electricity alone for a limited distance, usually about 10 to 30 miles, before the gasoline engine is needed.
Unlike a regular hybrid, a plug-in hybrid can be charged by plugging it into an electrical outlet or charging station. This makes PHEVs a good choice for drivers with short daily commutes, especially if the commute is within the vehicle’s electric-only range. For longer trips, the gasoline engine provides flexibility because the driver can refuel at a gas station as usual.
Electric Vehicles
Electric vehicles (EVs) run entirely on electricity. They do not have a gasoline engine, and they produce no tailpipe emissions because there is no combustion happening in the vehicle. Because electric vehicles convert electrical energy directly to mechanical energy to turn the wheels, the are more efficient than internal combustion engines. EVs are recharged by plugging them into the electrical grid.
Because electric vehicles have fewer moving parts than traditional gasoline-powered vehicles, they usually require less maintenance. For example, they do not need oil changes and have fewer engine-related parts that can wear out. However, EVs are often heavier than gasoline vehicles because of their large battery packs.
11.6 Alternative Fueled Vehicles
11.6 Alternative Fueled VehiclesIn addition to gasoline, diesel, hybrid, and electric vehicles, there are several other alternative and advanced fuel vehicles on the market. These vehicles are not as common as gasoline or diesel vehicles, but they are still commercially available and important to mention as they may become more common in the future.
These fuels are often studied because they may reduce petroleum use, lower some emissions, or provide more fuel choices for drivers and fleets.
Biodiesel
Biodiesel is a fuel that can be made from vegetable oils, animal fats, or recycled cooking oil, such as used fryer oil from restaurants. It can be used in some diesel engines as an alternative to petroleum diesel.
Biodiesel is usually sold as a blend with petroleum diesel. For example:
- B20 = 20% biodiesel and 80% petroleum diesel
- B100 = 100% biodiesel
Many diesel vehicles can use lower biodiesel blends, such as B5 or B20, without major changes. Higher blends may require engine modifications or manufacturer approval.
Biodiesel is often described as a cleaner-burning fuel than petroleum diesel. It can also improve the lubricity of the fuel, which means it helps reduce friction between engine parts. Some drivers even say biodiesel exhaust smells a little like fried food.
Ethanol
Ethanol is an alcohol-based fuel with the chemical formula CH3CH2OH. In the United States, ethanol is commonly made by fermenting corn. In other countries, such as Brazil, it is often made from sugar cane.
Text description of the Ethanol image
Ball-and-stick model of an ethanol molecule (CH3CH2OH) showing a simple organic structure composed of two carbon atoms, six hydrogen atoms, and one oxygen atom. The two carbon atoms are connected in a short chain, with an oxygen atom attached to one end and a hydrogen atom bonded to the oxygen, forming a hydroxyl group. Carbon atoms are typically shown as dark gray or black spheres, hydrogen atoms as smaller white spheres, and the oxygen atom as a red sphere.
Note: You can use your mouse to rotate and zoom in on the Iso-octane molecule.
Ethanol is blended into most gasoline sold in the United States. The most common blend is:
- E10 = 10% ethanol and 90% gasoline
Some vehicles, called flex-fuel vehicles, can use higher ethanol blends such as E85.
Because ethanol contains oxygen, it can help gasoline burn more completely in the engine. This can reduce carbon monoxide and some other pollutants.
However, ethanol contains less energy per gallon than gasoline. This means a vehicle will usually travel fewer miles on a gallon of ethanol than on a gallon of pure gasoline.
Ethanol has less energy per gallon than petroleum derived gasoline, which means you will be able to drive less miles on one gallon of ethanol versus on gallon of gasoline.
Natural Gas
As discussed earlier in the course, natural gas is a fossil fuel made mostly of methane, CH4.
Natural gas vehicles are designed to use either:
- Compressed natural gas (CNG)
- Liquefied natural gas (LNG)
CNG is stored at very high pressure, usually around 3,600 psi. LNG is natural gas that has been cooled to about -260°F so that it becomes a liquid.
Natural gas vehicles are often used in fleet applications, such as buses, delivery vehicles, and municipal vehicles. They work especially well when vehicles return to a central location each day for fueling.
Even though natural gas pipelines are common in many parts of the United States, CNG and LNG fueling stations are much less common than gasoline stations. This is one reason natural gas vehicles are often used in centrally managed fleets rather than by individual drivers.
Propane
Propane, also called liquefied petroleum gas (LPG), is another alternative transportation fuel. It is used in some fleet vehicles, school buses, delivery trucks, and service vehicles.
- Propane is C3H8
Text description of the Propane image
Ball-and-stick model of a propane molecule (C3H8) showing a straight-chain hydrocarbon structure composed of three carbon atoms and eight hydrogen atoms. The carbon atoms are connected in a short chain, with hydrogen atoms attached around the outside. Carbon atoms are typically shown as dark gray or black spheres connected by rods, while hydrogen atoms are shown as smaller white spheres. Propane is a three-carbon alkane with the molecular formula C₃H₈.
Note: You can use your mouse to rotate and zoom in on the Iso-octane molecule.
Propane vehicles can produce lower emissions of some pollutants compared with conventional gasoline vehicles. Propane is also widely used in areas where fleet managers want a fuel that is easy to store and transport.
Like natural gas, propane is most common in fleet settings where vehicles can refuel at a central location. It is less common for personal passenger vehicles.
Hydrogen
Hydrogen is the simplest element on the periodic table with just one electron and proton. Hydrogen can also be used as transportation fuel. Some vehicles use hydrogen in a fuel cell, which produces electricity to power an electric motor. These vehicles are called fuel cell electric vehicles (FCEVs).
Hydrogen fuel cell vehicles do not burn gasoline or diesel. Instead, the fuel cell combines hydrogen with oxygen from the air to produce electricity. The main byproduct is water vapor.
Hydrogen vehicles can be refueled more quickly than many battery electric vehicles, but hydrogen fueling stations are still very limited in most areas. Because of this, hydrogen vehicles are not yet common for most drivers.
11.7 Vehicle Efficiency Standards
11.7 Vehicle Efficiency StandardsMost internal combustion engine (ICE) vehicles measure fuel efficiency in miles per gallon (mpg). A higher mpg value means the vehicle can travel farther using one gallon of fuel.
Today, fuel efficiency is an important part of vehicle design, but that was not always the case. Before the oil crisis of the 1970s, fuel economy was not a major concern for many automakers or consumers. In fact, fuel efficiency had declined over time. The 1908 Model T got about 21 mpg, while the average American car in 1973 got only about 12 mpg.
Because of rising oil prices and concerns about dependence on foreign oil, Congress passed the first Corporate Average Fuel Economy (CAFE) standards in 1975.
What are the CAFE Standards?
CAFE standards were created to improve the fuel economy of cars and light trucks sold in the United States. The goal was to encourage automakers to build more fuel-efficient vehicles and reduce overall fuel use.
The word corporate average is important. CAFE standards apply to the average fuel economy of all the vehicles a manufacturer sells, not to every single vehicle by itself. This means an automaker can still sell some less-efficient vehicles as long as those are balanced by more-efficient models in the rest of the fleet.
For example, a company might sell:
- many smaller, fuel-efficient cars
- some larger vehicles with lower fuel economy
If the average for the full fleet meets the standard, the company is in compliance.
Important Notes
CAFE standards originally focused on cars and light trucks. They did not apply in the same way to heavy-duty vehicles. Some trucks used for work purposes were treated differently from passenger cars, which is one reason truck efficiency rules developed differently over time.
CAFE Timeline
- 1978: The first CAFE standard began at 18 mpg
- 1990: The standard gradually increased to 27.5 mpg
- 1990 to 2010: The standard stayed at 27.5 mpg
- 2011 to 2020: Standards increased significantly, rising from about 30 mpg to 42.4 mpg
These changes pushed automakers to improve engines, reduce vehicle weight, and develop hybrid and electric vehicles.
Interactive Data
The chart below from the Alternative Fuels Data Center shows historical fuel economy data and trends in vehicle efficiency from 1978 with estimates into the future. Use it to explore how fuel economy has changed over time.
The Vehicle Fuel Efficiency (CAFE) Requirements by Year graphic with descriptive text is available from the U.S. Department of Energy's Office of Critical Minerals and Energy Innovation site.
How Corporate Average Fuel Economy Works
CAFE standards are based on the average fuel economy of a company’s fleet.
For example, suppose a manufacturer sells:
- 1,100 cars that get 50 mpg
- 400 cars that get 22 mpg
The average fleet fuel economy would be:
So even though not every vehicle gets more than 42 mpg, the company’s average fleet fuel economy is 42.5 mpg.
Electric Vehicles and CAFE Standards
Hybrid vehicles, plug-in hybrid vehicles, and electric vehicles have helped manufacturers improve their fleet fuel economy. Because these vehicles use less gasoline, or no gasoline at all, they raise the average efficiency of the vehicles a company sells.
This means automakers can improve their CAFE performance by offering more:
- hybrid vehicles
- plug-in hybrid vehicles
- electric vehicles
As a result, fuel economy standards have played an important role in encouraging the growth of advanced vehicle technologies.
11.8 Efficiency Per Passenger Mile
11.8 Efficiency Per Passenger MileThe chart below compares different types of transportation using the same unit: gasoline gallon equivalents per passenger mile. This makes it possible to compare transportation modes on a common basis, even when they use different energy sources such as gasoline, diesel, or electricity.
A passenger mile means moving one passenger one mile. Looking at efficiency this way helps us compare how much energy is used to move people by car, bus, train, or airplane.
The Average Per-Passenger Fuel Economy by Travel Mode graphic with descriptive text is available from the U.S. Department of Energy's Office of Critical Minerals and Energy Innovation site.
Looking at the chart above, transit rail appears to be one of the most efficient ways to move passengers. Rail systems are often efficient because trains can carry many people at once, experience relatively low rolling resistance, and in many cases use electricity.
Air travel may also appear more efficient than some people expect on a per passenger mile basis. Although airplanes use a large amount of energy overall, many flights carry a high number of passengers. When that energy use is divided among many riders, the energy use per passenger mile can be lower than expected.
You may be surprised that transit buses can have relatively low efficiency on a per passenger mile basis. One reason is that buses often run fixed routes and schedules whether they are full or nearly empty. If only a small number of people are riding, the energy used by the bus is divided among fewer passengers, which lowers efficiency per passenger mile.
Demand response vehicles, such as taxis and ride-share vehicles like Uber or Lyft, can also be less efficient. These vehicles may need to travel extra distance to pick up passengers, which increases the amount of energy used for each trip.
Key Takeaways
Transportation efficiency is not just about the vehicle itself, but it also depends on how many passengers are riding, how far the vehicle travels, whether the vehicle runs full or mostly empty and what type of fuel it uses.
11.9 Cost to Drive
11.9 Cost to DriveAn important question to consider when purchasing a vehicle is how much it costs to drive. In general, cost to drive depends on two main factors:
- the price of fuel
- the fuel efficiency of the vehicle
For vehicles with internal combustion engines (ICEs), fuel efficiency is usually listed in miles per gallon (MPG). This information is provided by the manufacturer, but your actual fuel economy may be different depending on how and where you drive.
For example, driving in heavy traffic, making short trips, or driving aggressively can lower fuel efficiency.
Tips for Improving Fuel Efficiency
The U.S. Department of Energy provides several tips for improving fuel economy. Two of the most important are:
- Avoid rapid acceleration
- Avoid hard braking and speeding
These aggressive driving habits use more fuel and reduce efficiency. By driving more smoothly, some drivers can improve their fuel economy by about 10% to 40%. This is true for many types of vehicles and is one of the easiest ways to reduce fuel costs.
11.10 Future of Transportation
11.10 Future of TransportationTransportation is changing quickly. For more than a century, most cars, trucks, ships, and airplanes have depended on petroleum fuels such as gasoline, diesel, and jet fuel. Today, engineers, governments, and companies are working on new ways to move people and goods using less fuel and producing fewer emissions.
One important idea to remember is that the future of transportation is not just about cars. Passenger vehicles matter, but the transportation sector also includes trucks, buses, trains, ships, and airplanes. Each part of the system has different energy needs, so the future will likely include more than one solution.
Electric Vehicles
Electric vehicles, or EVs, are likely to be a major part of the future of transportation. EVs run on electricity stored in batteries, which means they do not burn gasoline or diesel in the vehicle itself.
Many countries are increasing EV adoption, but Norway has become one of the clearest examples of how quickly the transition can happen. In 2025, 95.9% of all new passenger cars registered in Norway were fully electric. In December 2025, the EV share of new car sales in Norway reached 97.6%.
Norway’s progress did not happen by accident. Long-term policies, charging infrastructure, and tax incentives helped make electric cars a practical choice for many drivers. Norway’s government has also connected transportation planning to larger climate goals and reductions in road-transport emissions.
Electrifying Trucks
Passenger cars are only one part of transportation. A large amount of energy is also used to move goods by truck. Because of this, the future of transportation also includes medium- and heavy-duty vehicles
Norway has set an especially ambitious goal for trucks. Reports on Norway’s policy state that, beginning in 2030, all new trucks are expected to be either zero-emission vehicles or vehicles powered by biogas. This is important because trucks are harder to electrify than passenger cars. Heavy trucks need large batteries, powerful charging equipment, and enough range to move cargo efficiently
At the same time, electric truck technology is improving. Governments and companies are investing in chargers, vehicle development, and demonstration projects to show that electric trucks can work in real-world settings
Sustainable Aviation Fuel
Air travel is one of the hardest parts of transportation to change because airplanes need fuels with high energy density. Batteries work well for many cars and buses, but they are much harder to use for large commercial aircraft over long distances.
Because of this, one important idea for the future of aviation is sustainable aviation fuel, often called SAF. The U.S. Department of Energy describes SAF as an aviation fuel made from biomass and waste resources that can provide performance like petroleum-based jet fuel. The Department of Energy also explains that SAF can be made from feedstocks such as corn grain, oil seeds, algae, fats, oils, greases, agricultural residues, forestry residues, and municipal solid waste
Mass Transit
Another major part of the future of transportation is mass transit. In many cases, the cleanest transportation option is not just changing the fuel in a vehicle but also moving more people at once.
Public transit already helps reduce carbon emissions by shifting some travel away from personal cars. Transit systems are also beginning to electrify their fleets. For example, the Massachusetts Bay Transportation Authority states that it plans to convert its entire bus fleet to battery-electric buses by 2040
Electric buses can lower greenhouse gas emissions compared with buses powered by fossil fuels, but transit agencies also face challenges. They need charging infrastructure, updated maintenance facilities, and operating plans that keep buses in service while batteries are charged. This shows that the future of transportation is not just about buying new vehicles. It also requires new infrastructure and planning.
High speed rail is very common in Europe and Asia and may some day have a role in the US. As we have seen, rail is the most efficient method for transporting people. Japan has been running high speed rail for over 50 years. The bullet train travels about 120 miles/hour transporting more than 400,000 people a day. Technology exists to get lots of people from place to place quickly and efficiently.
What is next in the future of transport is not entirely certain. New developments are constantly underway including drones for delivery and possibly human transport in congested cities.
Video: See the First-of-its-Kind 'Air Taxi' That's Set to Revolutionize Travel (4:08)
Transcript: See the First-of-its-Kind 'Air Taxi' That's Set to Revolutionize Travel
Sam Brock: You're looking at liftoff of an aircraft from the future. Except, it's primed to smash expectations in the present from San Francisco to New York to Osaka, Japan, where flight demos have already stoked a major buzz around this electric powered air taxi, created by California-based Jobi that combines a verticaled accent with a mid-air transition to fixed wing flying. All through six ultra-efficient motors.
It looks like a helicopter, it looks like a plane. What is it?
James Buddy Denham, Chief Test Pilot, Joby Aviation: Our lift systems all tilt forward within the cells. Now, he benefit of that, we look like a helicopter when we take off, but then we transition to wing-born flight.
Sam Brock: Lead demonstration test pilot Buddy Denim.
James Denham: 100%, you're looking at the future of aviation here.
Sam Brock: Took us around the plane he acknowledges gives off Jetson vibes. Even surprising ATC controllers on a recent test flight.
Air traffic controller 1: What is that thing?
Air traffic controller 2: It's a Joby.
Sam Brock: But rest assured, it is real.
Inside the aircraft, there's more than 50 different computers, all talking to one another. The pilot is still the conductor of this operation, but the computers are what's doing the heavy lifting.
James Denham: It's one of the first few airplanes in the history where the pilot controls are not hooked to a control service on the airplane. They go to the flight control computer. The pilot actually asks for exactly what he or she wants to fly.
Sam Brock: The company's CEO, Joe Ben Bevert, says the air taxi which holds up to four passengers and can fly around 140 miles per hour is not meant for the 1 percenters, but for any passengers looking for a ten-minute lift to the airport.
Joe Ben Bevert: In terms of the price point, our target is to be competitive with ground transportation over the time. The electric propulsion on our aircraft makes these aircraft dramatically more efficient.
Sam Brock: Joby acquired helicopter company Blade last year and in the process, acquired it infrastructure and routes, like this one from New York's JFK to the West Side Highway in the city. But there's a big difference in acoustic footprint.
With an electric motor, there's no roar of an engine like on this helicopter. According to Joby, the air taxis are 100 times quieter, so subtle that people on the ground aren't even going to hear it.
James Denham: We could have a conversation in a cafe, you would never hear the airplane come over.
Sam Brock: The FAA could grant approval in the coming year as part of a sweeping program in 12 states to streamline new technologies like these called EV-TOM.
Sean Duffey, U.S. Secretary of Transportation: It's going to give us different regional mobility. Where we live, where we work can fundamentally change with an EVITAL.
Sam Brock: The tech being explored by a number of companies that could be coming to a city near you.
Yoe Ben Bevert: This is a game changer for our industry. Very excited about rolling out service in New York, Florida, and Texas. This is a really exciting moment for the launch of this next mode of transportation.
Sam Brock: So many of you at home probably wondering, what's the range on these air taxis. Right now, it's about 100 miles. Perfect for back and forth to the airport. What they do is they charge it in intervals, as passengers are getting on and off, since the battery never gets low. Also, Joby has a partnership with Uber, which means you can theoretically, at some point, order either on your Uber or Joby app, get the ride to the heliport, take the air-taxi from the heliport to the airport. They call that seamless multi-modal.
Sounds like it could be a fantastic move here for consumers. We'll find out in a matter of months.
Savannah Guthrie: Well.
Sam Brock: Back to you guys.
Savannah Guthrie: We give that explanation five stars.
Carson Daily: He's selling me, he's selling me on it.
Savannah Guthrie: I mean.
Carson Daily: Joby bought Blade. Joby's got to deal with the Uber.
Savannah Guthrie: Yeah.
Carson Daily:Sounds like they are.
Savannah Guthrie: But won't all of the traffic then just move to the sky? You look up and it's all these...
Carson Daily: Eventually
Savannah Guthrie: I don't love that.
Craig Melvin: There's a lot more space up there.
Savannah Guthrie: But I love innovation.
Craig Melvin: Would you try it out? Would you do it?
Al Roker: Absolutely. Why not? Sure. I mean, at least once.
Craig Melvin: Okay.
Al Roker: I still haven't got into one of those Waymo's yet. So, I don't know, we'll see.
Hey, thanks for watching and don't forget you can catch the Today Show every morning on NBC or take Today when you're on the go, just foolloew the Today podcast on Apple Podcast, Spotify, or wherever you listen.
11.11 Conclusion
11.11 ConclusionTransportation is one of the largest energy-using sectors in the United States, and it affects nearly every part of daily life. People depend on transportation to travel to school, work, and stores, while businesses rely on it to move food, products, and raw materials. Because transportation is so important, understanding how it uses energy helps us better understand the larger energy system.
In this lesson, you learned that transportation includes much more than passenger cars. It also includes trucks, trains, ships, barges, buses, and airplanes. Each type of transportation has a different purpose, uses different amounts of energy, and may rely on different fuels or technologies.
You also explored how internal combustion engines work and why gasoline and diesel engines are different. Gasoline engines use spark ignition, while diesel engines use compression ignition. These engines have powered transportation for many years, but they still depend heavily on petroleum-based fuels.
At the same time, transportation is changing. Hybrid vehicles, plug-in hybrid vehicles, and electric vehicles are becoming more common. Other fuels, such as biodiesel, ethanol, natural gas, hydrogen, and propane, also provide alternatives in some situations. These technologies may help reduce petroleum use, lower some emissions, and improve efficiency, but each one also has limits related to cost, infrastructure, range, or fuel availability.
Another important idea from this lesson is that efficiency matters. Vehicle efficiency affects how much fuel is used, how much it costs to drive, and how much energy is required to move people or goods. Efficiency can be measured in different ways, such as miles per gallon, cost per mile, or energy use per passenger mile. The most efficient choice is not always just a different car—it may also involve moving more people at once through rail or public transit.
You also learned that the future of transportation will probably involve more than one solution. Passenger cars may continue shifting toward electricity, but trucks, aircraft, ships, and mass transit may use different technologies depending on their energy needs. Electric vehicles, sustainable aviation fuels, improved transit systems, and cleaner freight transportation are all likely to play a role.
Key Takeaways
- Transportation is a major part of U.S. energy use.
- Most transportation in the United States still depends on petroleum fuels such as gasoline, diesel, and jet fuel.
- Transportation includes cars, trucks, trains, ships, barges, buses, and aircraft.
- Gasoline and diesel engines work differently and use different types of fuel.
- Hybrid, plug-in hybrid, and electric vehicles are important parts of the changing transportation system.
- Alternative fuels can reduce petroleum use in some vehicles and fleets.
- Efficiency and cost to drive are important when comparing transportation choices.
- The future of transportation will likely include a mix of technologies, not just one single solution.
Final Thought
Transportation is not just about getting from one place to another. It is also about energy, technology, infrastructure, cost, and environmental impact. As transportation systems continue to change, understanding these connections will help you make better decisions as a driver, consumer, voter, and energy citizen.
Reflection Questions
- Why is transportation such an important topic in an energy class?
- What is the difference between gasoline, diesel, hybrid, and electric vehicles?
- Why might the future of transportation require more than one technology?
- How does vehicle efficiency affect the cost of driving?
- Which type of transportation do you think will change the most in the next 20 years, and why?
Lesson 12: Home Energy Audit - The Building Envelope
Lesson 12: Home Energy Audit - The Building EnvelopeThe links below provide an outline of the material for this lesson. Be sure to carefully read through the entire lesson before returning to Canvas to submit your assignments.
12.1 Lesson 12 Introduction
12.1 Lesson 12 IntroductionWelcome to Lesson 12
In this lesson we will learn what you might expect from a residential home energy audit. You will learn about what things you can do to help reduce your energy costs. In earlier lessons we learned about your electric use, and how to calculate your usage. In this lesson we will bring it together with your whole home energy use.
- Interactive Infographic: U.S. residential energy use breakdown (EIA data) with the End-use Consumption Shares by Type of U.S. Homes, 2015 infographic on this page. Use of energy explained: Energy use in homes
- Read the U.S. Department of Energy Energy Saver “Tips on Saving Money and Energy in your Home""
Learning Objectives
By completing this module, students will be able to:
- Explain how residential energy use connects to climate change, household budgets, and indoor comfort
- Identify the three primary pathways of energy loss in buildings (air leakage, insufficient insulation, inefficient equipment)
- Conduct a no-cost DIY energy audit of their current living space using household items
- Analyze a utility bill (real or sample) to establish energy consumption baselines
- Prioritize energy improvements using a simple cost-benefit framework
12.2 Do It Yourself Energy audit
12.2 Do It Yourself Energy auditEven if you don’t want to have a professional energy audit performed, you can still look for ways to save energy in your space. What things can you do to look for energy savings in your home?
1. Hunt for Air Leaks (Your #1 Priority)
Air leaks waste energy year-round—letting heated air escape in winter and cool air escape in summer.
Where to look:
- Around windows and doors (feel for drafts with your hand)
- Electrical outlets and switch plates on exterior walls
- Where pipes or wires enter walls (kitchen, bathroom, basement)
- Attic hatches and fireplace dampers
- Baseboards and crown molding gaps
DIY test: On a windy day, hold a lit incense stick near potential leak spots. If the smoke wavers, you've found a leak!
Quick fix: Apply weatherstripping to doors/windows and foam gaskets behind outlet covers ($5–$20 fixes that can save 10–20% on heating/cooling costs).
2. Check Your Insulation Levels
Poor insulation works against your HVAC system constantly.
Easy inspection spots:
- Attic: If you can see ceiling joists, you likely need more insulation (joists should be covered)
- Basement/crawlspace walls: Look for gaps or compressed insulation
- Exterior walls: Cold spots on interior walls during winter suggest missing insulation
3. Inspect Heating & Cooling Equipment
Your HVAC system works harder (and costs more) when poorly maintained.
Checklist:
- Air filters: Are they dusty/clogged? Replace every 1–3 months ($5–$15 filters)
- Thermostat placement: Is it near a draft, lamp, or sunny window? (False readings cause wasted energy)
- Ductwork: In basements/attics, look for disconnected or crushed ducts
- Programmable/smart thermostat: Can you set back temperatures when sleeping or away? (Saves ~10% annually)
4. Slay "Energy Vampires"
These devices drain power 24/7—even when "off." Anything with a light on it is consuming energy, even when it is off.
Common culprits in student/family homes:
- Phone/laptop chargers left plugged in
- Game consoles on standby
- Coffee makers with clocks
- TVs and sound systems with "instant-on" features
- Desktop computers not set to sleep mode
Action: Plug entertainment centers and chargers into a power strip. Flip the switch off when not in use, it could save you 5–10% on electricity bills.
5. Lighting & Appliances
- Light bulbs: Replace incandescent or CLF lighting with LEDs (use 75% less energy, last 25x longer)
- Refrigerator: Check door seals (close door on dollar bill, if you pull it out easily, seals need replacing)
- Water heater: Set to 120°F (not "hot"). Insulate hot water pipes in unheated spaces.
12.3 Tools of the Trade: Infrared Camera
12.3 Tools of the Trade: Infrared CameraImagine having X-ray vision for heat. That’s essentially what an infrared (IR) camera gives energy auditors. These specialized cameras detect infrared radiation—the heat energy emitted by all surfaces—and translate it into a visible image called a thermogram.
- Cooler areas appear blue/purple/black
- Warmer areas appear yellow/orange/red/white
This works best when there is a large temperature difference between inside and outside temps (at least 20oF). This allows the camera to show bigger contrasts.

Text description of the optical and thermal image.
The image shows a carpeted indoor stairway leading to a white-painted wooden door. The stair has dark brown carpet, and the adjoining walls and door are painted white. There is a significant contrast in temperature depicted through a thermal view inlay within a circular border, occupying the right side of the image. This thermal section shows the stair and door area in vibrant colors ranging from deep blue and purple to orange and yellow, indicating cooler and warmer areas respectively. The temperature readout in the thermal view shows 45.3°F.
What Thermography Reveals (With Real Examples)
- Missing or Settled Insulation
- What you see: Large cool patches on interior walls/ceilings in winter (warm patches in summer)
- Why it matters: Heat flows through the path of least resistance—uninsulated cavities become thermal highways
- Thermal Bridging (When conductive materials bypass insulation)
- Classic example: Steel studs in walls (steel conducts heat 300x better than wood!)
- In winter IR images: Vertical blue lines tracing every stud
- Real-world consequence: In one infamous Las Vegas case, cool steel studs caused smoke particles to plate out along every stud line, making the entire wall look like a barcode!
- Other bridges: Uninsulated concrete slabs, metal window frames, structural beams penetrating insulation layers
- Classic example: Steel studs in walls (steel conducts heat 300x better than wood!)
3. Air Leaks (Best seen with blower door testing)
- Without depressurization: Subtle temperature differences at leak sites
- With blower door: Dramatic black streaks appear where cold air is being sucked through gaps (windows, outlets, rim joists)
- Pro technique: Auditors first scan the building normally, then depressurize it with a blower door fan and scan again—comparing "before/after" reveals hidden leaks
12.4 Tools of the Trade: The Blower Door
12.4 Tools of the Trade: The Blower DoorHow Auditors Measure Your Home's "Leakiness"
What Is a Blower Door?
A blower door isn't a door at all, it's a calibrated fan system temporarily mounted in an exterior doorway that deliberately sucks air out of your house to create controlled negative pressure inside.

Text description of the Blower Door image.
The image shows a doorway that leads into a room. An open door is positioned on the left side. The entrance is obscured by a large red plastic barrier that acts as an air seal test setup. The large circular object at the base of the barrier is a blower, which is attached to the barrier for measuring air pressure. There is also a black control panel mounted next to the door, connected by wires, featuring buttons and a digital display.
The physics in action:
When the fan pulls air out, indoor pressure drops below outdoor pressure. Nature hates imbalance, so outdoor air immediately rushes in through every unsealed crack, gap, and hole in the building envelope. The leakier the house, the harder the fan must work to maintain the pressure difference.
Note: A blower door doesn't create leaks—it reveals them by exaggerating natural air movement 20–50x beyond normal conditions.
Why 50 Pascals? Understanding the Standard Test Pressure
Auditors don't just run the fan at random speed. They depressurize the house to a precise 50 Pascals (Pa)—roughly equivalent to a 20 mph wind blowing against all sides of the house simultaneously.
Why this number?
- Strong enough to overcome natural wind/stack effects during testing
- Standardized globally—allows comparison between homes
- Safe for the building structure (won't rip shingles off your roof!)
Video: Blower Door Test (5:34)
Transcript: Blower Door Test
Introduction to Testing
Matt Risinger: It's test day. We're verifying the air tightness of this new home.
[Upbeat music]
We're talking air tightness today and how to verify if the house you just completed actually met the air tightness goals. You know, this test is called a blower door test, and it's become a lot more important in recent years as the codes have changed and required this test.
How a Blower Door Works
Matt Risinger: I'm here with Sean from Positive Energy. Sean, you're here to test and find out how well this house did. Walk us through the basics of what you're doing today.
Sean Harris, Field Operations and Building Scienc Consutant, Positive Energy: Thanks, Matt. So, this is a blower door. It's basically a fan that has these calibrated plates on it, so I know how much airflow is moving through the fan. I then depressurize the house. You can pressurize or depressurize, but I depressurize the house to 50 pascals. And a pascal is a very, very small pressure difference. Think like a PSI on a car tire, but it's a fraction of that.
Matt Risinger: Gotcha.
Sean Harris: So that basically simulates 20 mph winds on all sides of the house at once.
Matt Risinger: So, in other words, we're depressurizing the house. We're going to be blowing out of this door. This is actually the door to the carport on this house. And so we're going to blow out and depressurize the house. Correct?
Sean Harris: Correct.
Matt Risinger: And then tell me about how you can find out how leaky the house is based on this fan's measurements.
Measuring Air Leakage
Sean Harris: Once I get to the 50 pascal pressure measurement, I know that because I've got a hose that's going to the outside that's measuring the pressure outside versus the pressure inside. And once that is stabilized, I can then look at my reading here, which I enter into this manometer with the ring size, and it tells me how much airflow is moving through the fan. And that airflow number, I can then use that and the volume of the home to determine how many air changes per hour happen.
Matt Risinger: Got it. So this fan is going to tell you a CFM number at 50 pascals of difference between the inside and out.
Calculating Air Changes
Matt Risinger: And then how do you translate that CFM number? So we actually ran the test a minute ago and we ended up about 2,100 CFM at 50 pascals. How does that translate back to a number that we can use based on code for ACH50?
Sean Harris: Yeah. So, I take the volume of the home, which in this case was about 63,000 cubic feet of air in this home, and I then look at the number of CFM that actually is coming out of the home. This is CFM, so it's cubic feet of air per minute. And the ACH number is an hourly number. So, I need to multiply the CFM by 60 to get the airflow per hour that goes out of the house.
Matt Risinger: Gotcha.
Sean Harris: Once I get that number, I then divide that into the volume of the home to determine the air changes per hour at the 50 Pascal test pressure.
Matt Risinger: Got it. So code nationally right now, based on the 2012 International Energy Conservation Code, is three air changes per hour at 50 pascals. How did we do on this one, Sean? What was my test?
Test Results and Analysis
Sean Harris: Matt, you actually scored a 1.9.
Matt Risinger: 1.9. That's good. So, just to remind you, code nationally is 3 ACH50 on the current 2012 codes. And here in Austin, I need to make a 5 ACH50. So I'm about 30% better than national code, over 60% better than the local codes. You know, I had to make a couple of compromises on this house, Sean, based on the architecture and the location. We're in a spot facing the lake. We have some giant, gorgeous views. We've got a couple of windows and doors that are a little more leaky than I would typically like to use, but I think a 1.9 is a really good score considering some of the compromises we made. And that's, of course, much better than is required in this area.
Diagnostic Benefits
Matt Risinger: Let's change gears a little bit and say if we would have had a higher score than code. What could that tell us about this house, and how could we use this as a diagnostic tool?
Sean Harris: The number one thing that I'm looking for is making sure that the trades did what you wanted them to do. One of the things I see that's often missed are the top plates where all the penetrations go through your top plate. Those things are not sealed and that can, you know, be death by a thousand cuts. It can lead to a lot of issues later on.
Matt Risinger: Tell me what you've seen in terms of bigger mistakes in houses that you've tested.
Sean Harris: Yeah, Matt. Sometimes I see where some trades needed to get into a part of an attic, and so they just go ahead and cut an access hole into the insulation and don't tell anybody. And now there's this four-foot by four-foot hole in your air barrier, your insulation barrier, everything.
Matt Risinger: Yeah, that's a really good point, Sean. And I think that this test can help you find not only the big mistakes, but as you run this test for many years like I have, it's allowed me to really hone it down. I'm really looking to get as close to 1 ACH50 as I can on my houses. And I really appreciate you testing this house and all my houses.
Sean, for more information, visit Positive Energy's website. They've got a great podcast where they talk about air sealing and HVAC systems, all kinds of things when it comes to testing. You can also visit my blog at MattRisinger.com. And, of course, I'd love to have you follow me on Instagram or Twitter. We'll see you next time on The Build Show.
[Upbeat music]
The Testing Procedure: Step by Step
Pre-Test Prep
Before the fan even turns on, the auditor must:
- Close all windows and exterior doors
- Open all interior doors (bedrooms, closets, bathrooms)
- Turn off HVAC systems, fireplaces, and exhaust fans (bath/kitchen)
- Close fireplace dampers and woodstove doors
- Cover dryer vents and kitchen range hoods (temporarily)
During the Test
- Mount the blower door frame in an exterior doorway (usually the main entry)
- Seal the frame edges with nylon panels to prevent bypass air
- Start the fan and gradually ramp up to 50 Pa depressurization
- Walk the house with smoke pencil/incense to visually locate leaks as air rushes in
- Optional but powerful: Pair with IR camera to photograph thermal patterns while depressurized (see connection below)
Post-Test
- Record CFM₅₀ and calculate ACH₅₀
- Generate leakage report with prioritized repair recommendations
- Retest after air sealing to verify improvement (typical goal: 20–40% reduction)
The Power Combo: Blower Door + Thermography
Remember our lesson on IR cameras? Alone, thermography shows where surfaces are cold—but can't distinguish between missing insulation, thermal bridging, or actual air leaks.
Enter the blower door:
When you depressurize the house while scanning with an IR camera, air leaks become dramatically visible as cold streaks being sucked through gaps:
| Scenario | IR Alone | IR + Blower Door |
|---|---|---|
| Electrical outlet on exterior wall | Slightly cool surface | Jet-black streak around outlet plate as cold air rushes in |
| Rim joist (foundation-to-wall joint) | Uniform cool band | Pinpoint cold spots revealing exact gap locations |
| Recessed can light | Warm spot on ceiling (heat escaping) | Cold air visibly streaming upward into attic |
Why This Matters to Homeowners (and Future You)
| Problem | Blower Door Reveals | Typical Savings After Fixing1 |
|---|---|---|
| Drafty windows/doors | Quantifies exact leakage contribution | $100–$300/year on heating bills |
| Unsealed attic hatches | Shows massive bypass around insulation | 10–15% reduction in heating load |
| Leaky recessed lights | Visualizes air streaming into attic | Prevents ice dams + saves energy |
| Missing sill plate sealant | Pinpoints foundation-to-wall gaps | Eliminates cold floors in winter |
1Energy Trust of Oregon has a nice page with information and tips to save money and energy.
Bigger picture: The U.S. DOE estimates that air sealing alone can reduce heating/cooling energy use by 15–30% in typical homes—making it one of the highest-return energy upgrades available. Air leakage tests are also done to confirm any sealing or insulation has been properly done. This may be a requirement for some tax credits or incentives.
12.5 Additional Tools of the Trade
12.5 Additional Tools of the TradeCombustion Analyzers
A combustion analyzer isn't optional equipment—it's a non-negotiable safety prerequisite. Before an auditor depressurizes your home with a blower door (which can reverse chimney draft), they must verify that fuel-burning appliances (furnaces, water heaters, boilers) aren't producing dangerous carbon monoxide (CO) or at risk of backdrafting flue gases into living spaces.
Combustion analyzers will detect O2, CO and CO2 levels to help determine if your appliance is operating efficiently and safely.
Beyond blower doors and combustion analyzers, auditors deploy specialized tools for specific investigations:
A manometer (precision pressure gauge) measures pressure differentials between ducts and living spaces to quantify duct leakage without full system pressurization;

Manometer Credit: Tosh Lubek. Adobe Stock. Accessed July 21, 2026.The Duct Blaster—a calibrated fan that seals directly to the air handler—provides definitive airtightness measurements for the entire duct system, revealing whether 20%, 40%, or even 60% of conditioned air escapes into attics or crawlspaces before reaching rooms.

Duct Blaster For safety-critical gas systems, a combustible gas detector scans appliance connections, valves, and piping for methane or propane leaks—addressing both explosion/fire hazards and wasted fuel that silently escapes 24/7.

Combustible Gas Detector Credit: Anetlanda. Adobe Stock. Accessed July 21, 2026.- To make invisible air movement tangible during inspections, a smoke pencil (or incense stick) releases a steady stream of vapor that bends, swirls, or accelerates when crossing leak paths—turning abstract pressure differences into visible evidence students can photograph and annotate.
- Finally, a digital camera or cell phone documents appliance nameplates (for efficiency ratings), installation flaws, insulation gaps, and pre/post repair conditions—creating a permanent visual record essential for reports, contractor bids, and verifying retrofit success.

Together, these tools transform subjective observations ("this room feels drafty") into quantifiable, actionable data.
12.6 Putting it all together: The Final Report to a Homeowner
12.6 Putting it all together: The Final Report to a HomeownerAfter completing a home energy audit, the homeowner receives a comprehensive report that synthesizes all collected data and translates it into actionable recommendations. This document serves as a roadmap for improving comfort, safety, and energy efficiency—prioritizing upgrades by cost-effectiveness and impact. Below are two illustrative examples.
Why this matters to you: Even without owning a home, these reports teach financial literacy. Understanding payback periods, benchmark comparisons, and tiered recommendations prepares you to evaluate any efficiency claim—from apartment upgrades to future home purchases. And those no-cost tips? They work in dorms and rentals today.
There are lots of different programs out there to help auditors create the reports. Some free ones include :
- Energy Star Portfolio Manager
- Home Energy Yard Stick (Energy Star)
- Google Energy Assessment
While there are countless paid tools out there as well! Companies often use a template or program to help them while they are doing their audit, which allows them to enter images or data directly into the report while they are in the process of performing the audit. This can allow the customer to receive the audit report almost immediately.
12.7 Working as an Energy Auditor
12.7 Working as an Energy AuditorWatching practitioners in action transforms abstract concepts into tangible careers. The videos below showcase real energy auditors at work—demonstrating the tools, communication skills, and problem-solving approaches you've studied. After viewing, you'll explore how these roles fit into a broader ecosystem of green building careers.
This DOE-produced overview walks through a complete residential audit—from initial homeowner interview to blower door testing and infrared imaging. As you watch, notice:
- How the auditor explains technical findings in plain language (e.g., translating CFM₅₀ numbers into "this is like leaving a window open year-round")
- The sequence of tests (why combustion safety comes before depressurization)
- How recommendations are prioritized by cost-effectiveness, not just technical possibility
Video: Energy 101: Home Energy Assessment (3:30)
Transcript: Energy 101: Home Energy Assessment
Introduction to Energy Auditing
Narrator: In any season a leaky home costs money. How do you stop it? It starts with a comprehensive home energy checkup. That’s a series of tests and inspections to find out where your house could be more efficient. The end goal is to save energy, save money and make your house more comfortable.
Installing energy-efficient lighting and appliances will help. So will creating a sealed barrier around your house, kind of like putting a blanket around the outside, minimizing the leaks. Upgrading your home to save energy can put anywhere from 5 to 30 percent of your energy bill back in your pocket.
Exterior and Attic Inspection
OK, to get a thorough home energy checkup, you’ll need some help from a professional. Look for a home energy technician, called an auditor, in your area.
Now, in this cold-weather evaluation, the auditor starts on the outside, looking for problems around walls, joints and under the eaves. If there’s not a tight fit, you’re losing energy and money. Next, the technician might head up to your attic to check for leaks in the top of your home barrier. That trap door could be a culprit, letting cold air pass into the house.
Insulation and Structural Checks
A big part of the checkup is determining how well the insulation insulates. Insulation should be correctly installed in between all areas of the house frame. That means it needs to be evenly applied and not just jammed in spaces. And of course, if the insulation has fallen down, it’s not working. Your energy auditor will inspect the holes where electrical lines pass through. If they’re not sealed, they’re leaking.
HVAC and Water Heater Analysis
Then it’s down to the basement. Your furnace and water heater could be wasting energy. The auditor will check to see how energy-efficient the furnace is. Furnaces generally lose efficiency as they get older, and it could cost you more to keep yours running than to replace it with a new one. Maybe all you need is a new filter. Some people haven’t changed their filter for months, even years. That gunk clogging the filter means your furnace has to work harder to heat your home. If the water heater is several years old, it may not be efficient, and if it isn’t insulated, it’s also losing energy.
Blowe Door Test Procedure
Now it’s on to the ductwork. The technician will inspect connections to make sure they make a tight fit. They have to be sealed to keep the warm air going where it’s supposed to go. If the screwdriver can go in the hole, it means one thing for sure: Money is going out.
Now for the blower door test. The energy auditor will close all the windows and doors and anything else that lets outside air in. This special fan will depressurize the home. The idea is to suck air out of the house, allowing outside air to rush into the home through all those openings you didn’t know about.
Infrared Thermal Imaging
OK, so with the windows and doors closed and the fan running, leaks are easy to spot with an infrared camera. In winter, the auditor will scan the interior of the home looking for cold air rushing in. Here, the darker the color, the worse it is. These black spots mean one big air leak. It’s an eye-opening experience.
Lighting and Final Report
For this house, the recessed lighting fixtures are big problems. The auditor will also take a look at the kind of light bulbs in those fixtures. If they’re incandescents, they’re using a lot of energy. Warm compact fluorescents are an energy-saving alternative.
So the home energy assessment reveals ways that energy escapes your home, costing you money. The good news is you’ll have a comprehensive home energy report showing which efficiency upgrades are right for you and where to stop those pesky leaks.
This field perspective highlights the human dimension of energy auditing—working with diverse homeowners, navigating tight crawlspaces and attics, and balancing technical accuracy with empathy. Pay attention to:
- The physical demands of the job (ladders, confined spaces, variable weather)
- How auditors document findings for contractors who will implement recommendations
- The blend of technical knowledge (building science) and soft skills (listening to homeowner concerns about drafts or high bills)
Video: A Day In the Life of an Energy Auditor | AEE & Empeq (2:20)
Transcript: A Day In the Life of an Energy Auditor | AEE & Empeq
[Music]
On-Screen Text: Here is a glimpse into the world of energy auditing! This engineer takes you through a day in the life of an energy auditor, showcasing the vital role she plays in optimizing energy efficiency.
Allison Muehe, Energy Engineer, Untility Advantage: My name is Allison Muehe. I am an energy engineer, and I'm a PE and mother of three under seven, so things are very busy. I work with Utility Advantage, and some of the best parts of my job are when I get to help the client realize that they can save money, they can save energy, and oftentimes improve their operations.
During a site visit, the primary reason we go is to get information. All the major energy-consuming equipment needs to be viewed. We take snapshots of the current conditions, we look at what the set points are, and we have to verify all the information. But you also have to interview people, understand really what the current situation is, what improvements are planned, and what they need.
I've been in this industry about 10 years now with energy efficiency and energy audits, and I've found that although I love pen and paper, it's much safer and easier to be holding a phone or a tablet. We've been using the EMPEQ Fast Site Survey tool. I can take a snapshot, record all of this data, and have it associated with the right piece of equipment. It saves me a ton of time when I get back to the office. I don't have to type up the specs or sort through pictures. It's all waiting for me when I log in.
Auditing is so important to meet our climate goals because it's the first step. It's the primary step you need to take in order to understand what's going on with your facility and the current conditions. If you really want to maximize reductions in your energy use, it's where you've got to start.
[Music]
On-Screen Text: It's evident that her expertise is a cornerstone in advancing the energy industry. Being a Certified Energy Auditor brings precision, insight, and a commitment to sutainability, ensuring that businesses and communities thrive while minimizing environmental impact.
Career Exploration: Map Your Pathway
After watching the video above, explore the Green Buildings Career Map—an interactive tool developed by the U.S. Department of Energy and industry partners that charts 55 careers across four sectors of the energy efficiency industry.
Your exploration task:
- Open the Residential & Multifamily Construction & Retrofitting section of the JOBS menu and click on Residential Energy / Auditor
- Review the information: typical salary ranges, education pathways, and advancement routes
- Note recognized certifications (e.g., BPI Building Analyst, RESNET HERS Rater)
- Go back to the Career Map and click on the Residential Energy/Auditor dot to see adjacent roles you could grow into:
- Lateral move: Certified Home Energy Rater/Assessor/Inspector
- Collects and analyzes building data and tests building functions to determine the energy performance/rating, safety, and durability of a home.
- Advancement: Building Performance Contractor
- Run businesses that design and install whole-house energy measures to increase the thermal performance of residential buildings, often with a specialization in blower door-guided air sealing and insulation of the building enclosure.
- Specialization: Indoor Environmental Health Specialist
- Assess a wide variety of commercial and industrial buildings to identify health and safety risks such as indoor air quality, environmental contaminants, and safety hazards and propose remediation measures.
- Lateral move: Certified Home Energy Rater/Assessor/Inspector
- Look at the Entry-Level (bottom three rows on the graphic) to identify positions you could pursue now while in college:
- Energy Efficiency Technician (residential or commercial)
- Insulation/Air Sealing Technicians
- Building Performance Installer
12.8 Conclusion
12.8 ConclusionYou now hold a powerful lens for seeing the invisible flows that shape our built environment: heat escaping through hidden gaps, air leaking from ducts buried in attics, combustion gases that demand respect, and thermal patterns that tell stories about how buildings actually perform versus how they were designed to perform. Whether you conduct a 30-minute DIY walkthrough with incense and a flashlight or deploy a $10,000 blower door/Infrared camera rig as a certified professional, the core mindset remains the same—curiosity paired with evidence.
Energy auditing bridges three critical domains often taught in isolation:
- Science (thermodynamics, fluid dynamics, building physics)
- Practical skill (diagnosis, measurement, prioritization)
- Human impact (lower bills for families, safer homes, reduced carbon emissions)
This convergence is why auditing isn't just a technical exercise—it's a form of advocacy. When you document a leaky attic hatch wasting $150/year, you're not just noting a defect; you're revealing a solvable injustice for a low-income household. When you catch a backdrafting water heater before it sickens a family, you're practicing public health. And when you help a homeowner cut fossil fuel use by 25%, you're contributing—tangibly—to climate solutions.
Your journey doesn't end here. Start small this semester:
- Audit your own living space using the DIY checklist
- Notice thermal patterns on windows during temperature swings
- Question why a room feels drafty instead of just turning up the thermostat
These habits sharpen the observational skills that separate exceptional auditors—and exceptional problem-solvers in any discipline. And should you choose to pursue certification (via BPI, RESNET, or state programs), you'll enter a growing field where demand for skilled auditors outpaces supply—especially as building electrification and efficiency mandates expand nationwide.