Module 7: Tsunami
Module 7: TsunamiIntroduction
Long-Wavelength Waves: Tsunamis or Harbor Waves.
There is nothing that epitomizes the sheer destructive force of nature than a tsunami. And these destructive events have caused extraordinary damage in coastal regions of the Indian and Pacific Oceans, and the Mediterranean. Tsunami have actually changed the course of history, as we will see! Tsunami are caused when large movements of the seafloor occur, suddenly displacing the water above them. As we will learn in this module, this movement can be caused by an earthquake, a volcanic eruption or a submarine landslide or avalanche.
Or even a meteorite collision! Possibly the largest tsunami Earth has ever experienced happened 66 million years ago in the Gulf of Mexico. This massive collision in the northern Yucatán peninsula of Mexico opened up a 180 km wide crater in a matter of minutes. Water rushed into the crater then quickly out again, creating a giant tsunami that may have been as big as 45 to 90 meters (150 to 300 feet) tall. The tsunami rapidly converged on the coast of Mexico and Texas, drowning out animals, possibly including dinosaurs, that were living near the ocean. Evidence for this tsunami comes from sedimentary rocks that are found at the time of the impact around the Gulf of Mexico. In fact, characteristic sedimentary deposits known as tsunamiites are evidence for ancient powerful tsunami, and we will explore some of these catastrophic events in this module.
More recent tsunamis have captured the imagination of historians. The cataclysmic eruption on the Greek Island of Santorini in 1600 BC triggered a tsunami that may have led to the end of the Minoan civilization on the island and the nearby island of Crete. And the collapse of the volcanic island of Krakatoa in 1883 caused an estimated 30,000 deaths on nearby Java. A tsunami around Puget Sound near Seattle in 1700 is a portent or warning of a massive event in the so-called Cascadia margin that threatens the citizens of Portland, Seattle, Vancouver, and Victoria.
The last 20 years have seen powerful tsunami that have caused massive destruction and staggering numbers of fatalities. The December 26th, 2004 Indian Ocean event, caused by a massive submarine earthquake which caused upward of 250,000 deaths in countries around the Indian Ocean really woke people up to the extreme danger of tsunami, and governments up to the need for forecasting and especially for the need for rapid warning systems. The similarities between hurricane storm surge which we learned about in Modules 5 and 6 and a tsunami include the devastation of a community, followed by recovery and rebuilding. But there are also great differences in the ways coastal communities prepare for the two kinds of events.
Video: Japan Tsunami | National Geographic (3:34)
Japan Tsunami | National Geographic
Man reporting: All across northern Japan, they felt it, a violent magnitude 9.0 earthquake on March 11, 2011. It was centered about 80 miles offshore, and tsunami warnings went up immediately. In coastal cities, people knew what to do next, run to higher ground. It's from these vantage points, on hills and in tall buildings, that incredible footage was captured. In Kesennuma, people retreated to a high-rise rooftop and could only watch in horror as tsunami waves inundated their city, knocking buildings into rubble and mixing into a kind of tsunami soup filled with vehicles, building parts, and contents. Seawater cascaded over sea walls and into cities. This video shows the water rushing over an 18-foot seawall in the Kamakshi city. The seawall here was the world's deepest and largest, but not enough for the magnitude of the March 11 disaster. It was the largest quake ever known in Japan and one of the five largest reported in the world. More than 28,000 people are confirmed dead or missing. When two tectonic plates pushed together under the sea, the resulting earthquake sends an enormous burst of energy up through the ocean, displacing enormous quantities of water. With the upward motion, a series of waves expands in all directions. In deep water, these waves travel fast - up to five hundred miles an hour - but only reach a height of a few feet. A passing ship might not even notice. But as the waves enter shallow waters, friction with the ocean floor lowers the wave speed but raises their height. This video is from a Japan Coast Guard ship confronting a tsunami wave in shallow water on March 11. And a rare view from the air, video of a tsunami wave approaching the shoreline. In Japan, some tsunami waves reached as far as 3 miles inland. Japan may be the most seismologically studied country in the world. And with more than 1,200 high-precision GPS stations, a geophysicist at the University of Alaska used the data to create a visualization of the March 11 quake. The waves of displacement that you see were moving as fast as 5 miles per second. In this photo, the ripples of tsunami waves are seen moving upstream in the Naka river at Hitachinaka city. New technology left an enormous amount of visual evidence for studying years to come, and can perhaps help us better understand the power of earthquakes and tsunamis and prevent loss of life in the future.


Unfortunately, tsunamis and the earthquakes that produce them are not readily predicted. The National Oceanographic and Atmospheric Administration (NOAA) in collaboration with international agencies are collaborating on ways to detect tsunami and strategies to notify people around the world of an event should one be detected. The goal is for future earthquakes to trigger sirens and radio warnings in close-by locations for immediate evacuation and guidance for locations further away for evacuation in the hours to come. Such warning systems have been in place in Japan for several decades because of the great tsunami risk. The March 11, 2011, Tohoku earthquake occurred on a part of the fault line that was not thought to be an immediate threat, but these warning systems saved thousands of lives. A variety of detection tools are used today by geoscientists to help detect these phenomena. We will learn later in the module about tools and the data they collect. However, detecting tsunamis was not always possible, and we still have limitations.
The greatest tsunami risk is in parts of the world that are seismically active. The four projection maps, shown below, show the areas of the globe that are most prone to tsunami generation (i.e., shown in red highlights). Most of these areas are identified as high risk for generating tsunamis because, not only are they plate boundary areas, they are also associated with subduction zones where two tectonic plates collide and one is pushed below another. These maps and information about simulating tsunami events for predicting their travel and impacts are from NOAA's Center for Tsunami Research.

In this module, we will learn about the range of processes that generate tsunami. We will study the wealth of data from the 2004 Indian Ocean and 2011 Tohoku events. And we will learn how warning systems work and places at greatest risk of tsunami in the future.
So sit back, relax, and prepare to be terrified!
Required Reading
If you haven't already, please take a few minutes to read this web article (USGS Circular 1187) titled: Surviving a Tsunami—Lessons from Chile, Hawaii, and Japan. The link provides some important details about tsunamis and some critical information items on how to survive an event if you are ever faced with the need to do so.
Goals and Objectives
Goals and Objectives- Students will continue to develop the fundamental geospatial skills and concepts needed to assess the coastal processes and hazards discussed in this course.
- Students will develop an understanding of the relationships between the hydrosphere and lithosphere that result in the development of tsunami.
- Students will consider the geology of tsunamis and their impacts on shorelines.
- Students will consider current shoreline processes in the context of coastal hazards and past and present evolution of coastline morphology.
Learning Objectives
By the end of this module, students should be able to:
- describe the geologic phenomena that lead to the occurrence of tsunamis;
- analyze case studies of how coastal systems are impacted by geologic hazards such as tsunamis;
Module 7 Roadmap
| Activity Type | Assignment |
|---|---|
| To Read | In addition to reading all of the required materials here on the course website, before you begin working through this module, please read the following required readings to build some required background knowledge on sea level rise predictions and future changes in storm intensity.
Extra readings are clearly noted throughout the module and can be pursued as your time and interest allow. |
| To Do |
|
Questions?
If you have any questions, please use the Canvas email tool to contact the instructor.
The Tsunami that Killed Dinosaurs!
The Tsunami that Killed Dinosaurs!Imagine for a moment that you are a dinosaur, 66 million years ago. You live in the lush coastal plains near where the modern city of Galveston, Texas was built in the future. Your life is filled with looking for food, you’re carnivorous, so you spend your days and nights scouting for food: mammals, small reptiles, even fish. You’ve been living in this neck of the woods for decades and nothing much perturbs you. You’re in charge of your destiny.
Then everything changed. It all happened very fast, you see a bright light in the sky to the east, a searing flash, and next, a boom that is the loudest sound you’d ever heard, so loud it deafens you (if it mattered, but sadly it doesn’t). The ground shakes violently: earthquakes almost never occur in these parts, and this is a magnitude 13, likely the largest quake Earth has ever felt! Your giant 50-foot-long frame is thrown to the ground, and you lie there stunned. Next, you are hit by searing heat, a giant fireball approaches from the ocean, skirting the water, wave after wave of heat burns your skin, and you roar in agony. But then you see it -- a giant wave coming also from the same direction -- you have seen storms before, even some hurricanes, but nothing like this. It’s a wall of water, some 90 meters high coming at you, there is nowhere to go, you begin to run towards the land, but it’s no good. After millions of years of dominance, it’s all over.


Well, of course, this is fiction, most dinosaurs were not drowned. Most likely died slowly because climate change that was a result of the impact hitting very volatile sedimentary rocks emitted a lot of climatically active gasses and soot, which cooled the planet by 25 degrees C for decades. Vegetation stopped growing, herbivores died off and ultimately so did you, the carnivorous dinosaurs. You didn’t drown, you slowly starved.

The tsunami part is true. The impact did generate a massive tsunami, and it was one of the largest waves Earth ever experienced. The asteroid that hit the Earth 66 million years ago was 8-10 km across and traveled from the northeast at a velocity of 20 kilometers per second which is 45,000 miles per hour, (!) causing the flash the dinosaurs observed. The collision was so violent it released an estimated 100 teratons of TNT, the equivalent of a billion nuclear bombs (the deafening sound and the earthquake). The collision released a blast wave and a fireball that incinerated vegetation along the coastlines of the Gulf of Mexico (the burning sensation). The colossal Chicxulub crater formed in a matter of minutes, in one of the most dramatic movements the Earth has ever experienced, rocks from depths of more than 20 km were excavated to the surface as a giant ring of mountains. The crater is what is known as multi-ringed, which means it is made of concentric faults that get progressively deeper towards the center.


The crater has a diameter of 200 km and a depth of about 1 km, a giant hole in the ground that slowly filled with seawater over a period of hours. This wasn’t a slow seeping in of water, it was a massive surge, huge waves of water entering the crater. The crater had numerous connections to the surrounding ocean for this water to surge in, and once the crater was filled, giant waves of water exited as a massive tsunami. There were several phases in tsunami development.
When the water rushes back in it forms a central plume (a giant splash) that collapses outwards causing tsunami, this is known as a rim wave tsunami, the first tsunami to form. This wave would travel outside the crater and be the first tsunami to hit the Texas coast. However, it was not the last. Imagine dropping a huge boulder into a bathtub filled with water. The rim wave tsunami forms from the initial big splash (the plume) when the boulder displaces the water. This wave will travel out to the edges of the bathtub and reflect off of it. That is what happened in the Chicxulub crater, the rim wave tsunami hit the shores of the Gulf of Mexico and caused numerous reflected tsunami. But that wasn’t the end. The crater was unstable, with massive piles of rubble all over the place, and giant landslides were occurring everywhere. In addition, the tsunami were so big that they themselves triggered landslides. As we will learn in this module, landslides also trigger tsunami. So there was total chaos that lasted for days, multiple tsunami of varying size going in and out of the crater. And once the tsunami waned and energy began to subside, seiche waves formed, these were waves that did not exit the crater. It took months for the energy to totally diminish. Watch these simulations here:
Video: Chicxulub Tsunami (4:07) (No audio.)
Chicxulub Tsunami
Text on video: Chicxulub Tsunami. 65 million years ago, an asteroid 10 km in diameter struck Mexico's Yucatan Peninsula. The asteroid and its 100 km diameter crater have the Mayan name Chicxulub...but you might know it as "The Asteroid that Killed the Dinosaurs". Let's turn back the clock. Geography was different then. 65 million years ago, Yucatan was under a shallow sea...Florida did not exist...and most of central North America sat at less than 175 m elevation. Important Facts: Impactor - ; Diameter = 10 km; Velocity = 20 km/s; Density = 2.5 gm/cm3 ; Energy = 2.6 x 10²³ J. Arriving at 40,000 miles per hour, the asteroid had the energy of 3 billion WW II era atomic bombs. Vertical Impact: Numbers = Wave Height in meters. Close in, tsunami waves reached about 100 m in height. Along the Mexican coast, the waves were 30-50 m. Some geologists suggest that the Chicxulub tsunami reached Chicago, Montana, or Canada. The simulation, however, predicts just 20-30 m waves in proto-USA. Perhaps the strike came at a low angle from the south? If so, it pushed bigger waves northward, but still, the tsunami falls short of legend. Fact is, the Chicxulub tsunami was restricted to ~100 m size because the impact struck in water ~100 m deep. Could impact-triggered landslides have generated the distant tsunami that geologists report? For now, suppose that the asteroid landed in deeper water a bit to the north. A deep water impact increases tsunami size by a factor of five. What if that happened today? Let's return to the present...and drop the rock. Several U.S. states would go missing. Over eons, asteroids of all sizes have hit Earth. Geological traces remain of some...but extinction-level asteroids like Chicxulub visit us perhaps once in 100 million years. That's small consolation for the dinosaurs, but it's good news for you and me.
We can study cores of rock drilled in the crater to learn about the tsunami. Tsunami deposits are also found all over the margin of the Gulf of Mexico in Texas, Alabama, Mississippi, and northern Mexico. Giant boulders deposited by landslides are found in Cuba. Seiche waves likely made it all the way up to North Dakota! The crater has been drilled, including by a rig in 2016, and cores tell us about the timing and the physics of the tsunami. Also, geologists have worked on rocks around the Gulf of Mexico and the Caribbean that provide information about the height of the wave and how far it extended inland. Some of these rocks are shown below.
So it was a really rough day for you the dinosaur, it was the end of an era, the Mesozoic, when you ruled, you may have been swept out to sea by that first rim wave tsunami, but in all likelihood, your relatives suffered a far slower demise.
Hawaiian Landslides and Potential Megatsunami
Hawaiian Landslides and Potential MegatsunamiPossibly the largest tsunamis ever experienced were triggered by massive landslides off the flanks of Hawaiian volcanoes. And these unstable areas will fail again in the future and trigger a massive tsunami that may devastate coastlines around the Pacific Ocean. It’s not a matter of if, it’s a matter of when.
Hawaiian volcanoes are some of the fastest-growing landforms in the world. The Pacific Plate is moving to the northwest over a massive plume of heat known as a “hot spot”. The plate is moving to the northwest at a rate of 10 cm per year and there is a clear age progression of volcanoes from older on Kauai the northwesternmost island to younger on the southeast flank of the Big Island, Hawaii. In fact, the active youngest flanks are those that have the potential to fail in the future, as we will see.
The evidence for landslides is super clear. Images made with sonar show pockmarked areas of seafloor littered with massive blocks of displaced material off the flanks of islands that show evidence for past failure.
The Nu’uanu slide lies off the northeast coast of the island of Oahu and is one of the largest landslides on Earth. The slide is 235 km wide and 35 km long and occurred 1 to 1.5 million years ago when nearly half of the Ko’olau volcano collapsed. One of the largest blocks in the slide is called the Tuscaloosa seamount, which is 30 km long by 17 km wide and 2 km high! The remaining part of the caldera shows a steep fault escarpment where the failure occurred. The Wailua slide off the north coast of Molokai lies close to the Nu’uanu slide and occurred 1.4 million years ago when the East Molokai volcano collapsed. The slide is 195 km long and 40 wide. The volume of material generated by these two slides must have caused massive tsunamis, or megatsunami, which models suggest were up to 100 m high on the coasts of the Hawaiian islands! One possible piece of evidence for tsunami is found on the island of Lanai, where blocks of coral are found 35 meters above sea level. Such corals could not have grown at these elevations and must have been delivered by tsunami. In all likelihood, tsunami generated by these events hit the west coast of the US and Canada, but there is no known record in these locations.
Hawaiian volcanoes grow, with lavas spreading out from the crater at rapid rates. GPS data show extremely fast motions of 10cm/year along the southeast flank of the Big Island of Hawaii, the youngest Hawaiian island. All eyes are on this margin where recent collapse formed the Hilina slide and current gradual movement is forming the Hilina slump. This coast is also where future flank collapse looks likely, and the arcuate cliffs of the Hilina Pali look like possible pre-collapse features.
This rapid motion has caused visible features in the Hawaiian landscape. The so-called Great Crack on the southwest rift zone of Kilauea is 6 miles long, 60 feet wide and 60 feet deep in places and is and highly visible in Google Earth. The crack is in no immediate danger of failing, but is a reminder that the rapidly accreting Hawaiian islands pose a unique tsunami hazard in the Pacific Ocean.
Santorini 1600 BC and the End of Minoan Civilization
Santorini 1600 BC and the End of Minoan CivilizationThe island of Santorini (also known as Thera) is widely considered the most dramatic Greek island and one of the most beautiful places in the world. White homes are plastered on the side of rugged hills and travel is by donkey. Once the island was a massive volcano that erupted numerous times, but with one final and fatal eruption about 1600BC (the exact number is argued). The steep hillsides on the island were produced during this giant eruption, with massive quantities of lava and ash erupting from a small cone in the middle of what is left of the island. Now the island is like a cut-off horse-shoe with the ocean on all sides and the cone in the middle.
There were several phases in the eruption, including both lava fountains and the generation of deadly and hot mixtures of ash and gas. These mixtures can flow at speeds of 300 kilometers per hour and are often sprayed up into the air as massive columns many kilometers high that can collapse. The collapse of these columns into the ocean is thought to be a process that can generate a massive tsunami, as we will see in the 1883 eruption of Krakatoa, and it is thought that several phases of the Santorini eruption did this. The volcano had originally been a typical mountain-like structure with steep sides. In the later stages of its history, as the magma chamber emptied out, the mountain basically collapsed into a wide crater known as a caldera. The final two stages of the 1600 BC eruption led to the collapse of the caldera, and it's filling up with seawater. The final dramatic collapse which formed the horseshoe-shaped ring of the modern Santorini also generated the well-known megatsunami.
The phases of the eruption are known from well-preserved, layered records of the eruption that are up to 7 meters (23 feet) thick on Santorini but also found at archaeological sites including the well-known ruins in Crete. The eruption was certainly disastrous for the late Minoan civilization on Santorini, but what about elsewhere? The one-thriving Minoan civilization on Crete collapsed around this time and there have been numerous theories about how this related to the eruption. Was it the ash that blanketed the island? A giant earthquake associated with the eruption? Or the massive tsunami?


The tsunami deposit is found all over the eastern Mediterranean, including in deep-sea cores and in northern Crete, western Turkey, and as far away as Israel. There is much debate about its size and impact, however. Simulations have a tough time generating a large tsunami. However, a discovery about ten years ago in Crete provides some clues. At the Palikastro archeological site on the northeast tip of the island, a fascinating layer contained the Santorini ash, broken up building stones, marine fossil shells including those of beach and open ocean organisms, pieces of ceramics and even bones. The distribution of this layer on the rugged shore and in the areas above it suggests that the maximum wave height was 35 meters high! However, the impact of that wave on the Minoans is still debated and unlikely to have been the sole cause of the end of this civilization.
Krakatoa 1883: West of Java!
Krakatoa 1883: West of Java!One of the first disaster movies ever made was about the giant tsunami of 1883 that was triggered during a massive eruption of the giant volcano, Krakatoa, about 20 miles (32 kilometers) from the islands of Java and Sumatra. The movie included a group of thieves and a group of good guys. They are on Java, getting ready to set sail to look for lost treasure. They see the volcanic eruption in the distance, feel the ground shake and the ocean recede, and know that a tsunami is coming. They have a decision to make: stay on land and get to high ground, or escape on a boat and ride the wave out at sea. So the good guys get in the boat, and the bad guys run for higher ground. The boat gets out to sea, where it is rocked by giant waves, but barely survives. The bad guys climb trees and are swept away by the waves. Justice is served! The movie ends.

Think about how inaccurate this storyline is for a minute. While the characters would have felt the earthquakes, the tsunami would have arrived in about THREE minutes (at 800 km/hour). So there would have been almost no time to stand around and make that fateful decision, and certainly not enough time to steer the ship out into open waters. And finally, the movie is infamous because Krakatoa is actually WEST of Java!
Krakatoa is a massive stratovolcano that lies between the islands of Java and Sumatra in the Sunda Strait. The volcano is still active today (it erupted in 2020) and rises out of the ocean with numerous small island cones. The 1883 eruption was by far the largest in its history and basically blew up the majority of the volcano. Eruptions began on May 20 of that year as documented by historic records, and these led up to the massive eruption that began on August 25 and lasted for two days. That eruption is what is known as a culminating eruption, where much of the volcano literally blows up, and, in the case of Krakatoa, all that was left was one flank of the volcano and a couple of small cones in its center. The sheer power of the eruption was caused by what is known as phreatic activity. Because the volcano was right next to the ocean, seawater seeped into the plumbing system, and, when heated, became steam.

The eruption was so powerful that it was heard in Perth in Australia, more than 3000 km away, and may have been the loudest sound heard in historic times. Ash from the eruption stayed elevated for months and caused spectacular sunsets around the world in places as far away as New York and Norway. The famous painting The Scream by Edvard Munch is thought to depict one of these dramatic sunsets. The global temperature dropped by 0.4 deg C in the year after the eruption, as a direct result of the emission of sulfur dioxide that blocked out solar radiation. Record rainfall occurred in California.

When Krakatoa erupted, it generated a massive column of ash, pumice, and gas that extended up to 27 km above the volcano. The collapse of these columns displaced several cubic kilometers of seawater, and this is thought to have been the trigger for the massive tsunami that caused so much destruction. Waves up to 46 meters high (120 feet) crashed onto coastal villages in Java and Sumatra and killed up to 36,000 people. The coastal areas are very flat, there was little warning (sorry, Hollywood!), and nowhere to escape.
The collapse of the column spread a massive cloud of hot ash and poisonous gas called a pyroclastic cloud or surge that basically burned and asphyxiated anyone in its path and caused at least 4000 fatalities on the islands of Sumatra and Selebesi. Large pieces of pumice landed around the region. There are reports of corpses washing up on volcanic pumice in Africa in the months after the eruption.
Sadly, the 1883 eruption was not the last time an eruption of Krakatoa caused massive fatalities. The Anak Krakatoa volcano violently erupted in December 2018 and triggered a tsunami that led to over 400 deaths and over 800 injuries on Java and Sumatra.

Video: Krakatoa volcano explodes: spectacular huge eruption two months before 2018 tsunami (0:54) (Video is not narrated.)
Krakatoa Volcano Explodes: Spectacular Huge Eruption Two Months Before 2018 Tsunami
Krakatoa East of Java was made in 1969, the first of many super wildly inaccurate disaster movies. In “Earthquake,” giant cracks opened in the ground in Los Angeles and swallowed people whole (including the bad guys!). Still worse, in “Volcano”, an eruption takes place in Los Angeles (there are no volcanoes even close to the city!). “Dante’s Peak” did a little bit better, at least it took place in a region where there are volcanoes, but imagine making a truck to be lava resistant so that the family pet can make his last-minute escape! And this is without the wildly inaccurate storm movies!
The 1883 Eruption of Krakatoa shows the devastation that a volcanic tsunami can cause. It was not nearly the largest eruption in the region, however. The eruption of Toba 75,000 years ago was many orders of magnitude more powerful and is thought to have caused more than 3 degrees of global cooling that lasted a number of years. Thick ash from this eruption is found all over the Indian Ocean, and a thin layer is found in Greenland ice cores. The Toba eruption must have generated a truly monstrous tsunami!
Canary Island Landslides and Potential Megatsunami
Canary Island Landslides and Potential MegatsunamiThe Canary Islands are a group of seven volcanic islands that lie 100 kilometers off the coast of Africa. These islands grew over a hotspot as in the Hawaiian islands and all but one has active volcanoes. The coastlines of the Canaries are characterized by massive, steep cliffs and there has long been speculation that these features formed by dramatic collapse. What makes this possibility super significant is the fact that this process could trigger massive tsunamis that could hit the coasts of Europe, the eastern seaboard of the US, and Antarctica. In fact, speculation is that giant blocks of limestone that weigh hundreds of tons meters above sea level in the Bahamas were delivered there by a megatsunami and the Canary Island landslides are a possible culprit. And more locally, tsunami deposits found in the Canary island suggest waves in the past over 150 meters high!
Cumbre Vieja is the main volcano on the island of La Palma and has erupted recently, causing large cracks to grow involving the significant motion of the western volcano flank. This has caused speculation that this flank could collapse. The flank has a volume of 1.5 trillion metric tons and models suggest that if it were to collapse it would generate a tsunami 1000 m high that would be 50 m when it arrived in Europe and along the eastern coast of the US. Because this scenario would be devastating to cities including New York, Boston, and Miami as well as coastal real estate in New Jersey, North and South Carolina, and Florida, it has been rigorously investigated by scientists.


Video: Megatsunami Scenario - La Palma Landslide (4:48)
Megatsunami Scenario - La Palma Landslide
Man narrating: A slide from this mountain could kill millions of people in Europe and along America's eastern seaboard. Some eminent scientists warn that it's purely a matter of time till it happens. This is the volcanic island of La Palma 700 miles off the northwest coast of Africa. It's a newborn baby island, barely past its 4 millionth birthday, created in the last stage of what geologists call the rock cycle. Volcanoes can form land in various ways. In Hawaii lava gently pours from vents in the ground to build up almost horizontal layers of new rock. But elsewhere, as here on La Palma, more violent eruptions build steep-sided cones with surrounding layers of thick ash.
Eruptions in the past 60 years have jolted this island to the core, creating a fault line - a crack you can walk through - along the island central spine 6,000 feet above the Atlantic Ocean. On the western side of the fault, the land fell 13 feet down then stopped. Geologists Bill McGuire and other scientists say gas pressures could build up in a future eruption and crack open the island along this fault line. They have traced the fault for at least nine miles along the island ridge. And they believe the fault is so long that when it cracks open five hundred billion tons of rock will slide thousands of feet down into the ocean.
Prof. Bill McGuire, University College London: So it's going to go during a future eruption, there's no doubt about that. The problem is eruptions occur sometimes every 20 years, sometimes every 200 years.
Narrator: McGuire paints a terrifying fantasy picture of what anyone standing on the top of the landslide would see and hear.
Prof. Bill McGuire: I don't know if anybody's heard the noise made by this amount of rocks sliding against another great chunk of rock, but I always imagined it as if there are a million fingers scraping down a blackboard.
Narrator: The slide will reach a speed of more than 220 miles per hour
Prof. Bill McGuire: So you'd be hurtling down the slope of the volcano. It would start to break up into smaller pieces as it entered the ocean but by then it would already have displaced something like half a mile of water, which would be towering above your head. And that would be probably the last thing you'd ever see. Spectacular way to die.
Narrator: McGuire believes the impact with the ocean will create a dome of water nearly 3,000 feet high.
Prof. Bill McGuire: This is a massive rock which is probably bigger than Manhattan Island and when it collapses it would generate oceanwide tsunami, which will be at least as devastating as those that struck the Indian Ocean.
Narrator: The vast amount of energy pumped into the ocean will create what one scientist has called a megatsunami. Tsunami waves racing out in all directions. Computer predictions suggests they could even travel 4,000 miles toward the eastern seaboard of the United States, losing some but not all of their power along the way.
Prof. Bill McGuire: That wave will travel all the way across the Atlantic Ocean to the east coast of North America, but the water itself won't move all the way across, the individual particles in the world would transmit the energy to one another. We can demonstrate that quite nicely on a pool table here, where the energy from this first ball I'm going to hit is transmitted through all the others to the last one.
Narrator: Just as energy moves from ball to ball, so the landslide energy transfers from water particle to water particle across the ocean. As the landslide's energy approaches the coast, it builds up into a massive wall of water. These deep reds and blues are computer predictions of waves 100 feet high and more.
Prof. Bill McGuire: The level of destruction is difficult to quantify, it is going to be enormous, there's no doubt about that. If people are still in the cities when the collapse occurs, you may be considering millions of casualties.
The hypothesis that Canary Island collapse generates megatsunami is not universally accepted. This skepticism arises from the fact that island collapse may not have been catastrophic, instead, occurring slowly in numerous discrete small events rather than a single giant collapse. Such a slow collapse would not generate a large tsunami. So what about the large Bahamian blocks? An alternative possibility is they were delivered there by a hurricane during a time 125,000 years ago when sea level was higher than it is today.
In summary, it does not appear that a devastating megatsunami generated in the Canary Islands is imminent. There is potential for collapse of the volcanic flanks on the islands but these events will likely be less dramatic than once feared and with waves only devastating on a local scale.
Investigating The Geology & Impacts of Recent Tsunamis
Investigating The Geology & Impacts of Recent TsunamisIn the discussion below, we will explore two case studies. The first is the Sumatran tsunami from 2004, which we will use to explore the geologic origin of tsunamis, how tsunamis are generated within the water column, how they travel, and the impacts that they have on shorelines. The second case study will spend time exploring the most recent large-scale tsunami and associated impacts in Japan. Please click the first case study below or in the menu to get started.
2004 Sumatran Earthquake
2004 Sumatran EarthquakeThe Boxing Day 2004 Earthquake: A Holiday's Worst Nightmare
It is an idyllic morning to be at the beach, the day after Christmas 2004, bright sunshine and balmy temperatures greet vacationers on the tropical island of Phuket in Thailand. Kids run in the waves and build sandcastles, and sunbathers relax. The ocean slowly recedes, exposing rocks below the low tide line and much further, and stranding fish. People venture way out to see this surprising phenomenon. The Earthquake off Sumatra occurred at about 7 AM local time, it was about 500 km away, and no one here felt shaking.
A few people had heard about it on TV, but no one put two and two together---the ocean often recedes as a tsunami approaches. A wave appears on the distant horizon, a bright white band on the ocean surface moving slowly toward the land. People stare at it, puzzled. Gradually, it dawns on some that the wave is dangerous, but others don’t realize it until it’s too late, especially those who had wandered out. The wave is moving really fast. The peaceful beach scene gradually becomes gripped by panic. People flee as fast as they can and run for higher ground. The wave quickly covers the beach and heads for the luxury beachfront hotels. Pools are covered, and beach chairs move around like tinker toys. People cling to trees or desperately clamber up to higher floors to escape the wave. Others have already rushed to higher ground inland. The scene at Phuket is similar to many other resorts in Thailand and Malaysia. The wave reached up to 6 meters or 20 feet high here. Up to 300 people lost their lives in Phuket, and many more were injured. But while there were places to escape to inland if you were fast enough, that was not an option in the Phi Phi islands, also in Thailand. The lovely beach there is backed by dramatic, steep limestone cliffs, and there are few hotels, just low-lying beach cottages. The tsunami was also up to 6 meters at Phi Phi, and as many as 4000 people died, though the total could be far higher.
The date couldn’t be worse for such an event to occur; with thousands of people on holiday in the region and with very few people working in government offices, it was a recipe for disaster. Tourists from all over the world were vacationing in seaside resorts in Thailand, Indonesia, India, and elsewhere. Unplugged as they were, it was next to impossible to inform them or the residents of the region of the impending hazard.
Banda Aceh, the capital of the Aceh province of Sumatra, was much closer to the earthquake epicenter, and people felt the shaking. However, they had very little time to do anything, and there were no warnings about what was to come. And to be effective, a warning would have had to have gone out immediately. About 20 minutes later, three successive waves arrived; the first wave was smaller, but the next two were so large that they reached as far as 4 km (2.5 miles) inland. The water was up to 12 m (40 feet) high in the city, and the impact was truly devastating. Houses were totally destroyed, and wreckage, cars, and anything else were carried inland on this massive, muddy wall of water and debris. Outside of the city, the wave was even higher, up to 30 meters (100 feet) high on the west coast of Aceh province, where it traveled 3 miles inland. The highest measured wave reached 51 meters (167 feet) on a hillside near Banda Aceh. A total of 167,000 people are known to have died in Banda Aceh, and many more were missing. The video shows footage of the devastating tsunami in Banda Aceh, followed by Phuket.


.svg)
Video: Boxing Day Tsunami 2004 Thailand (9:16) (This video has on-screen text, but is not narrated.)
Boxing Day Tsunami 2004 Thailand
Earthquake near Sumatra 26.12.2004 makes a gigantic tsunami. First, destroyed the coast of Indonesia. The second victim of the devastating phenomenon was the island of Sri Lanka. And now the Tsunami is steadily approaching the shallow Andaman Sea to nearby Thailand. Let’s take a look at the sequence of subsequent events in Thailand. Boxing Day: Tsunami 2004, Country by Country, Thailand. Although Thailand lies 3 times closer to the epicenter than the island of Sri Lanka, Thailand was hit by a tsunami 30 minutes later, approximately 2 hours after the underwater shock. (A red circle is drawn around the location of the epicenter of the 9.3 M Earthquake; arrows show the epicenter is 1056 miles from Sri Lanka and 310 miles from Thailand.) The wave was significantly slowed by the shallow Andaman Sea, which also determined its behavior. The wave was the first to hit the islands of Surin and Similan. On the islands, there was first a massive retreat of the ocean. The subsequent wave came at incredible speed in the form of a rapidly rising water surface. The islands were flooded up to one meter, but the tsunami seems to have flown around Similar Island and has not caused much damage. The sad story took place on the islands of Surin. Staff at a nearby hotel encouraged tourists to explore the exposed seabed. When a wave came, like a swift flood, people rejoiced with the surf. They had no idea they were bathing in a tsunami. When the flow of water intensified, the wave washed away many people into the high seas. The tsunami chose the first victims. Subsequently, the wave struck the coast of Khao-Lake, where it caused tremendous damage. The wave was preceded by a huge retreat of water a few miles back, revealing the seabed. People went to explore the exposed seabed and had no idea they had fallen into a deadly trap. Suddenly, a huge foamed water wall appeared on the horizon, making a thundering sound, like a storm approaching. The height of the racing water was 12 m (40 ft). The tsunami struck with great force all the resorts on the Khao Lak coast. The ruthless wave swept away all the people who could no longer escape from the sandy bottom and sinking sand. The tsunami was so destructive that there were no shots of the incoming tsunami from a tourist resort. However, in “The Impossible” movie, a tsunami coming to the resorts of Khao Lak was captured credibly. The movie tells the story of Henry Bennett’s family, which was broken up by a devastating tsunami. This incredible story of division and reunion really happened. Many families were not so lucky. The Khao Law area was themes affected area in Thailand. The highest recorded tsunami run-up in Thailand measured 19.6 m (64.3 ft) at Ban Thing Dap, on the southwest tip of Ko Phra Thong Island. The area lies north of Khao Lake and the damage was enormous. South of Khao Lak lies the island of Phuket, which was hit moments later. The tsunami here was smaller than in Khao Lake and came in two consecutive waves that would look like surf waves. The reason for the difference seems to have been caused by the local bathymetry off Phuket Island. The first wave was smaller and had a height of about 4m (13 ft) and quickly flooded tourist resorts. The second wave came in ten minutes and had a height of about 9m (30 ft). In the second part of the fourth episode, we will visit Phi Phi, Koh-Lanta, and other smaller islands.
Now let’s take a step back and understand the megathrust earthquake that generated the tsunami. Remember a megathrust earthquake is one that occurs in a subduction zone where one plate is descending under another. These types of motions tend to cause a lot of strain to build up and thus then produce massive amounts of energy when it is released, the fault ruptures, and the crust moves or slips. The slip can encompass the movement of massive areas and involve different motions on either side of the plate boundary. In terms of tsunami genesis, as we have learned, the critical part of the motion is that the megathrust often causes rapid upward motion of the crust (and downward motion in some areas). And, of course, these fault zones are almost all under the ocean.
The 26 December 2004 Sumatra Andaman Earthquake took place when the Indian Plate is subducting beneath the Sunda Plate, actually, a small microplate belonging to it, the Burma microplate.
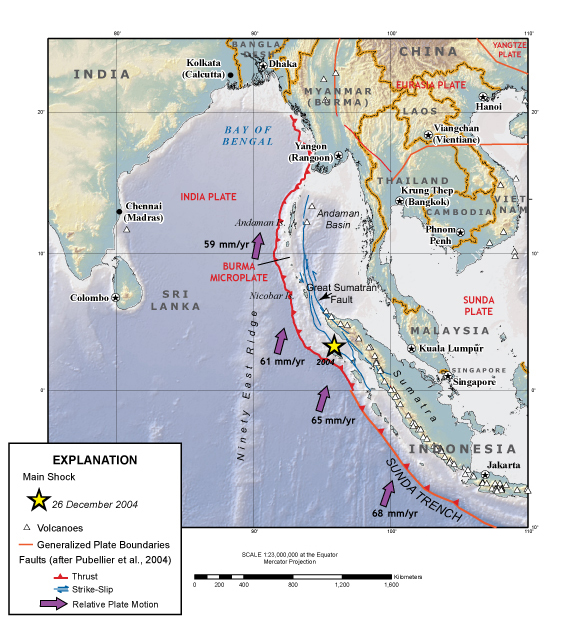
The earthquake was the third-largest quake ever measured with a magnitude of about 9.1. Two other notable elements of the quake were that it involved eight to ten minutes of shaking, which is a very long time compared to most quakes. The rupture took place in several stages with a total of 15 meters or 50 feet of movement over a length of 1500 km (900 miles), and the area of slip was truly massive, about the size of California (as seen in the image below).

The rupture actually involved a complex set of faults with some very rapid upward motion, which triggered the tsunami. The initial rupture occurred above the earthquake epicenter and then propagated to the north at a speed of 2km/sec or 1.2 m/sec (see image below). The fault that moved was up to 50 km (30 miles) deep, and the total amount of motion at the epicenter was about 20 meters or 65 feet. The megathrust motion caused the Burma microplate to move upward rapidly.

The upward motion was enough to make new islands. The animation below shows how the crust moved upwards in propagation from the south toward the north. It is very easy to see how this motion generated a tsunami. The second animation shows how tsunami waves spread out from the area of upward motion. You can see that the waves that hit Banda Aceh in the south of the map came from a different part of the plate boundary from those that hit Thailand in the north.


The earthquake was so large and the plate motion so significant that the 2004 Sumatra-Andaman earthquake is thought to have triggered other earthquakes in a process known as dynamic including the deadly 2008 Sichuan earthquake in China that killed 69,000 people.


Learning Check Point
After examining the diagrams and maps on the USGS’s Pacific Coastal and Marine Science Center website and watching the animation video of the modeled tsunami waves that were generated by the earthquake. Take some time to think about what you just learned, then consider how you would answer the questions on the cards below. Click "Turn" to see the correct answer on the reverse side of each card.
2011 Japanese Earthquake
2011 Japanese EarthquakeJust a few years after the 2004 event, another large-scale tsunami hit one of the most prepared and most technologically advanced countries in the world. The event occurred on March 11, 2011, when a massive 9.0 magnitude earthquake occurred off the eastern coast of Japan, one of the five largest quakes of the modern era. The quake occurred off the coast of the Tohoku region of Japan; hence it is called the Tohoku earthquake and tsunami.
The geologic context was nearly identical to the 2004 event in Sumatra. An eastward directed mega-thrust earthquake disturbed the seafloor. Even though the area disturbed was smaller than offshore Sumatra, it was still massive and had a similar energy release, and it generated a substantial tsunami that raced across the Pacific Ocean, and, most ominously, towards Japan. The Pacific plate to the east of Japan is moving westward under the North American Plate. Seismic data show that parts of the Pacific Plate moved westward by up to 40 m (130 feet) during the quake! The map below shows the amount of movement, known as slip, on the landward North American Plate, and you can see from the darkest red area, a huge region also moved 40 m (130 feet) in a matter of 2 or 3 minutes! The earthquake moved the island of Honshu 2.5 m (8 ft) to the east and shifted the whole Earth off its rotational axis by 10 to 25 cm! Parts of the Japan coast dropped by 0.6 m (2 ft), making the tsunami more devastating, and parts of the seafloor rose by 7 meters (23 feet)! The earthquake rupture mechanics are well known, with an initial speed of 1.5 km (about a mile) per second. So from those last two numbers, 7-meter motion and 1.5 km/sec, you can see how the quake generated a tsunami! The depth of the major quake was 30 km, but numerous aftershocks for various magnitudes occurred for two weeks after as you can see from the red dots in the map below.

The quake generated a tsunami wave that came ashore on the Japanese coastline less than an hour after the earthquake. The tsunami wave was detected about 25 minutes after the earthquake by a DART buoy. This model produced by NOAA’s Tsunami Research Center (NCTR) in Seattle, Washington shows the predicted path of the March 11, 2011, Honshu tsunami as it propagated around the Pacific.
The two videos below show terrifying up-close footage of the earthquake and tsunami:
Video: 2011/03/11 Great East Japan Earthquake, Tsunami (7:00) (Video is not narrated.)
2011/03/11 Great East Japan Earthquake, Tsunami
Video: Dramatic unseen footage of Japanese tsunami (3:24)
Dramatic Unseen Footage of Japanese Tsunami
Man translating in English while Japanese is being spoken in the background. The first time I realized a tsunami was going to hit, I actually saw it myself. I looked in my rearview mirror and saw an even larger wake.
Woman: Dramatic footage has emerged of the Japanese tsunami in March, shot by an onboard camera on a car belonging to (person's name). It shows the moment that waters flood a busy main road and the chaos that ensues. He lost
Man translating in English while Japanese is being spoken in the background: People were running out of their cars. I suppose that's the last thing. I think everybody was really panicking. It was incredibly quick. It probably only took about ten or twenty seconds from the point when the water hit my car to the car being washed away. At the time I thought I was going to die. It was kind of strange, but I didn't really feel panic myself. I was quite calm. I thought that's how things go, so I might as well do as much as I can. And I decided just to sit inside and wait. I thought that even if my car got swept up by the tsunami, I might land someplace, building, or whatever. I might be able to float to safety. I had it in my mind that I'd use the car to protect me as long as possible, that the car would float to somewhere safe and I'd jump out. Or if that was impossible, and the opportunity came, I'd jump out and float to safety. I think I didn't have to swim
Woman: Mr. Muruga managed to escape from the vehicle and fashion a makeshift raft from his possessions. After sheltering in a warehouse until the waters subsided, he later recovered his car and the tape.
Video: March 11, 2011, Honshu, Japan Tsunami Propagation (1:10) (Vidoe is not narrated.)
March 11, 2011, Honshu, Japan Tsunami Propogation
Check out NCTR Tohoku (East Coast of Honshu) Tsunami, March 11, 2011. Also on the site is a maximum wave amplitude model produced by the MOST tsunami model and a new narrated animation of the tsunami propagation and maximum amplitude model. Even more exciting is the fact that NCTR now has a Google Earth interface that provides users with access to datasets (tide data, DART buoy data, etc.) that record water levels in shallow water regions as well as out at sea in deep water where they present water column height (in meters above the seafloor). More on this later.
In any regard, as the length of the fault rupture was relatively small compared to the 2004 Sumatran event, wave propagation was more spherical, and although tsunami beaming occurred, seamounts and other submerged obstructions in the direction of the most prominent beaming direction (i.e., toward the southeast) helped to bend and refract the direct wave so that it lost some of its amplitude as it traveled toward Hawaii and South America. Data measured by tsunami buoys showed that the initial wave close to the fault observed a nearly 2m amplitude wave. As the wave moved toward the southeast, the amplitude subsided to less than a meter, likely as a result of interference as mentioned here. However, the beaming that focused toward the northwest meant that the full force of the direct wave was squarely on the island of Honshu. Given the orientation of the shoreline with numerous river valleys opening to the east and southeast (see below), the tsunami waves were funneled full force into shallow waters and up the progressively narrower valleys located up and down the coast of Honshu.
So, although much had been learned from the 2004 event, and although the tsunami warning system is more advanced and sophisticated and although it had helped to detect and measure the tsunami wave, unfortunately, the tsunami produced an incredible trail of destruction across northern Japan. As discussed, the Tohoku earthquake resulted in uplift and subsidence of portions of the seafloor in northern Japan and some of the shorelines subsided by 0.6 meters. The tsunami was a combination of 10-meter waves that led to wave run-up heights of almost 40 meters (over 120 feet) in some areas, and traveled inland through low-lying river systems at least 10 kilometers and caused over 500 square kilometers to be flooded.
Most coastal defenses were insufficient in preventing the destruction, as tsunami seawalls were overtopped or destroyed in many communities. Perhaps the tsunami warning system didn’t function as intended and notice didn’t reach the population. Perhaps the wave was generated so close to shore there was so little time. Perhaps a false sense of security was afforded by the coastal infrastructure built to protect the shoreline. Nevertheless, as a result of the 2011 tsunami, more than 15,000 people died when entire communities were wiped from their seaside locations. The vast majority died as a result of drowning. When you search the Internet, you will easily find tons of videos showing people desperately trying to move to high ground as the wall of water surges inland behind them. There are even videos of residents on the tops of taller buildings who thought they were safe, but who were also washed away. In addition to these frightening occurrences, the tsunami triggered a series of events that led to the failure of the Fukushima Daiichi nuclear power plant. When the plant failed, the nuclear meltdown led to the release of radioactive materials that ended up in the atmosphere and the Pacific Ocean. In addition to radioactive materials, the Japanese government suggested that more than five million tons of debris were washed out to sea as the surge waters retreated to the sea. As a result of these and other damages, estimates for damage topped 300 billion dollars in Japan alone, but real costs were far greater and continue to mount as a result of clean-up efforts and as a result of the environmental impact on fisheries and agricultural areas that supply food to the population. Tohoku's Six Minute Nightmare provides photos and video from the event that are incredible to look at and fundamentally demonstrate how destructive these events can be.
Required Viewing
If you haven't already, please look over the series of photos that you can swipe across to see the before and after-effects in a number of locations affected by the tsunami in Japan Earthquake: before and after.
Further away, there were also some noticeable impacts. An entire colony of nesting seabirds (in excess of 110,000 birds) was washed away on Midway Atoll. Relatively minor impacts were felt in Hawaii and along the West Coast of the U.S. The tsunami wave continued to travel over 17,000 km and came ashore in Chile where it produced a modest wave of about 2 meters, luckily occurring near low tide so the impact was minimal. Luckily, the tsunami warning systems went into place and no one was killed as a result. In Antarctica, the tsunami waves broke a number of icebergs off the Sulzberger Ice Shelf. The same event was even linked to a number of impacts in the fjords of Norway where waves nearly 2 meters in height sloshed back and forth around the fjords located along the Norwegian Sea in the northeastern part of the Atlantic Ocean. These waves, termed seiches, were terrifying for local residents and produced some minor damage, but no casualties. Other occurrences have been tentatively linked to either the earthquake or the tsunami wave.
The 1700 Cascadia Megathrust Earthquake and the Future of Cascadia Margin
The 1700 Cascadia Megathrust Earthquake and the Future of Cascadia MarginThe 1700 tsunami that impacted the Puget sound region was triggered by a megathrust earthquake off the coast of northern California, Oregon, Washington, and British Columbia on the so-called Cascadia margin. The event happened on the evening of January 26th as documented in Japanese historic records. In Japan, the event was called an “orphan” tsunami because the earthquake was so far away it was not felt. The other significant piece of evidence for the tsunami comes from dead trees in so-called “ghost” forests in Oregon and Washington that can be dated using carbon 14 and tree ring studies. These trees in lush coastal forests are thought to have been instantly killed by the saltwater when they were flooded initially by up to 12 m (36 feet) of land subsidence associated with the megathrust earthquake and then by the tsunami. The photo below shows the Neskowin Ghost Forest on the Oregon coast. We see many tree stumps sticking up above the sand at low tide. These trees were killed by a tsunami in 1700 when the elevation of the land fell, and they were completely inundated and then buried by sand. Large storms eroded the sand from the trees and exposed them. They remain as evidence of the huge tsunami more than 300 years ago.

Oral accounts from indigenous Native American and First Nation tribes living on the coast of Vancouver Island in Canada that have been passed down from generation to generation tell of an earthquake and tsunami on a winter’s evening. The accounts describe that all the low-lying settlements were wiped out and the only survivors were those people who lived 75 feet above the waterline. So the tsunami must have been massive!
Subsidence and tsunami records suggest that the earthquake was in the range of a magnitude 8.7-9.2 on the Richter scale. So what is a megathrust earthquake? It’s a very powerful quake usually close to or greater than a magnitude 9. These quakes occur at subduction zones where one plate is thrust under the other. When this happens the overriding plate moves upwards rapidly and this is what typically generates the tsunami. What is incredible about these events is the motion covers such massive areas. In the 2004 Indian Ocean event, an area 180 km wide and 1000 km long moved up by 30 meters! In the 2011 Tohoku event, an area 200 km long by 500 km wide moved up by 20 meters!
Back to Cascadia. The whole margin from Northern California to British Columbia lies about 200 km from the plate boundary where the Juan da Fuca Plate is sliding beneath the North American Plate. Paleoseismology, the exploration of evidence of ancient quakes from rocks, has become a cottage industry here and suggests that a major (i.e. megathrust) quake occurs every 500 years on average. So it’s been 300 years since the 1700 event and thus getting close to the time for another major event. The probability of such a massive quake in the next 50 years is about 12 percent, about 1 in 8, which is not insignificant.

Tectonics of the Cascadia margin
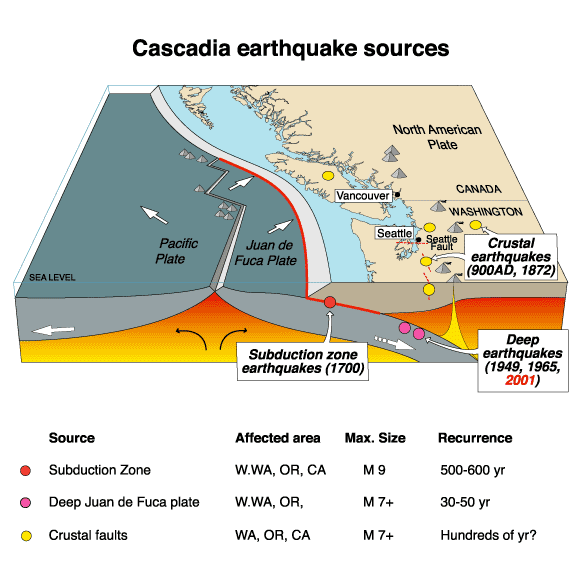
Cascadia earthquakes are triggered by the movement of North American and Juan de Fuca Plates and to a lesser degree the Pacific Plate. The motions cause shallow and deep earthquakes, some that have epicenters on the land and do not cause tsunami, and others that have epicenters in the ocean. These oceanic earthquakes, like the 1700 Megathrust Earthquake, have the potential to trigger large tsunami that arrive at the coast of Oregon and Washington in 15-20 minutes. This quake provides a warning for the future.
The map shows that there were crustal earthquakes in Washington in 900AD and 1982, deep earthquakes in 1949, 1965, and 2001, and a subduction zone earthquake in 1700. The following chart appears below the map:
| Source | Affected Area | Max. Size | Recurrence |
|---|---|---|---|
| Subduction Zone | W. WA, OR, CA | M9 | 500-600 yr |
| Deep Juan de Fuca plate | W. WA, OR | M7+ | 30-50 yr |
| Crustal faults | WA, OR, CA | M7+ | hundreds of yrs? |
This is the scenario that could play out on the Cascadia margin. A magnitude 9 earthquake rocks the plate boundary leading to a 1000 km long rupture including significant vertical displacement. This generates a tsunami that travels at 800 km/hour. Folks on the coast will feel the earthquake waves first with a magnitude between 7 and 8. This severe shaking will crumble older buildings with poor construction, collapse bridges, and cause landslides and soil liquefaction (when waterlogged soils behave like Jello---see images below from Alaska of the potential damage from liquefaction), stranding communities, and hampering relief. But everyone on the coast will know that the worst is yet to come and that they will need to evacuate as soon as the land stops shaking. The deformation that occurs along the plate boundary could cause land at the coast to sink by up to 6 feet (2m) making the coastal zone much more susceptible to flooding. The first tsunami wave will reach the coast from Victoria Island in Canada to Northern California in 15-20 minutes giving folks very little time to escape to higher ground. The waves could be 30-40 feet (9-12 m) in height when they hit the coast but some models suggest they could reach 100 feet (30 m), and in many parts of the coast they would flood up to 10 miles (16 km) inland. Some parts of the coast are a lot more vulnerable to tsunami inundation than others, and citizens in these locations will have to move to higher ground extremely rapidly once the earthquake waves subside. The waves will keep coming and since they have such long wavelengths it will take hours for the water to subside.
Earthquake Damages
Video: The Next Cascadia Earthquake: Worst-Case Scenario (8:07)
The following video describes the likely impact of a megathrust Cascadia earthquake.
The Next Cascadia Earthquake: Worst-Case Scenario
PRESENTER: On January 27th, 1700, Japanese chroniclers reported a mysterious wave, which struck the island of Honshu and caused widespread damage. The records referred to it as an orphan wave, because unlike most tsunamis on record, it had struck seemingly out of nowhere without being preceded by a detectable earthquake.
[MUSIC PLAYING]
About 12 hours earlier and more than 7,000 kilometers away on Vancouver Island, several villages of the Hesquiaht First Nation were completely destroyed while the inhabitants were sleeping. And 300 years later in 1986, paleontologists excavating along the Washington coast discovered a ghost forest of hundreds of trees that had all been killed by being suddenly submerged in saltwater. The orphan wave, the lost villages, and the ghost forest all had the same cause, a massive earthquake along the Cascadia subduction zone where the Juan de Fuca tectonic plate is being forced under the North American plate.
Further research has shown that there have been seven major earthquakes in the Cascadia subduction zone in the last 3,500 years with the time between major quakes ranging from 200 to 900 years. More than 300 years have passed since the quake of 1700, and the region has grown into an economic center home to more than 10 million people. We need to ask, what would happen if the next Cascadia earthquake happens tomorrow?
This is a worst-case scenario, and the odds of it happening in the near future are still quite low. It's been estimated at around a 12% chance in the next 50 years. But it's a real possibility. So let's imagine what would happen in the worst-case scenario for the next great Cascadia earthquake.
For this scenario, we're going to look at the impact of a magnitude 9.0 earthquake occurring on a weekday morning in late spring. Throughout the region, people are beginning their days. Students are arriving at school. And in the major cities of Vancouver, Victoria, Seattle, and Portland, businesses are gearing up for another normal workday. The major seaports and airports in the region will handle more than 200,000 passengers and $600 million worth of cargo by the end of the day.
At around 10:00 AM, after more than two centuries of building pressure, the Cascadia fault line finally slips and a 1,000-kilometer-long section of the North American plate moves 20 meters to the west, causing one of the largest earthquakes to strike the continent in more than half a century. Seismic waves race outward from the epicenter at 5 kilometers per second and reach the coast before moving inland. This means that people living far enough inland will start seeing posts about the earthquake on social media seconds before they feel the shaking start.
In order to understand the effect that the earthquake will have, we need to understand two different measurements-- magnitude and intensity. Magnitude is the measure of how much energy is released by an earthquake. A magnitude 9 earthquake like this one will release more than 2 exajoules of energy, equal to almost half a billion tons of TNT.
Intensity is a measure of how violent the shaking is at any given point. And here we actually get some good news. Since the epicenter of the quake is more than 100 kilometers off the coast, most cities will experience less violent shaking than other recent earthquakes. Here's an intensity map for the Northridge earthquake, which struck California in 1994, compared to an intensity map for a hypothetical magnitude 9.0 earthquake. The two big differences are that the Cascadia earthquake will be felt over a much wider area and it will last for much longer. The Northridge earthquake lasted for 20 seconds. The Cascadia earthquake will last for more than four minutes.
To get an idea of the impact that the quake will have, let's take a closer look at one of the largest cities in the area, Seattle, Washington, with a population of around 700,000. The intensity of the quake in this area is between a 6 and a 7 on the Mercalli intensity scale, which is associated with mild to moderate damage. Most of the large and recently built buildings in the city sustained fairly little damage.
Of greater concern is the 1,100 unreinforced masonry buildings in the city with more than 30,000 occupants. These buildings pre-date the current codes, and most of them haven't been retrofitted. Many of these buildings are prone to collapse. And those that don't collapse might cause injuries as a result of falling debris. Other risks facing the city include soil liquefaction, where areas of wet soil begin to behave like a liquid during an earthquake and cause damage to roads and foundations.
Thousands of landslides occur across the city, blocking roads and damaging buildings. Landslides, building collapses, and soil liquefaction occur throughout the Pacific Northwest. By the time the shaking stops, water, power, and cell service have been lost across most of the region. Nearly 1,000 highway bridges and overpasses have collapsed or are rendered unusable, cutting off-road access for dozens of communities. And the worst is still yet to come.
When the fault line slipped, it displaced billions of liters of water, creating a wave that begins to radiate outwards at 800 kilometers per hour. People living along the coast will have around 20 minutes to react. For those that have limited mobility or are cut off by damaged roads and bridges, options will be very limited. The height of a tsunami depends on the shape of the coastline. Because of the steep coasts in the region, the tsunami won't be as high as some other recent ones. However, at 10 to 15 meters, it's still high enough to completely inundate low-lying coastal communities and cause flooding up rivers more than 50 kilometers from the coast.
Over the next several hours, the wave will radiate outwards across the Pacific and cause damage as far away as Alaska, Hawaii, and Japan. Aftershocks continue possibly for months after the initial quake. Relief efforts are almost immediately mobilized from all levels of government, but they'll have their work cut out for them. It's immediately apparent that this has been one of the worst disasters to strike the continent in recent history.
Hundreds of thousands of buildings have been destroyed or damaged beyond repair. More than 100,000 people are left homeless, with many more being displaced. Up to 10,000 people might be killed. Around 70% of the deaths and injuries are a result of the tsunami, with the remainder being caused by collapsing buildings and falling debris. This would be the deadliest disaster to hit the United States or Canada in more than a century.
The cost is difficult to estimate, but the immediate cost could exceed $150 billion, making it one of the most expensive natural disasters in recorded history. The long-term economic impact could easily double that as the ports, airports, and corporations based in the area have their services interrupted for months.
Recovery is a long process. Efforts are focused on restoring essential services to population centers first. Seattle and Portland have their electricity and water fully restored after about six weeks. Meanwhile, the hardest-hit areas along the coast and isolated communities inland may be left without road access, utilities, and health care for up to three years after the quake. Thousands of the people who have been displaced may never return home.
The odds of this scenario occurring in the near future remain fairly low. But earthquakes are an inevitability, whether they happen a year from now or not for another century. So what's being done to prepare for this scenario? Funding has been allocated to bring thousands of vulnerable buildings, highways, and bridges up to code. But the process will take years or decades. Improvements have also been made to early warning systems.
With efforts from all levels of government and improvements to disaster preparedness and education, we have the best possible chance of preparing the Pacific Northwest for the next major earthquake. I've included links and resources in the description as well as links to the studies which were used to make this video. If you have ideas for future videos, leave a comment. And if you'd like to see more videos like this, click here to subscribe.
Such a disaster will happen along the Cascadia margin at some time in the future. The damage and impact will depend on the mechanics and location of the quake, the amount of coastal subsidence, the amount of damage by the earthquake, and the height of the tsunami waves. The good news is that public awareness is significant. There has been a lot of media attention, and local governments have been investing heavily in public safety projects.
Detecting Tsunamis: The US Tsunami Warning Center
Detecting Tsunamis: The US Tsunami Warning CenterVideo: NOAA Tsunami Forecasting (2:33)
NOAA Tsunami Forecasting
Today, in partnership with the USGS and NOAA, the US Tsunami Warning Center operates from Hawaii. The warning center was first created after WWII as a result of the 1946 Aleutian Island tsunami that originated between Alaska and Siberia. The tsunami produced incredibly destructive waves that traveled hundreds of miles to the south and resulted in the severe inundation of Hilo Bay, Hawaii and led to numerous deaths. Formerly initiated in 1949, the center expanded in the aftermath of the 1960 Chilean earthquake that not only destroyed many communities along the coast of Chile but also led to more destruction in Hawaii and even in Japan on the opposite side of the Pacific Ocean. With such severe long-distance impacts, it was clear that individual nations needed to collaborate in order to effectively save lives. As a result, efforts were initiated to coordinate monitoring around the Pacific, but even in 2004, the effectiveness of the center was limited as demonstrated by the 2004 Sumatran Tsunami that impacted much of the Indian Ocean. Although the earthquake and tsunami were detected from the Pacific, little could be done to monitor its progression in the Indian Ocean, and efforts were more or less futile in terms of issuing effective warnings to residents living around the Indian Ocean basin. As a result of that event, the center now coordinates with other tsunami warning centers in the U.S.and with the United Nations and similar agencies in several other countries including Japan, Australia, and others. These centers not only detect earthquake activity but also track the development and movement of tsunami waves as they travel across the world’s oceans. The main missions of these centers are to monitor and issue warnings, advisories, and watches to help reduce the loss of life associated with these events around the world.

The US Tsunami Warning Center is a great resource that provides details about specific events around the globe that are being monitored for tsunami generation. Australia and a few other countries maintain similar websites. It is worth spending a little bit of time exploring the types of tools and data that these agencies are collecting and monitoring to help keep the public as safe as possible from these types of catastrophes. It is, however, up to individuals and communities to be educated about tsunami risks and hazards and to act on the information provided in order to save lives. Individual communities are ultimately responsible for developing evacuation plans and limiting shoreline development, in especially susceptible areas. These topics will be explored in greater detail in later modules.
It’s clear that tsunamis pose an incredible threat to coastlines and societies around the world; but exactly what are tsunamis, how are they formed, and how do they interact with coastlines around the world? In order to answer these questions, we will explore two case studies. The first is the Sumatran Tsunami that occurred in December 2004, and the second is the 2011 Japanese Tsunami that devastated the island of Honshu, one of Japan’s main islands.
Module 7 Lab: Discussion
Module 7 Lab: DiscussionIn this lab, we will have a guided discussion about the impact of the March 11, 2011 tsunami on the landscape of northern Japan. We will do this by observing historical imagery on Google Earth and looking closely at images from before and after the tsunami. This is a great opportunity to study the extent and severity of the damage by the tsunami because there are many images from before and after the tsunami struck, the resolution is excellent, and there is only moderate cloud cover, so you can avoid it easily.
The goal of your observation is to determine what features you can use, both natural and human-made to determine: (a) how far inland the tsunami traveled in two different regions, and (b) how severe the damage was. As in Module 1, what I am looking for is original, thoughtful input as well as engagement in discussing other students’ ideas. First I will describe what you will need to do in Google Earth and then how you will input your ideas in the Discussion Forum.
Google Earth Observations
Open Google Earth and enter one or more of the following names in the search field:
1A. Minamisoma, Fukushima, Japan
1B. Iwaki, Fukushima, Japan
2A. Watari, Miyagi, Japan
2B. Miyagi, Japan
We will be looking at two regions, between Minamisoma and Iwaki in Fukushima Prefecture, and between Watari and Miyagi in Miyagi Prefecture.
We will be looking at features in these two locations and comparing them. It is recommended that you start observing at an elevation of 15,000 feet (4.5 km), but be ready to zoom in closer when you see something interesting. Next, turn on the historical imagery button on the upper toolbar (the clock). Look closely at images before March 11, 2011, and after. There are numerous images of the days after the tsunami struck, and you may need to look at several days to avoid clouds, breaks in the image, and darkness. It’s also easiest to start near the coast and move inland. Look at natural features as well as structures and vehicles, and notice changes between pre- and post-tsunami images.
Discussion
- Use Word or another text editor to respond to the prompt with your thoughts backed up with locations from Google Earth (Lat. Long coordinates and elevation - record as best as you can). The length of your response should be between 150 and 200 words. Pick one specific area in each prefecture (at least 2 places total) that was impacted by the tsunami. Compare the appearance of locations before and after the tsunami. Your response must include at least one location in each of the two prefectures (a total of two minimum). Look for natural features such as rivers, shorelines, forested areas, etc., to analyze the impact of flooding. Look for human-made features such as roads, houses, businesses, ports, agricultural fields, farms, etc., to analyze the impact of flooding. Be sure to write the coordinates of the places and note the distance from the coastline to discuss how far inland the tsunami waves traveled. Do you notice differences between the two prefectures? We recommend typing your response in Word or another text editor and then copying/pasting it to the discussion forum to avoid losing your work midstream in the event of an accidental browser closing, intermittent Internet connectivity, etc.).
- Go to Module 7 Lab (Discussion) and type or copy/paste your response to the prompt into the text box marked 'reply' and select Post Reply by 11:59 p.m. on Thursday to allow time for responses. Your response is now visible to your classmates and your instructor.
- Read through others’ responses and write a thoughtful reply to at least two other students by the date listed on the calendar. These replies should be either a rebuttal in which you add your ideas in the form of a persuasive argument (written with respect for the originating author) or a response that agrees with, supports, and builds upon the original response. Because a timely response to the conversation is part of your grade, subscribing to the forum is required. Check in to the discussion forum often throughout the week to post and respond to comments. Your response to at least one other classmate should be posted by 11:59 p.m. on Sunday to allow for authentic discussion.
 Statement of Use of AI on Exams, Quizzes, and Labs
Grading
The grading rubric will help you understand what constitutes an appropriate level of participation on your part. The instructor reserves the right not to award any credit (including points for timing and interaction) if the content of the posts (however on-time they may be) is off-topic, offensive, or otherwise inappropriate. Such posts may be deleted at any time by the instructor.
| Content | Addresses all facets of the assigned discussion prompt, with accurate supporting detail where necessary. A response post is at least 200 words of substantive content addressing the prompt. To earn full credit in this category, your comments and replies to classmates must demonstrate thoughtful consideration of the topic and go well beyond, "I agree with you." While a discussion forum has an informal tone, please refrain from foul or offensive language, texting abbreviations, etc. |
|
|---|---|---|
| Posts should be appropriately complemented with exact coordinates that show relevant features. Specifically, features that suggest recent tsunami inundation (and others that suggest the land remained dry). You need to show examples of natural and human-made structures to get full credit. It is key that your first post shows original locations that are different from ones suggested by your classmates (it will be hard to avoid some overlap by chance, but plagiarized entries will lose credit). |
|
| Timing | This assignment is deliberately structured to allow you to participate throughout the week. Your initial response to the statement should be shared by 11:59 p.m. on Thursday and your response to at least two other classmates by 11:59 p.m. on Sunday to allow for authentic discussion to occur. | 2 points |
Summary and Final Tasks
Summary and Final TasksAs you have learned first-hand from the data presented here, tsunamis have the capacity to flood low-lying coastlines and can push waves of water inland for hundreds of meters, if not several kilometers, under the right geographic conditions. In the images studied on the website and historical imagery on Google Earth, it is easy to see how far inland the tsunami impacted.
By studying a case example like this catastrophic event, geoscientists collect incredibly important information that is absolutely critical in helping to develop plans for mitigating and or adapting to similar events that will occur in the future. Unfortunately, the findings often don’t get to people on the ground until years, if not decades, after such events – sometimes, after rebuilding has taken place. You may have noticed in the reading that large tsunamis are relatively infrequent with some happening decades apart; however, you may have also seen where they can also be more frequent as in the case of the 1960 Chile and the 1964 Alaskan events, or the 2004 Sumatra, the 2005 Sumatra, and the 2007 Sumatra earthquakes. Suffice it to say that it is critical that the general public becomes educated on the topic. Moreover, it is also important for government agencies and political leaders to act on these data and become active in the process of helping to protect life, resources, and infrastructure in new and creative ways, so we can avoid such catastrophic loss of life in the future. Hopefully, the materials covered here will lead you to an understanding of the complexities of providing communities with early warnings to protect lives and property.
Tsunamis are unpredictable, and because of their unpredictable nature, tsunamis are incredibly damaging when they occur and are very challenging to mitigate and adapt to even in the most technologically advanced countries of the world. Imagine, if one of the world’s most technologically centered societies can be rocked to its core by an event of this magnitude, what can and will happen in the future in countries like the U.S. when we are impacted again? Will our outcome be similar to or possibly even worse than the event that impacted Japan? For much of the U.S. population, the risks are perceived to be relatively low because of the minimal plate tectonic activity along the eastern seaboard in the Atlantic. However, geoscientists are still concerned about a number of high-risk areas, including the Cascadia region of the Northwest coast. What do you know about risks for tsunamis in the area that you live, vacation, or are interested in studying?
For additional Information
Japan Earthquake & Tsunami of 2011: Facts and Information
Final Tasks
Reminder - Complete all of the Module 7 tasks!
You have reached the end of Module 7! Double-check the Module 7 Roadmap to make sure you have completed all of the activities listed there before you begin Module 8.