Module 1: Societies and Economics of Coastal Regions
Module 1: Societies and Economics of Coastal RegionsIntroduction
Each year brings new and bigger disasters to coastal communities around the world. Summer 2017 brought Harvey to Houston, Irma to the Caribbean and Florida, and Maria to the Caribbean. Summer 2018 brought us Hurricane Michael to the Florida Panhandle coast and Hurricane Florence to North Carolina, with devastating results. Not to be outdone, the Summer of 2019 brought Hurricane Dorian, which wreaked havoc in the Bahamas. The summer of 2022 brought Ian to southwest Florida. Each of these recent storms had unique effects on hundreds of communities, large and small, many of which are still struggling to recover. Looking back further in time, Hurricane Katrina (2005), Superstorm Sandy (2012), Super Typhoon Haiyan (2013), the Tsunami of Christmas (2004), and the Japanese Tsunami of 2011, all grabbed the world's attention. We all see images on our screens of the devastation and misery that result from these natural disasters. The ready accessibility of worldwide information on social media means we all have a certain level of knowledge about these disasters. However, coastal flooding is not limited to these notable storm effects. Communities around the world are dealing with quieter, yet still destructive, flooding caused by ongoing sea level rise. You may have heard about sunny day flooding in Miami, FL, and Annapolis, MD. These are just two examples of communities dealing with more frequent flooding related to sea level rise. What is it like to live in a city that is highly vulnerable to coastal flooding, and what kinds of actions are people taking to protect themselves? This first module will introduce you to a few of the most vulnerable coastal cities and communities around the world through exploration via Google Earth. We will begin to consider why certain places are more vulnerable than others.


The dramatic examples above underscore the vulnerability* of some of the world’s major cities and many smaller communities. Each catastrophic event involved the inundation of large, densely populated areas – killing hundreds to thousands of people, flooding houses, businesses, schools, and hospitals, and crippling infrastructure. Many years are spent in recovery, during which time the media often turns its attention elsewhere.
Superstorm Sandy may have been the event that finally woke up enough people to bring to the forefront the conversation about addressing the pressing issues of the increasing level of coastal flood risks faced by major metropolitan areas around the world.
* "Vulnerability" is used loosely here. Later in the course, "vulnerability" will be used in a more specific way.
Some questions we will begin to explore in Modules 1-3 and continue to explore in later modules are:
- What are the underlying causes that make a community more or less vulnerable to these types of damaging events?
- Will disasters like Super Storm Sandy and Hurricane Katrina become more frequent?
- What can communities do to avoid future devastation and protect their residents?
- How do communities respond to more frequent flooding due to sea level rise?
Module 1 of this course will begin to explore these questions. You will use Google Earth and other sources to investigate the details of several coastal cities considered to be particularly vulnerable and begin to develop your own answers to the question posed above.
The modules that follow will introduce factors related to the geologic processes that have formed our coasts, as well as the geomorphology and ecology of coastal areas that contribute to the level of vulnerability of a location. The engineering solutions to the hazards will be considered, as will the ways societies can work to become more resilient to coastal hazards. The social science concepts of vulnerability will be explored further to provide a more complete picture of both hazards and hazard mitigation in coastal regions globally.
Goals and Objectives
Goals and ObjectivesLearning Objectives
By the end of this module, students should be able to:
- analyze real-world data on the global distribution of cities identified as most vulnerable to coastal flooding;
- consider the multiple variables that determine the ranking of these cities in the present and future; and
- use geospatial skills with Google Earth to explore and compile data for a variety of coastal communities at risk from coastal flooding.
Module 1 Roadmap
| Activity Type | Assignment |
|---|---|
| To Read | In addition to reading all of the required materials here on the course website, before you begin working through this module, please listen to/read the following required readings to build some required background knowledge on sea level rise predictions and future changes in storm intensity.
Note: Extra readings are clearly indicated throughout the module and can be pursued as your time and interest allow. |
| To Do |
Note: All submissions are made in your course management system. |
Questions?
If you have any questions, please use the Canvas email tool to contact the instructor.
Our Increasingly Urbanized Coasts and Sea Level
Our Increasingly Urbanized Coasts and Sea LevelCurrently, more than 10% of the world’s population (currently estimated at 634 million and growing) lives on land that is within 10 meters in elevation from sea level. Some of the world’s most populated regions lie within this elevation range. Another way to view this is that 75% of the world's cities are on a coast. Coastal communities in the U.S. are home to 123 million people. In many regions of the world, migration to coastal population centers is occurring at a rapid pace. These low-lying cities include London, New York, Miami, and Tokyo, as well as Mumbai in India, and the rapidly growing megalopolis of Guangzhou in China, and other large cities we may rarely think about. Numerous smaller, little-known communities are equally precariously located but come into sudden focus when a disaster strikes. Tacloban in the Philippines, which was devastated by Super Typhoon Haiyan in 2013, is a good example. Meanwhile, low-lying U.S. cities, such as Boston, Miami, and New York, all face a future that will require adaptation to more frequent flooding from the ocean.
We know that while populations have increased in coastal cities, Earth's sea level has also been rising at an increased pace. These two factors have contributed to an increased probability of inundation of coastal communities by storm surges, high tides, and other events. The measured global sea level rise has been well documented using worldwide tide gauge and satellite altimeter data. This shows that during the 20th century, the global sea level rose at an increasing rate. Between 1880 and 2011, this rate was 0.07 inches (0.18 cm) per year. Between 1993 and 2011, the rate increased to 0.11 inches (0.28 cm) per year. This represents a 64% increase (US EPA). These seemingly small increments add up: sea level has risen by approximately 5 to 8 inches (13-20 centimeters) since 1900. The latest information shows that the rate of rise continues to accelerate: NASA Global Climate Change: Sea Level Latest Data (This is a very cool data portal, and we highly recommend you look at it!)
The most recent sea level rise projections from the Intergovernmental Panel on Climate Change indicate that sea levels could continue to rise another 39 inches (approximately 1 meter) by the end of this century. This may not seem like a huge amount, but communities that are currently at an elevation close to sea level are already seeing increased flooding, and this problem will continue to get worse over the next few decades, so it is no longer just a nuisance but a major issue to be tackled. There is a great deal of uncertainty in predictions of future sea level rise, so this also must be taken into account when considering the future of our coastal cities.

These rates are global averages and, in fact, sea level change varies greatly from place to place around the globe. Above is a data plot from the tide gauge at The Battery in southern Manhattan, NY, with mean sea level in meters plotted over time from 1850 to 2010 (and average rates in millimeters rise per year).
If subsidence (sinking of the land level) is factored in, a location’s relative sea level rise can be much higher than the global average. This is illustrated by comparing the tide gauge data for The Battery with that of Grand Isle, LA. (below), where subsidence of the Mississippi River Delta sediment exacerbates sea level rise rates considerably – a difference in sea level rise of 6.47 mm/year between these two locations! We will explore these ideas further in later modules.

Sea Level Rise: The Uncertainty of Predicting Future Sea Levels
The following modules will explore in detail sea level changes in relation to coastal processes and hazards, and their impacts on coastal communities. Here in Module 1, we will touch on the topic of sea level rise. Our goal is to examine coastal cities globally and consider the hazards presented by sea level rise. You will learn about some of the controversies surrounding the prediction of future sea levels. The links we have provided will help explain how the predictions are made. The sea level rise predictions used – now given to be approximately 1 meter by the year 2100 – were made using computer modeling. The models run by different groups have provided a range of predictions, underlining the complexity of predicting future sea levels. This is an issue that is the focus of intense research. Quantifying the contribution of the melting of the polar (Greenland and Antarctic) ice sheets to sea level rise has been a source of uncertainty as scientists worked to unravel the mechanisms at work. Scientists are now more confident in determining the contribution of the water flowing from the ice sheets, but it seems that the projected sea level rise rate increases as more is understood about the fate of the ice sheets. However, current research has given coastal managers an estimate of a 1-meter rise by 2100 to use in their planning for the protection of coastal communities in this century.
Storm Frequency and Intensity
Another factor that impacts the coastal hazard risks experienced by coastal communities is storm frequency and intensity. The International Panel on Climate Change reports that predictive modeling suggests that storms could become more intense in the future. However, the frequency of storms may actually decrease. This quote from IPCC Climate Change, 2007, sums up the evidence for these predictions from modeling results:
“There is evidence from modeling studies that future tropical cyclones could become more severe, with greater wind speeds and more intense precipitation. Studies suggest that such changes may already be underway; there are indications that the average number of Category 4 and 5 hurricanes per year has increased over the past 30 years. Some modeling studies have projected a decrease in the number of tropical cyclones globally due to the increased stability of the tropical troposphere in a warmer climate, characterized by fewer weak storms and greater numbers of intense storms. A number of modeling studies have also projected a general tendency for more intense but fewer storms outside the tropics, with a tendency towards more extreme wind events and higher ocean waves in several regions in association with those deepened cyclones. Models also project a poleward shift of storm tracks in both hemispheres by several degrees of latitude”.
Introductory Activities
Introductory ActivitiesInvestigating Coastal Community Vulnerability Around the World
The following two pages include a look at coastal communities around the world and their relative vulnerability to coastal flooding, based on research. These materials are important to developing a context for the course and can also form a foundation for the Capstone Project. These pages include Learning Check Points designed to help enhance your understanding. These questions are asked for your benefit; you are encouraged to answer them, since they frequently introduce methods and applications that you will need to use again during graded assessments and in your Capstone. They are not for credit, but you need to take the time to do them, as they are often required knowledge for other assessments.
To get started on the Module 1 Learning Check Points, click the first link below or use the menu.
Learning Check Point: Summarize an Article
Learning Check Point: Summarize an ArticleRequired Reading
Take a few minutes to read Population Plus Climate: Why Coastal Cities Will Face Increased Risks From Floods: A new study names the global cities most at risk of coastal flooding - both today and in a warmer future (Time Magazine, Aug. 20, 2013). After reading the article, please answer the questions below. Note: There is no credit for this activity, but you are expected to know the material for quizzes.
Learning Check Point: Compare Cities
Learning Check Point: Compare CitiesBackground: World Bank Study – Ranking coastal cities according to the risk of coastal flooding.
In the report published in the journal Nature Climate Change in 2013, authors from the World Bank and other institutions created a ranking system for the vulnerability of coastal cities around the world. In the report, the authors “provide a quantification of present and future flood losses in the 136 largest coastal cities”. (Hallegatte et al, 2013).
The measure used for ranking is Average Annual Loss (caused by flooding). If the Gross Domestic Product (GDP), a measure of the wealth of the community, is factored in, this changes the ranking as a greater proportion of the GDP of poorer communities is likely to be affected by a flooding event. This causes poorer communities to rank higher when the GDP is included in the calculation. It is a known fact that the poor are disproportionately impacted by a catastrophic event such as a flood, as they have less capacity for recovery.
Several factors must be taken into account to calculate a city's vulnerability and to project this vulnerability into the future - see below (those cities with lower country GDP have a greater % of GDP affected by flood loss):
- the wealth of the city's country (GDP);
- relative sea level rise in the area;
- population and population growth trends;
- property values;
- flood protection measures;
- storm frequency in the area.
These factors will be studied in more detail later in the course. In this module, we will explore some of the data from the above-referenced report and take a look at the cities that rank in the top 10 of the 136 cities at risk of coastal flooding.
In Module 1 Lab, you will use Google Earth to “travel” to at least two of these cities to learn what makes them vulnerable.
Activity: Compare Cities - World Bank Study – Ranking of coastal cities' vulnerability to coastal flooding.
To prepare for the Module 1 assessments, read through "Which Coastal Cities Are at Highest Risk of Damaging Floods? New Study Crunches the Numbers" The World Bank, August 19, 2013.
| List A - City - Overall Cost (Average Annual Loss) | AAL (US$ Million) | List B - City - AAL as of % of City GDP | AAL as % of GDP |
|---|---|---|---|
| 1. Guangzhou, China | 687 | 1. Guangzhou, China | 1.32 |
| 2. Miami, USA | 672 | 2. New Orleans, USA | 1.21 |
| 3. New York, USA | 628 | 3. Guayaquil, Ecuador | .95 |
| 4. New Orleans, USA | 507 | 4. Ho Chi Min City, Vietnam | .74 |
| 5. Mumbai, India | 284 | 5. Abidjan, Ivory Coast | .72 |
| 6. Nagoya, Japan | 260 | 6. Zhanjiang, China | .50 |
| 7. Tampa, USA | 244 | 7. Mumbai, India | .47 |
| 8. Boston, USA | 237 | 8. Khulna, Bangladesh | .43 |
| 9. Shenzhen, China | 169 | 9. Palembang, Indonesia | .39 |
| 10. Osaka, Japan | 120 | 10. Shenzhen, China | .38 |
In List A, the top four cities alone (3 of which are in the US) account for 43% of the forecast total global losses. Highlighted in bold red are the cities that appear on both lists.

Please take a moment to compare lists A and B in Table 1.1 above. When you are ready, answer the questions in the Learning Checkpoint below.
Note: There is no credit for this activity, but you are expected to understand the principles (i.e., don't learn the ranking or the data) for assessments.
Learning Check Point
Module 1 Lab A: Discussion
Module 1 Lab A: DiscussionIntroductions and Exploring US Coastal Property Risk from Rising Seas Interactive ArcGIS Story Map
Overview
This discussion will allow you to introduce yourselves to each other while diving into some core content.
In this module, we have examined the global distribution of cities identified as most vulnerable to coastal flooding and considered the multiple variables that determine a community's ranking.
For the Module 1 Lab A Graded Discussion, we will spend time looking at one more source of data that can be used to look at future scenarios for U.S. coastal communities and their risk of chronic inundation in the future. You will use this tool to explore what this may mean to a couple of coastal communities and respond to a prompt on this topic in the discussion forum. You will also respond to at least one other student's responses throughout the week.
Once you read this description, return to your course management system to participate in the discussion.
Required Resources
To stimulate the discussion, please complete the following steps:
Listen to at least the first 10 minutes and 30 seconds of Got Science? Ep. 36: Coastal Homes and Properties at Risk: Sea Level Rise, Flooding, and Inundation, Podcast.
Click for a transcript of the Podcast: Got Science? Episode 36: Coastal Homes and Properties at Risk: Sea Level Rise, Flooding, and Inundation.As we’re recording today, it’s just past the first official day of summer. I happen to live year-round in a beach town here in Massachusetts—so for me, that means it’s tourist season. They’ve arrived and they’re everywhere!
Some folks come to spend the summer in my town, where they have houses that may have been handed down in their families for generations. Some folks come for a few weeks at a time and stay in a summer rental or the local hotel steps from the water. And some folks make the drive down from Boston to lie out on the beach for the day and grab a bite to eat.
So many people have fond memories of spending their long summer days in my town. I do, too, of course… since I live there by choice. And so much of our local economy depends on tourism and the revenue generated by the people who visit us and spend money at our businesses.
So I’ll be honest: I kind of didn’t want to have the conversation that follows with today’s guest, my colleague, Dr. Rachel Cleetus. It’s not that I don’t want to talk to Rachel! She’s fabulous. But she’s an economist and a sea level rise specialist here at the Union of Concerned Scientists. And her team has just released a new report on coastal real estate…and how sea level rise is a serious and unaccounted-for threat to millions of dollars worth of homes and businesses located in seaside cities and towns like mine.
Rachel is our lead economist and policy director, which means she can clearly see how rising seas can spell real financial trouble for coastal communities. She joined us to talk about the implications of this new research, what it means for towns like mine and the people who live there…and what she would do differently if she were crowned Queen of Science-Based Sea Level Rise Policy.
Colleen: Rachel, thanks for joining me on the Got Science? Podcast.
Rachel: Thank you so much for having me, Colleen.
Colleen: So you're one of the authors of a report that was recently released titled "Underwater: Rising Seas, Chronic Floods, and the Implications for U.S. Coastal Real Estate." So tell me about the analysis and who you're trying to reach.
Rachel: Well, with this analysis, what we were trying to do was look at the risk to coastal properties all along the lower 48 states of the U.S. from chronic inundation. And this is regular high tide flooding that's getting worse because of sea level rise. We're seeing high tides get higher reach further inland, and this is putting a lot of property and people in harm's way.
Colleen: And what's the time span that you're looking at?
Rachel: With this analysis, we're looking as near as 2045, within the lifetime of a 30-year mortgage issued today. And then we go out to the end of this century, looking at this risk of chronic inundation, which we define as 26 times per year or more of high-tide flooding.
Colleen: So this is not from major storms; this is happening throughout the year on a regular basis; places are flooding?
Rachel: The reality is, even in the absence of storms, this type of high-tide flooding is getting worse because of accelerating sea level rise.
Colleen: So, how did you approach the analysis? What data did you use?
Rachel: We started with data from NOAA, which basically looks at sea level rise today and projections out to 2100. We localized these sea level rise projections because in many places along the east and Gulf coast of the U.S., we're actually seeing higher and faster rates of sea level rise because of other local factors like land subsidence. And onto this data, we intersected a property dataset coming from Zillow to look at the properties at risk from high tide flooding.
Colleen: So you can actually...you're actually looking at a community and saying, by 2045, X number of houses will be underwater or really no longer in livable condition?
Rachel: By bringing together this data from NOAA on sea level rise and the property data from Zillow, we are able to tell at the zip code level how many properties, the value of properties, and the tax base those properties represent that are at risk from chronic inundation.
Colleen: So, who are you really trying to reach with this report?
Rachel: Our aim here with this research is really to inform people about what the science is telling us about this looming risk that's flying under the radar, frankly, at this point, in many parts of the U.S. coast. So we want people to be educated to make decisions about key things like the homes they own, which are often people's single biggest financial asset, based on the best available information about the kind of risk that's coming our way because of climate change and sea level rise.
Colleen: Let’s sort of zoom in on the map. What were some of the communities, cities, and areas that are going to see the biggest impact?
Rachel: Well, with this research, what we found was that there are some parts of the country, particularly in places in Florida, New Jersey, California, and New York, that are very highly exposed in terms of the number of properties and the value of that property that is at risk. That said, there are many other places where, in dollar terms, the value may not be high, but these are still people's single biggest asset. So ordinary working-class communities, low-income communities where the homes may not be super expensive, but these are people's only homes. And there are many, many of those types of communities as well in New Jersey, North Carolina, Massachusetts, Louisiana, all around the country, many communities that might see a significant portion of their housing stock at risk, as well as their local property tax base.
- Open the "US Coastal Property at Risk from Rising Seas" story map.
- Read the Introduction.
- Set the map on the By Community tab.
- Zoom out so you have a good view of the Atlantic coast. Choose a city/ community that you have some familiarity with (for example, Atlantic City, NJ) to focus on.
- Move to the Gulf Coast. Choose and city/ community to focus on (for example, St. Petersburg, FL).
- For your Atlantic Community, on the Town by Town page, start with the Homes 2045 tab. Now go to Homes 2100.
- Make notes on the number of homes at risk of chronic inundation in the chosen community in 2100 compared to 2045. Make notes on their value and how much they contribute to the local tax base.
- Repeat the steps above for a chosen community on the Gulf Coast. Make notes to compare the number of homes affected, their value, and how much they contribute to the local tax base for 2045 and 2100.
- What Factors are taken into account in this mapping tool to estimate the future scenarios for these coastal communities?
- Write a response in your course management system to the prompt below.
Discussion Prompt
Please write a short personal introduction and tell us about yourself, and what interests you about this course. Perhaps you have personal experiences from living or vacationing in a coastal city. In addition to your introduction, after listening to the podcast and exploring the interactive mapping tool, and your observations from these two sources, briefly describe what a homeowner is facing in the next 25 years in one of the two communities you chose to examine on the map (include the name of the city). How does this change in the 50 years following this period? What advice would you give to a 30-year-old person buying property in this location with a 30-year mortgage who is planning to raise a family in this community? Provide evidence from this module to back up your answer.
 Statement of Use of AI on Exams, Quizzes, and Labs
Artificial Intelligence (AI) may NOT be used to answer questions in exams, quizzes, and labs.
Instructions
- Use Word or another text editor to respond to the prompt with your thoughts backed up with evidence from Module 1. The length of your response should be between 200 and 400 words. (Typing your response in Word or another text editor and then copying/pasting from Word or similar to this discussion forum is recommended to avoid losing your work midstream in the event of an accidental browser closing, intermittent Internet connectivity, etc.)
- Go to the Module 1 Lab A (Discussion) Assignment in your course management system.
- Type or copy/paste your response to the prompt into the text box marked 'reply' and select Post Reply by 11:59 p.m. Thursday.
- Your response is now visible to your classmates and your instructor. Read through others’ responses and write a thoughtful reply to at least one other student by the date listed on the calendar. These replies should be either a rebuttal in which you add your ideas in the form of a persuasive argument (written with respect for the originating author), or a response that agrees with, supports, and builds upon the original response. Because a timely response to the conversation is part of your grade, subscribing to the forum is required. Check in to the discussion forum often throughout the week to post and respond to comments. Your responses to at least one other classmate should be posted by 11:59 p.m. Sunday to allow for authentic discussion to occur.
Grading
The grading rubric will help you understand what constitutes an appropriate level of participation on your part. The instructor reserves the right to not award any credit (including points for timing and interaction) if the content of the posts, however on-time they may be, is off-topic, offensive, or otherwise inappropriate. Such posts may be deleted at any time by the instructor as well.
| Content | Addresses all facets of the assigned discussion prompt, with accurate supporting detail where necessary. A response post is at least 200 words of substantive content addressing the prompt. Posts are appropriately cited as needed. To earn full credit in this category, your comments and reply to a classmate must demonstrate thoughtful consideration of the topic and go well beyond, "I agree with you." | 6 Points |
|---|---|---|
| Formatting and Mechanics | Posts should be edited and cited appropriately as needed. While a discussion forum has an informal tone, please refrain from foul or offensive language, texting abbreviations, etc. | 2 points |
| Timing | This assignment is deliberately structured to allow you to participate throughout the week. Your initial response to the statement should be shared by 11:59 p.m. Thursday and your response to one other classmate by 11:59 p.m. on Sunday to allow for authentic discussion to occur. | 2 points |
Module 1: Lab B (Using Google Earth)
Module 1: Lab B (Using Google Earth)Introduction
In this Lab, we present two coastal communities at risk from coastal hazards - Guangzhou, China, and New Orleans, USA. You will use Google Earth tours to explore these communities. For each place, you will spend time looking at ground level views to gain an overview of the place in terms of its elevations; proximity to tidal water; the type of topography in the area (are there higher elevation places nearby?); the presence of major river/ river delta; presence or absence of flood control structures. If you are not sure of something, make observations in Google Earth, read the profiles in the online materials, go to links to more profiles, and/or search for specific information about the topic on the Internet. You will compare and contrast the economic factors that drive society in the two communities. The goal is for you to become fully comfortable using Google Earth.
Google Earth Resources for the Module 1 Lab
The best strategy for working through this Lab is to first read over the instructions for Google Earth so you have everything set up correctly on your computer and have a good understanding of what you will need to do. Before beginning this assessment, you should have visited the Google Earth Pro Download and Tutorials page in the Orientation section, watched the Google Earth Tutorials, and downloaded Google Earth Pro. If you haven't completed these steps, please go to the Google Earth Pro Download and Tutorials page now to prepare for using Google Earth. Probably the most valuable starter resource is the Science Education Resource Center (SERC), which has an extensive tutorial document that is extremely useful.
Additional short Google Earth Tutorials are linked below. These cover basic features for review, which may help if you are just beginning to use Google Earth.
Video: How to use Google Earth for Beginners (7:20)
How to Use Google Earth for Beginners
PRESENTER: After you install Google Earth, you will be presented with this screen here, and we're going to give you a quick overview today of how to use Google Earth. First, I wanted to clarify that, when you're using Google Earth and viewing the images that are created in Google Earth, they are not live images. They're usually between one and three years old. So first, let's look at navigation. When you're looking at the Earth here, you can click and drag the Earth, and orient it in any direction you'd like. If you look over on the right-hand side, you've got a series of tools. The one on the top is putting north at the top of the screen like a normal map. You can rotate the Earth by rotating the compass. Next, you can use the Move tool down below to rotate the Earth and orient it in right-to-left, up and down. I think it's easier to click and drag the Earth whatever direction you'd like it to move. Finally, this bottom tool is to zoom in and out of the location that you're looking at. You can accomplish the same thing if you have a rotating mouse wheel on your mouse. You can scroll in or scroll out to zoom very quickly into an area. You can see, when I zoom in, that the picture starts out blurry. And then, depending on the speed of your internet connection, if you just pause for a few seconds, you will notice that the image becomes clearer and clearer.
The clarity of the image depends on the resolution of the image based on that particular area. Some areas get a real high-resolution image. Some do not. And we can look at the bottom left-hand side of this map. And it tells us that the image that we're currently looking at was taken in March of 2012. We have the exact coordinates of where we're pointing on this map right here, including the elevation of this particular point on the Earth. And then way over on the right-hand side, depending on how far you've zoomed in, you can see where you would be approximately in height. So at the moment, we're 7,000 feet above this city. The closer I zoom in to a particular point, the more blurry you may find that the image becomes. Here I'm only 2,000 feet. I get way into this little water slide. I'm only 1,400 feet above the water slide. But you can see, it gets quite blurry.
So I can zoom back out and get a clearer view of that area. Because it is a Google product, Google excels in search. So, in the upper-left-hand side of your screen, here is the Search box. So if I type in something like Empire State Building, it knows what I'm talking about. And it'll immediately take me to that point. So you can type in the names of structures. You can type in the name of a city. You can type in a full address if you know an exact address. And it will bring you directly to that spot. So use the Search engine up here in the upper left to quickly find things that you want to look for. The next thing I want to show you on the left-hand side of the screen are what are known as Layers. Layers let you overlay the map with all kinds of different information, from the roads to 3D buildings. You can put in the weather, all kinds of different things.
So I'm going to take all layers off, so you can see what it looks like without the layers. And then if I add layers-- for example, borders and labels-- then I get state, and country borders, and of course, the labels for what I'm looking at. If I click Places, now I start getting names of cities, names of geographical points like oceans, rivers, et cetera. If I click Photos, now I get all these little dots on my screen. And I can zoom in. I'll go back here to New York City. So when you click on one of these little icons, you can get a photo. And sometimes you'll see multiple photos from the same spot. So experiment with Layers. There's many different things you can do there. And it allows you to learn more about an area. One quick thing I will show you while I am in New York City is the 3D buildings. If I click 3D buildings-- not all areas have it-- but you can start to see that the buildings are starting to get a little bit of texture to them. Once you have enabled 3D, or even if you have not enabled 3D, you can use your compass up here to tilt and get a 3D look at the landscape. So I'm just hitting these little arrows here to get a 3D view of the landscape as I see it. Some other features that have been added to Google Earth are Google Sky. And that, you can get to up here from your toolbar. Click on this little Saturn. And then click Google Sky.
So you can drag it around, zoom in, zoom out, and even search, just like we did with the regular map. Also, under the little Saturn icon up here is Google Mars. And again, they're using various NASA and USGS satellite expeditions and putting in some of the imagery from those missions. And lastly, underneath the Saturn icon is the Moon. And you can explore the Moon, just like you can Earth and Mars. One last feature that I'm going to take you back to Google Earth-- that I want to show you is the ability to measure distances very quickly and easily.
So let's say you wanted a rough estimate of how far across the United States it is. You could click the Ruler up here on your toolbar. Make sure Line is selected. Choose what measurements you would like. So I'm going to choose kilometers because I'm trying to learn the metric system. Then I'm going to click on one spot, and then let go of the mouse, and then click on the final spot. And it tells me that that is approximately 4,089 kilometers. Or I can change that on the fly to miles-- 2,500 miles. Now, if you've been to a new city and you would like to measure a walk that you did-- and let's say you got left at the airport, and you had to walk up the strip from the airport. So I can click Path. After I click the Ruler, I get this little box. I can click Path. Then I can start my clicking.
We'll just start from over here by the airport. And then we'll go all the way over here to Las Vegas Boulevard. And let's say we walked up quite a few blocks. Then we walked back across here, then over to here, back to the strip. And it tells me I walked 3 and 1/2 miles. So there is a way to measure a path that you'd like to measure using Google Earth. So we touched on just a few of the basics with Google Earth today. Have a lot of fun experimenting and learning from the amazing resource that Google Earth is.
Video: Google Earth Advanced Tools 2016 Tutorial (11:32)
Google Earth Advanced Tools 2016 Tutorial
PRESENTER: This video focuses on some of the amazing things that you can do with Google Earth. In previous videos that I've made I taught the basics of using Google Earth, as well as how to use these layers, how to add them in, take them out, and some of the best layers and what they can do. So please check out that video. And then I also have another video which shows how to create your own Google Earth tours, whether they be narrated tours or not narrated. So please check out those two other videos on Google Earth. But the focus of this particular video is going to be on these tools that are across the top of the Google Earth window. So let's look at what they're for. And let's just start with the first button that's there at the top. And this is the hide or show sidebar button. It's as simple as clicking it to make the sidebar disappear and go full screen with the image or you can click it again to get the sidebar. I usually leave it like this. 99% of the time I want the sidebar there, so I just leave it as is. Let's look at the second button. We have what's called the Add Placemark button. And this, for a lot of people, is a mysterious kind of thing.
Why would I want to do this? What is it and how would I use it? And what's it for? Well, basically it's for marking places on the map-- on the earth. Key places maybe in your own history or in the history of the world-- whatever it might be. So for example, what if I would like to mark all of the birthplaces of my immediate family? I could do that by flying to the first location. My dad was born in northern Mexico. So I'll just type in the name of his birthplace, click Search. And it zoomed in on that part of the map. Now at this point, I could put a little placemark there just by clicking Add Placemark. When you click that, it puts a pin on the map and that pin is movable. I can pin it in a very specific location or in a more general location, whatever you want to do. But let's say I want to mark this exact spot. I just drop the pin there. And then I could name the pin. I can put in a description if I would like to. You can also change the style, the color of the placemark, the view, and the altitude. So some pretty neat options that you have here. Then just click OK. And now that pin is in place.
Now notice that it adds it here to My Places. There's an entry here for the pin that I've just put in. And so now, any additional placemarks that I add should be listed here, as well. All right, let's move on to the next button. This is the Polygon button. If you click Add Polygon, it lets you click and then release the mouse. Click again, click again, and you can create a polygon using really, as many points as you would like. And this is used to designate parts of the map or parts of the earth as being something. So it's like you're creating a shape that covers an area. And then you could label this. For example, I could label this Family Property. Now, this isn't really true, but I could go in and label that as being part of my family property. I could go in and choose a style and a color. Click OK, click OK. And now I have an overlay that I've created that goes over the top of this part of the map of the Earth. Similarly, you can add a path just by clicking, moving the mouse, clicking, moving the mouse, clicking. I could create a path. So you could mark a journey this way. Let's say the Lewis and Clark expedition or other explorers-- you could map out their paths that they took. Kind of a neat thing. And once again, you can choose a color and so forth for your lines. When you're done, click OK. And it's added to the map, and it's added here to your places.
You can also do image overlays. And this is a little trickier. I've had mixed luck with this, but when it works, it's pretty cool. You can give it a name if you want to. And then what you need to do is find an image. I have an image here on my desktop, and I've selected that. And it pulls in the picture and adds it to my Google Earth map. So that's pretty cool-- an image overlay. Now, because this window is open, I can move the image, put it where I want it to be. I can resize it. And that's generally true of these other things that you add, as well. As long as the window that corresponds to the item is open, you're able to move them. But look, I can't move this pin. Why? Because it's window isn't open. This picture's window is open, so I can move it by clicking on the center of it and dragging. Just click OK when you're done.
Now, if you ever want to open up the window for each of these things or for any of these things, just right-click on one of them, choose Get Info. It pops open and now you're able to move them again. All right. Cool. Next up, we have a Record a Tour button. And you should watch my other video on this topic, so please check it out. But basically, you can click that and record your voice and do some cool things to make a tour. Next up, we have Historical Imagery button. And this is pretty exciting. When you click that, it gives you a timeline here in the upper-left corner. And this timeline is often just littered with horizontal lines that you can click on to see a historical image of that area. I'm going to fly to a really populated area. How about New York-- New York City, that is. And I just click Search and it should fly me to New York City. Once I'm there, you'll see that there are some historical photos of New York. I'm going to turn off 3D buildings. There's so many 3D buildings here, if I have that turned on it might crash my Google Earth. But anyway, this is what New York City looked like in 2016. And you can see that here. It says Image-- there's the image date-- 2016. And you can zoom out and zoom in. But if I want to, I can click and drag this timeline to go back to 2014. You can see down on the bottom-- Imagery Date, 2014. Now I can go back to 2007. That's what it looked like in 2007.
I can go back further-- further. In the case of New York, they even have a picture from 1974. There we have a picture from 1974, a historical photo of New York City. So check out this timeline tool, it's pretty cool. I'm going to restore it back to the most recent imagery. And I'm going to turn off that Historical Imagery button. And instead, next, I'm going to show you the sunlight option. When you click on this-- in some ways, it's similar, but instead of going back in time and seeing a historical photo, it just changes the time of day. So if you want to picture an area in the morning, change it to 8:00 AM in the morning. Right? But if you want to get a sense of what it would look like later in the day, change it to later in the day. Now, this also works once zoomed in on an area. It gives you a better sense of why you might use this tool when you change the lighting when you're more zoomed in. To be honest with you, I don't use that one much at all. But I like that it's available. Next up, we have something pretty cool and exciting. And that is there's a button here-- it looks like Saturn. When you click on it, it lets you switch from Google Earth and go to Google Sky, which is a wonderful tool for learning about the constellations, and the planets, and other things that are out there in space. So pretty neat. Very different from the actual Google Earth. This isn't necessarily a 3D experience. But you can still search for things, like constellations, landmarks-- I don't know if they would be called landmarks out in space, but you get the idea. So that's kind of fun.
You can also switch to Google Mars, which I really like. And as a young person, I had a telescope and I loved looking up at the sky, looking at the moon, and things like that. This is just a wonderful tool for people like me who are interested in space and the planets. You can get some really nice photography-- some nice images that are as accurate as we can make them of Mars, in this case. But in addition to Mars, there's also Google Moon. So again, it's searchable. You can even find the locations of the lunar landings and the different launch sites and things like that. So there actually are quite a few landmarks on the moon, and you can search for them or discover them by browsing. Lots of fun things you can do with this part of Google Earth. For now, though, I'm going to return to Earth and show you the last few tools that we have across the top of the screen in Google Earth. One that is very useful, and I've used this several times, is the ruler tool. If you click here where it says Show Ruler, it gives you the ability, with this window popped open, to measure anything on the earth. So, for example, I could measure the continental United States from west to east. And notice that the line curves along the surface of the Earth as you move. So pretty cool. I can click and drag and it measures that distance and it tells me what it is. 2,665.8 miles. If you don't want it in miles, you can change it to yards-- you can change it to meters, kilometers, feet, inches-- whatever you want to do that's listed here-- centimeters. So a fun tool, especially for teachers and others that might need to measure or teach units of measurement and things like that.
You can also do a measurement along a path. So, for example, I could just click, click, click, keep clicking, and it's measuring along that path, a fun and useful, and educational tool that's built into Google Earth. We also have the ability to send an email of a screenshot, or the current view, or a placemark that's here at the left, or a folder full of placemarks. So that's a nice built-in email option. You can print images that you see here. You can save pictures. So I can zoom in and basically take a snapshot-- take a picture. Tell it where to save it, tell it what the name is, and click Save. And you're going to have a picture that you can use in presentations or slide shows or whatever it might be. The last button that we have here at the top is View in Google Maps. And you can see what happens-- it opens up a window and it shows the location that you're looking at in Google Maps. So I hope that this video has helped to add to your knowledge of Google Earth. These are some nice tools across the top. But there's even more that you can learn about Google Earth, so please watch my other videos, including the one on how to make your own Google Earth tours. Thanks for watching this video. And please consider subscribing to my YouTube channel for more videos about technology for teachers and students. And watch for a new video at least every Monday.
Important Google Earth skills necessary for completing the Module 1 Lab
- Getting started – downloading or starting Google Earth Pro.
- Using the direction tools in the top right of the screen to maintain the north arrow and vertical view.
- Altitude - zooming in and out to a specific eye altitude.
- Turning layers on and off and navigating “My Places” in the left-hand pane.
- Opening the KMZ file provided (note you cannot open the file by double clicking on it, go into Google Earth and under the "File" tab choose "Open") and flying to the selected places by clicking on the name of the city.
- Measuring distance: Use the ruler tool to measure distance.
- Estimating area: Use the polygon tool to measure the area of a city.
- Finding coordinates; correct format for coordinates in search.
- Observing the elevation shown at the bottom right of the screen, using the mouse.
- Using the path tool to create an elevation profile.
- Changing units to metric. Be sure to set your units to kilometers for distance measurement and meters for altitude. These units will be consistently used throughout the course.
Downloads/Resources
KMZ file (Please note, there are many cities in the file. You only need to focus on Guangzhou, China, and New Orleans, but feel free to explore the other cities!)
City Profile: Guangzhou, China*
City Profile: New Orleans, LA*
*Profiles are also available on the next two pages.
Statement of Use of AI on Exams, Quizzes, and Labs
Artificial Intelligence (AI) may NOT be used to answer questions in exams, quizzes, and labs.
Instructions
Before you begin the Lab, you will need to download the Lab worksheet and Google Earth file. In addition, you will need to read the two City Profiles mentioned above. We advise you to either print or download/save the Lab worksheet, as it contains the steps you need to take to complete the Lab in Google Earth. In addition, it contains prompts for measurements and questions that you should take note of (by writing down or typing in) as you work through the Lab.
Once you have worked through all of the steps and completed the measurements, you will go to the Module 1 Lab B (Quiz) in your course management system to complete the Lab by answering multiple-choice questions. The answers to questions on this Lab worksheet will match the choices in the multiple-choice questions. Complete the Module 1 Lab B (Quiz) for credit.
City Profile: Guangzhou, China
City Profile: Guangzhou, ChinaBackground Information
The city of Guangzhou ranks as number 1 on both of the lists of vulnerable coastal cities of the world (World Bank), while Shenzhen ranks number 9 on List A and number 10 on List B. What makes these two cities, which are relatively close to each other geographically, rank so high on these two lists?
This discussion will include the region in southern China known as the Pearl River Delta, or PRD, which is within Guangdong Province, of which Guangzhou is the capital. Guangzhou (formerly known as Canton) is one of several cities that have merged to form a megacity. More detailed information on the economy of this rapidly growing region may be found in this Fact sheet about Guangdong Province:

The third-largest city in China, Guangzhou, is the capital of Guangdong Province and has a population of approximately 15 million people. Guangzhou is actually part of a megalopolis formed by the coalescence of several cities. To the south of Guangzhou is Shenzhen, which itself ranks 9 on List A and 10 on List B. South of Shenzhen is Hong Kong. The region of mainland China to the north of Hong Kong is considered one of the more progressive parts of China. In recent years, it has seen rapid economic and population growth.
The population of the city of Guangzhou is estimated to be a little over 14 million, presenting many issues for city leaders. The rapid growth has occurred mainly because of the influx to the city by people from rural areas. 15 million has been deemed Guangzhou’s maximum capacity, so city leaders are considering ways to control population growth, while at the same time planning for the relaxation of the one child per family rule imposed by the Chinese government.
This densely populated city sprawls across the Pearl River Delta, a low-lying coastal plain formed by the Pearl River and its distributaries as they enter the South China Sea. The low elevation of much of the most densely populated areas is significant to the overall vulnerability of the people living here to inundation in the event of a tropical cyclone and as a result of sea level rise.
Shenzhen, to the south, is part of the “Special Economic Zones” formed as part of the reform and opening-up policy in China. Shenzhen sits close to Hong Kong, and here people move freely between mainland China and Hong Kong.
Hong Kong is today considered a “Special Administrative Region” of the People’s Republic of China. China resumed sovereignty from Britain over Hong Kong in 1997. Because of its turbulent political history, Hong Kong is a cosmopolitan region with a large population of non-Chinese residents, setting it apart from its mainland neighbors. It is a mountainous coastal region with an area of a little over 1,000 km and a population of 7 million, most of whom live on the low-lying coastal fringe. This makes Hong Kong one of the most densely populated areas in the world. This densely populated fringe of land is highly vulnerable to inundation.
City Profile: New Orleans, Louisiana, USA
City Profile: New Orleans, Louisiana, USABackground Information
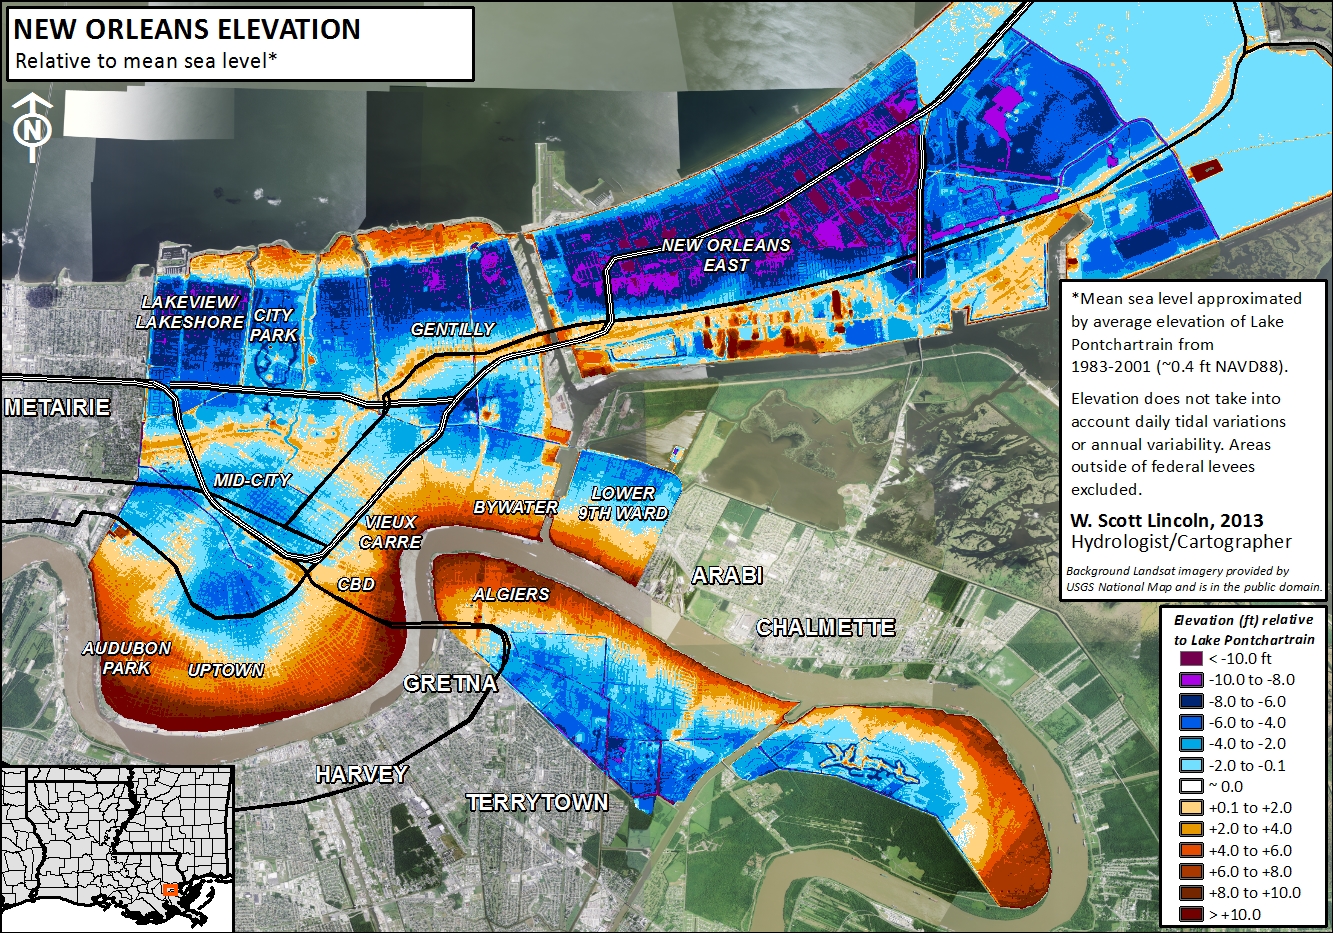
New Orleans was established more than 300 years ago on the banks of the lower Mississippi River for strategic and commercial reasons. The northern perimeter of this port city is the south shore of Lake Pontchartrain, a 629-square-mile bay open to the Gulf of Mexico. The city is surrounded, on all sides, by water and wetlands. Its growth to the currently occupied area was facilitated by draining the low-lying swamps and marshes between the Mississippi River and Lake Pontchartrain. Stormwater must be pumped out of the city with every rainstorm. The city’s relationship with water is currently defined by its complete enclosure within flood protection levees. The older levees protect the city from Mississippi River floods, while newer levees protect the city from inundation by hurricane storm surges from the Gulf of Mexico. The drainage and dewatering of the delta sediment on which New Orleans sits have caused compaction and subsidence so that the elevation of many areas of New Orleans is now below sea level.
The hurricane protection levee system (see image below) failed in 2005 when Hurricane Katrina’s storm surge breached it in many places. This resulted in the flooding of 80% of the city, filling the shallow bowl of low-lying land with salty water.
The population of New Orleans before Hurricane Katrina was 454,865. The 2012 census estimates the population to be 369,250, or 76% of the 2000 population (nola.com). Therefore, New Orleans is a smaller city than before Katrina in terms of the number of residents. The demographic and other changes in New Orleans since Hurricane Katrina are complex. Although parts of the city remain relatively unrecovered since the storm, other areas have made great improvements economically and in other ways (see the article from the Times-Picayune linked below).
Of the four coastal cities featured here, New Orleans is the only U.S. city, and it is the only one of the cities to weather a recent major disaster related to coastal hazards. It has received billions of dollars in recovery funds and undergone a major rebuilding of its flood defenses since 2005. These important factors should be taken into account as you analyze the coastal cities on the list and their vulnerability to coastal hazards. Another important consideration is the fact that the massive hurricane protection system of levees, flood walls, and gates, or the Hurricane and Storm Damage Risk Reduction System (HSDRRS), which was breached in Hurricane Katrina in 2005, has been repaired and received significant upgrades to the tune of $14 billion. If the World Bank study, completed in 2005, were repeated in 2015, New Orleans may have received a lower ranking, in spite of its location.


Summary and Final Tasks
Summary and Final TasksThis module has introduced some broad ideas about the distribution of communities around the world that are experiencing increased vulnerability to coastal hazards due to their proximity to tidal waters and various other geomorphic and societal factors. The module directed you to explore data compiled by the World Bank and other agencies that rank the vulnerability of coastal cities using many variables, including economic measures. You have gained experience in using Google Earth, a powerful free online tool that enables us to investigate places in terms of their physical (elevation, proximity to water, geographic location, etc.), and societal characteristics, including the economy. These tools have enabled you to make comparisons among cities across the globe and to reach your own conclusions about how these characteristics affect the vulnerability ranking. This module is designed to be a jumping-off point for the course and to lead into a more detailed look at coastal hazards and society.
Reminder - Complete all of the Module 1 tasks!
You have reached the end of Module 1! Double-check the Module 1 Roadmap (in Goals and Objectives) to make sure you have completed all of the activities listed there before you begin Module 2.
References and Further Reading
Hallegatte, Stephane, Colin Green, Robert J. Nicholls, and Jan Corfee-Morlot; Future flood losses in major coastal cities. Nature: Climate Change: LETTERS: PUBLISHED ONLINE: 18 AUGUST 2013 |, DOI: 10.1038/NCLIMATE1979.
Nature Climate Change: Supplementary Information - Future flood losses in major coastal cities.
Tatyana Deryugina, Laura Kawano, and Steven Levitt, The Economic Impact of Hurricane Katrina on Its Victims: Evidence from Individual Tax Returns.